 News
News  Market Data
  Discover
Support: 888-992-3836
Copyright © 2023 InvestorsHub Inc.


Register for free to join our community of investors and share your ideas. You will also get access to streaming quotes, interactive charts, trades, portfolio, live options flow and more tools.
Coffee Hits All-Time High
By: Barchart | April 26, 2024
• Coffee Hits All-Time High

Read Full Story »»»
 DiscoverGold
Stag Party. The Energy Report
By: Phil Flynn | April 26, 2024
Stagger Lee shot Billy DeLions and he blew that poor guy down. Yesterday’s gross domestic product showed higher inflation and lower growth than expected which brings back the memories of that 70s melody called stagflation wand blew that poor stock market down. Yet despite the turmoil, petroleum products remained resilient.
The US economy grew at just 1.6%, the slowest pace in almost two years, rising 3.4% in the fourth quarter of 2023, according to the Bureau of Economic Analysis (BEA). Economic forecasts had called for a deceleration of growth over the previous month, with the expectation that the economy would expand by 2.4%, according to a Reuters report. Janet Yellen, later in the day, tried to put a positive spin on the numbers claiming that the economy is really stronger than the numbers suggest. While that is partially true, it doesn’t explain away the sticky inflation. The personal consumption expenditures (PCE) price index, excluding food and energy prices — a key metric the Federal Reserve tracks to measure inflation — increased by 3.7% after rising to 2% in the fourth quarter. Inflation is going to be one of the biggest challenges for central bankers.
Oil prices shook off stagflation fears and rallied late in the session after trading down after the GDP report because overall the fundamentals for oil are looking more bullish. Not only do we have to price in geopolitical tensions going into the weekend, we also have to be concerned about the looming supply shortage that we are seeing in the global marketplace that will see all-time record demand next month.
Reports that Israel is stepping up its attacks in Gaza as they prepare for the Rafah invasion and the ongoing concerns about Ukraine’s attacks on Russia’s oil infrastructure, has geopolitical risk factors that continue to support prices. The World Bank is warning that a conflict in the Middle East could push the price of oil above $100 a barrel and that could reverse the recent downtrend in global inflation. They said that the recent drop and commodity prices have been leveling off even before the missile strikes in Iran and Israel, but they acknowledge that the complexity of rising commodity prices is going to make global central banks jobs more difficult especially when it comes to reversing the historic amount of interest rate increases. The World Bank is predicting that crude oil prices will average $84 a barrel this year but be careful because any disruptions could cause prices to spike.
On further review, the Energy Information Administration report is very supportive and while a lot of people are concerned about the weakness in US gasoline demand the record exports continue to support this market. The administration is very worried about the potential for a gasoline price spike going into the election and yesterday’s gross domestic product number didn’t help the overall mood of the market. Tanker trackers is reporting though that there’s been a record amount of ship-to-ship transfers totaling 116,000,000 barrels of Iranian crude oil worth $1.4 billion pre discount and were visually identified in the South China Sea all headed to China. The Biden administration continues to turn a blind eye to Iranian oil sanctions and even though the passage of new sanctions should allow it, Biden should really crack down on Iran. In fact, they have the tools to crack down on Iran, but they refuse to do so.
The Biden administration did impose new sanctions on Venezuela. It appears it’s not going to slow down Venezuelans oil exports completely. Not only will it not impact Venezuelan oil exports, they are already moving to cut deals with other countries.
Bloomberg News reports that, ”Spanish oil major Repsol SA expects production to climb with the addition of two oil fields in a joint venture with Venezuela, where the company is exempt from reimposed US sanctions. The company recently signed a deal with state-owned Petroleos de Venezuela SA that adds the fields to its operations, which in the next few months are expected to produce 20,000 barrels a day, doubling what the European major currently produces in one of its three ventures, Chief Executive Officer Josu Jon Imaz said in a call with investors Thursday. The expansion agreement was signed hours before the US reimposed sanctions last week on Venezuela’s oil and gas activities. Companies such as Repsol and Italy’s Eni SpA have said previously arranged waivers with the US government allow them to continue operating. The waivers allow Repsol “to continue operations as we have been doing so far, even with sanctions in force,” the CEO said.
How’s that green energy transition going for you. In Europe competitors are making energy decisions based on politics and not reality and is causing a huge backlash in the region. Not only have we seen riots break out with farmers angry about green energy regulations but now it appears that the EU once again has to pull back on some of its green energy mandates. There are reports that the EU countries are going to reverse a distilled fuel tax that had angered farmers that essentially could put them out of business. In the meantime, the German economy is struggling because of its green energy short sightedness mayor. This is a country that says that they want a carbon free future but then went ahead and closed down their nuclear power plants. Has the entire world lost all common reason and sense?
Reuters reports that The European Commission’s next sanctions package is expected to propose restrictions on Russian liquefied natural gas (LNG) for the first time, including a ban on trans-shipments in the EU and measures on three Russian LNG projects, three EU sources said. The Commission is in the final stages of ironing out its proposal and is engaged in informal talks with member states this week. The Commission declined to comment.
The new oil market action is very positive and the big question is how much of this is going to be geopolitical risk premium and how much of it is going to be based off supply and demand. We think that the market is still undervalued based on supply and demand and we think the talk of a huge geopolitical risk premium is overstated. While there’s no doubt there’s some geopolitical risk premium in the price of oil, there are reports saying it could be as much as $5.00 or $10.00 a barrel and that seems to be very high based upon the supply and demand realities that we face. For most of this year we have expected a supply deficit going into this part of the year and apparently it looks like that’s where we are headed. This is why we’ve been recommending staying hedged for most of this year and we still believe that there is upside price risk going into the end of the year and it could be significant.
Natural gas is trying once again to find some support even in the face of a very bearish weekly injection report. The supply glut is real and one of the big problems we continue to have with the natural gas market is Freeport LNG. Reduce flows to Freeport is a concern for this market because of the oversupply. We need to move as much gas as we can and it does not help when Freeport is down. The market is looking ahead to expanded Langport capacity in the future but the uncertainty surrounding the Biden administration’s study on LNG exports is going to continue to discourage investment in US energy.
Reuters reported that the second-largest U.S. liquefied natural gas (LNG) export facility has been running below 80% of its capacity due to technical problems, data from financial firm LSEG showed, denting U.S. exports. Since Jan. 15, Freeport LNG’s Quintana, Texas, liquefaction plant has been operating without at least one of its three gas-processing trains. In the last two weeks, it has taken barely enough gas for one of its trains to fully operate.
Read Full Story »»»
DiscoverGold
Sugar fell to its lowest price since January 2023
By: Barchart | April 25, 2024
• Sugar fell to its lowest price since January 2023.

Read Full Story »»»
DiscoverGold
Natural Gas Will Support Hold or Breakdown Continue?
By: Bruce Powers | April 25, 2024
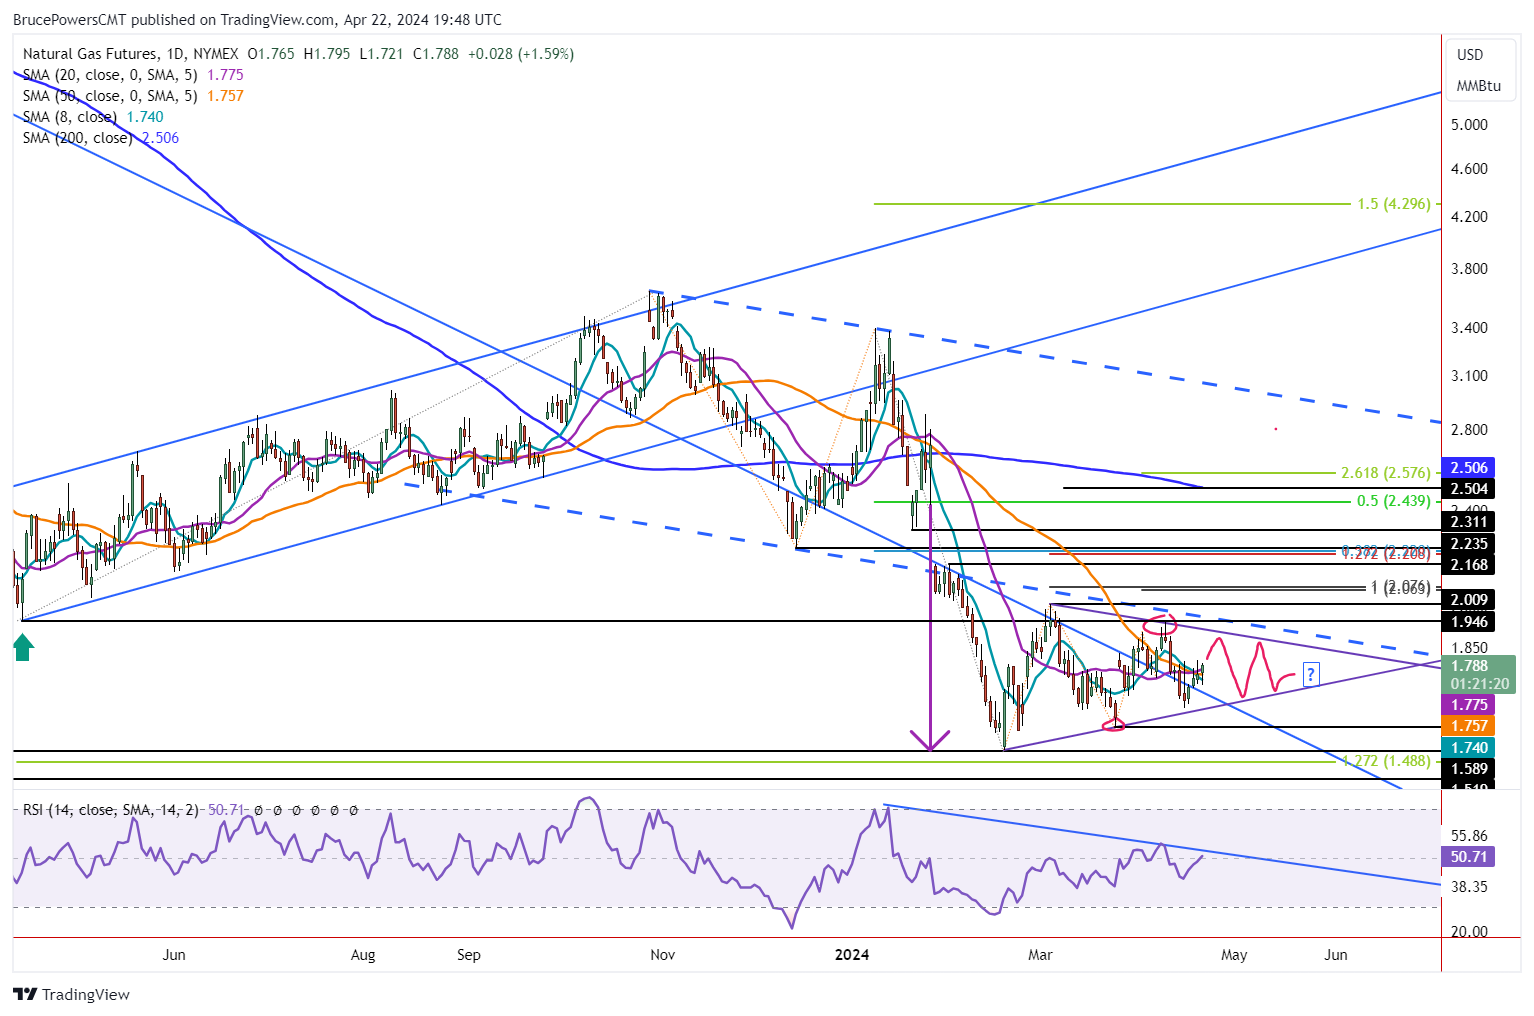
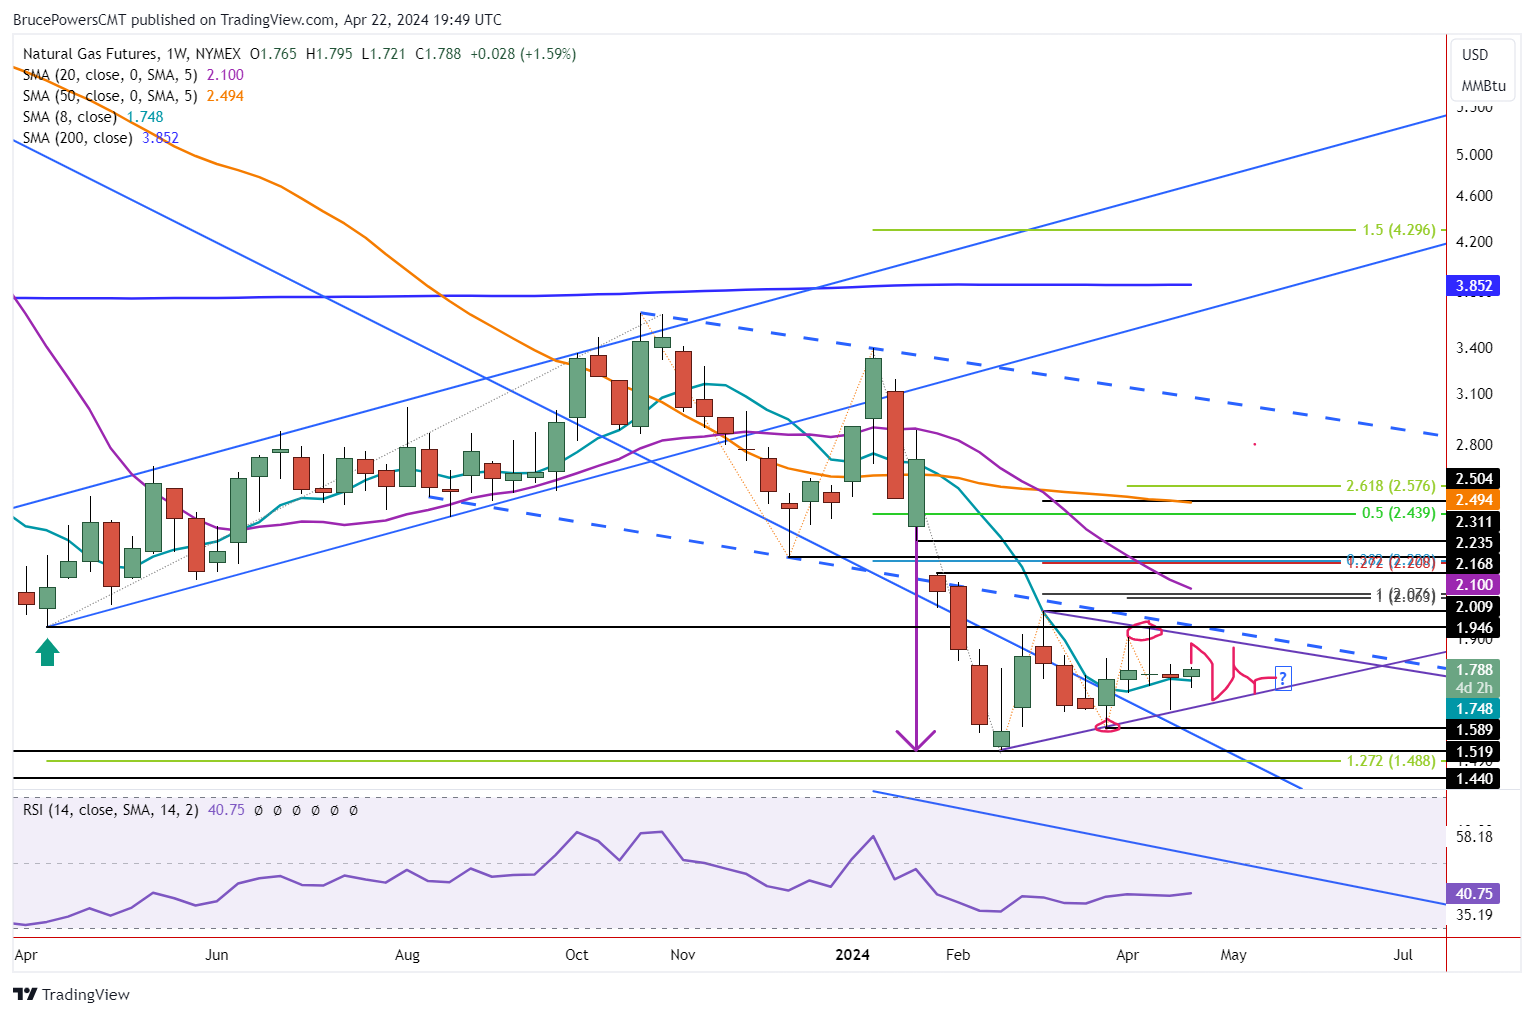
• Natural gas broke down from a symmetrical triangle, finding support at 1.60. Monthly support is at 1.59.
Natural gas breaks down from a symmetrical triangle on a drop below Wednesday’s low before finding support at 1.60 and bouncing. The high for the day was 1.675, which completed a test of resistance at the long-term downtrend line. Support is around the most recent swing low of 1.59. If broken to the downside and natural gas stays below it, lower prices may be coming.
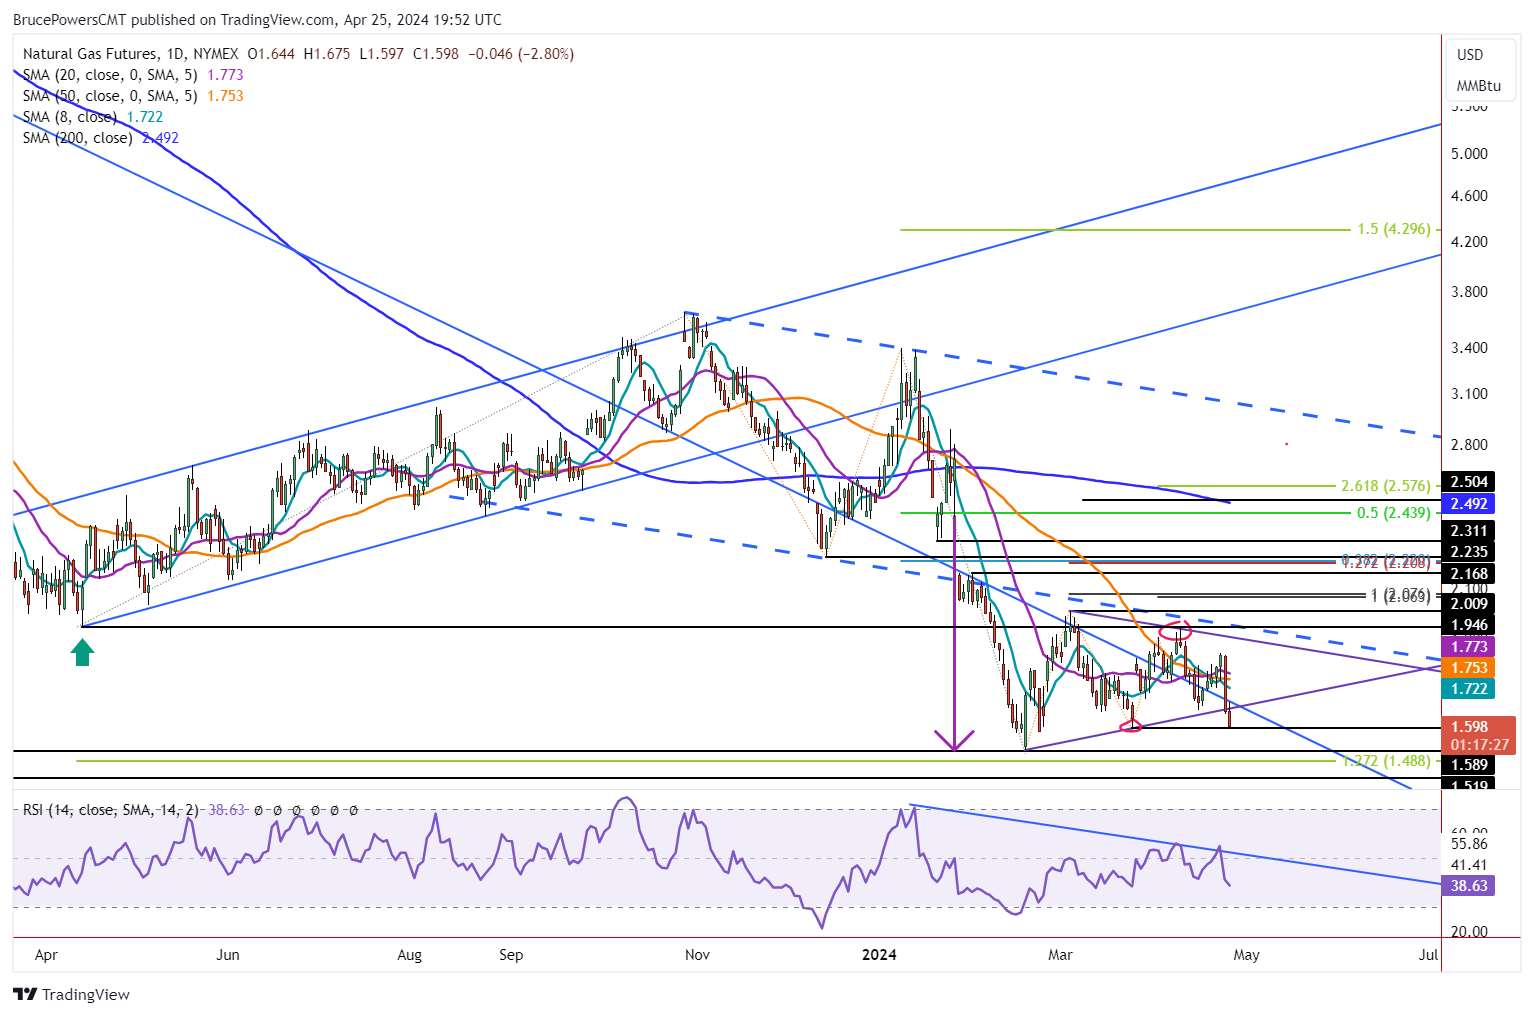
Breakdown in Play
The trend low of 1.52 from February is a significant support level going back 29 years. Although a breakdown from consolidation has triggered, downside follow through is key. Will selling pressure accelerate or support hold and eventually turn prices higher? There are no signs of it yet, but this possibility remains. A bullish sign will next be indicated on a rally above today’s high (at time of this writing) of 1.675. The key near term resistance level of significant is this week’s high of 1.84. Once there is a daily close above that price level the possibility of an upside continuation improves.
Monthly Support May Continue to Hold
Monthly support is also at the 1.59 swing low. During April natural gas has remained within the range from March forming a possible second sequential inside month. Therefore, a sustained breakdown below 1.59, if it occurs before the end of the month, will trigger an inside month breakdown from March. That’s a bearish signal that could be followed by an expansion of volatility.
Strong Support at or Above 1.52 May Continue
As noted above, the 1.52 price level is significant and may continue to act as support. Consequently, if volatility expands there is a possibility the 1.52 level is broken. If that happens the next lower target is around 1.44, a 29-year low. However, there is another price area to watch at 1.49. That is the target from an extended retracement of the six-month rally that began from the prior trend low a year ago.
Contraction in Volatility
If April ends without a breakdown below last month’s low, there will be two inside months further highlighting the decline in volatility experienced recently. As price compresses it prepares for its next move and a pickup in volatility. That could come from a bounce off monthly support or a breakdown.
Read Full Story »»»
DiscoverGold
Supplying The World. The Energy Report
By: Phil Flynn | April 25, 2024
While the US oil and gas industry continues to get bashed by the Biden administration, the reality is that the US oil and gas industry is providing supply stability to the global economy. US petroleum exports hit 12,094 million barrels a day which is an all-time record high but gasoline demand in the US is tepid at best. Still, global economic growth continues to suggest that global oil demand will break records next month and if that demand is going to be met, it will be because of the efforts of the US oil and gas industry.
The Energy Information Administration (EIA) reported the first US crude draw in 5 weeks, and it was a whopper, down 6.4 million barrels to 453.6 million barrels, in what may be the first of many. Gasoline demand though continues to be weak in a sign that consumers are feeling the pain of inflation as the demand over the last four weeks averaged 8.7 million barrels a day, down by 3.7% from the same period last year.
Yet gasoline inventories still fell by 600,000 barrels from last week and are about 4% below the five-year average as we exported 778.000 overseas. Distillate fuel inventories did increase by 1.6 million barrels last week and are about 7% below the five-year average for this time of year.
The world is becoming more reliant on the United States energy producer to fill the void in the global market that was partly created by bad energy policy in Europe that led to the war in Ukraine. And there are open worries from our trading partners that Biden’s policies in restricting production and by pausing liquefied natural gas exports terminals, is going to leave our trading partners and the global economy in a precarious state.
This comes as we are seeing warnings that the geopolitical risk factors surrounding oil and gas have not gone away and warnings from trading partners in Europe that the natural gas crisis may reappear next winter. The tightening supply situation comes against high anxiety and geopolitical risk factors that may get worse before it is better. Bloomberg reports that, “European Gas Traders Are Already Worrying About Next Winter and that Gas capacity deals at Russia-Ukraine border set to end and that Next winter gas is trading at a premium to all other contracts. They write that, “While demand remains muted and the region exited the heating season with the highest stocks on record, industry players gathering at the Flame conference in Amsterdam this week see risks mounting. And prices are responding. Worries include uncertainty over remaining Russian flows through Ukraine and rebounding gas demand in Asia. A colder-than-normal winter spurring consumption at home is also seen as more likely after two consecutive mild ones. The concerns are showing up in the futures market. The contracts for next winter are the most expensive on the curve.
A Rigzone report says that, “recent reports indicate that Iran intends to disrupt operations in the Strait of Hormuz, Dryad Global stated in its latest Maritime Security Threat Advisory (MSTA), which was released on April 22. “The most recent incident, the seizure of the MSC Aries, demonstrates that Iran, despite being preoccupied with missile operations against Israel, continues to interdict and control vessel movement in the Strait of Hormuz, Persian Gulf, and Arabian Sea,” Dryad noted in the MSTA.
Of course the Biden administration despite their policies that make oil and gas prices go higher, continue to insist they want to do things to get prices lower and we must admit that maybe they’ve succeeded in one area and that area would be Venezuela. Bloomberg reported that, “Chinese refiners are paying a little less for Venezuelan oil after the US reimposed sanctions on the South American producer. Merey crude, often used to make bitumen to pave roads in China, traded at a discount of $14 a barrel to ICE Brent in recent days on a delivered basis, according to traders. That compares to $11 before sanctions were reinstated last week, and $8 at the start of the year. China’s likely to draw more barrels from Venezuela after the US discontinued its six-month sanctions waiver, as other buyers, including India, shun embargoed oil to avoid run-ins with Washington. An average of 130,000 barrels a day previously bought by Indian refiners and 174,000 barrels a day of US-bound shipments could now be redirected to the world’s biggest crude importer, according to data intelligence firm Kpler.”
Reports of fires at refineries in Russia and Mexico are other reasons to be bullish for oil and products and we are not the only ones that are predicting record demand. Standard Chartered just put out a note that said that they expect that global oil demand will pick up strongly in May and June and will exceed 103 million barrels a day for the first time in May.
Once again, the preponderance of evidence continues to suggest there is significant risk of upside price movements in crude oil, gasoline and diesel over the coming weeks. We do think we’ll see a bounce back in US demand for gasoline when the weather starts to warm up, but the global demand will continue to keep US supplies very tight. Our global partners continue to be astonished how the United States it’s continuing to make politically motivated decisions to appease the environmental base while the global economy hangs in the balance.
Sure, you can contact me to find ways to hedge and trade this coming crisis. The commodity Supercycle is coming into play once again and copper recourse is one of the markets that we have to keep a real close eye on. Bloomberg reported that, “BHP Group Ltd. proposed a takeover of Anglo-American Plc that values the smaller miner at £31.1 billion ($38.9 billion), in a deal that would create the world’s top copper producer while sparking the industry’s biggest shakeup in over a decade. The No. 1 mining company proposed an all-share deal in which Anglo would first spin off controlling stakes in South African platinum and iron ore companies to its shareholders before being acquired by BHP. The total per-share value of the non-binding proposal is about £25.08, BHP said, a 14% premium to Anglo’s closing share price on Wednesday. A tie-up with Anglo would give BHP roughly 10% of global copper mine supply ahead of an expected shortage that many market watchers have predicted will send prices soaring.”
We do have natural gas inventories today and we’re expecting to see an injection of 85 BCF. The industry is going through some significant challenges domestically. The Biden administration needs to start signaling to the world that we are going to continue to be the world’s largest liquefied natural gas exporter. We need to stop playing politics with US energy and get back to reality that natural gas is going to be the best way to reduce greenhouse gas emissions in emerging markets along with increase use of nuclear power.
Read Full Story »»»
DiscoverGold
Wheat hits highest closing price in more than 3 months
By: Barchart | April 24, 2024
• Wheat hits highest closing price in more than 3 months.

Read Full Story »»»
DiscoverGold
Natural Gas Faces Breakdown Risk Amid Symmetrical Triangle Pattern
By: Bruce Powers | April 24, 2024
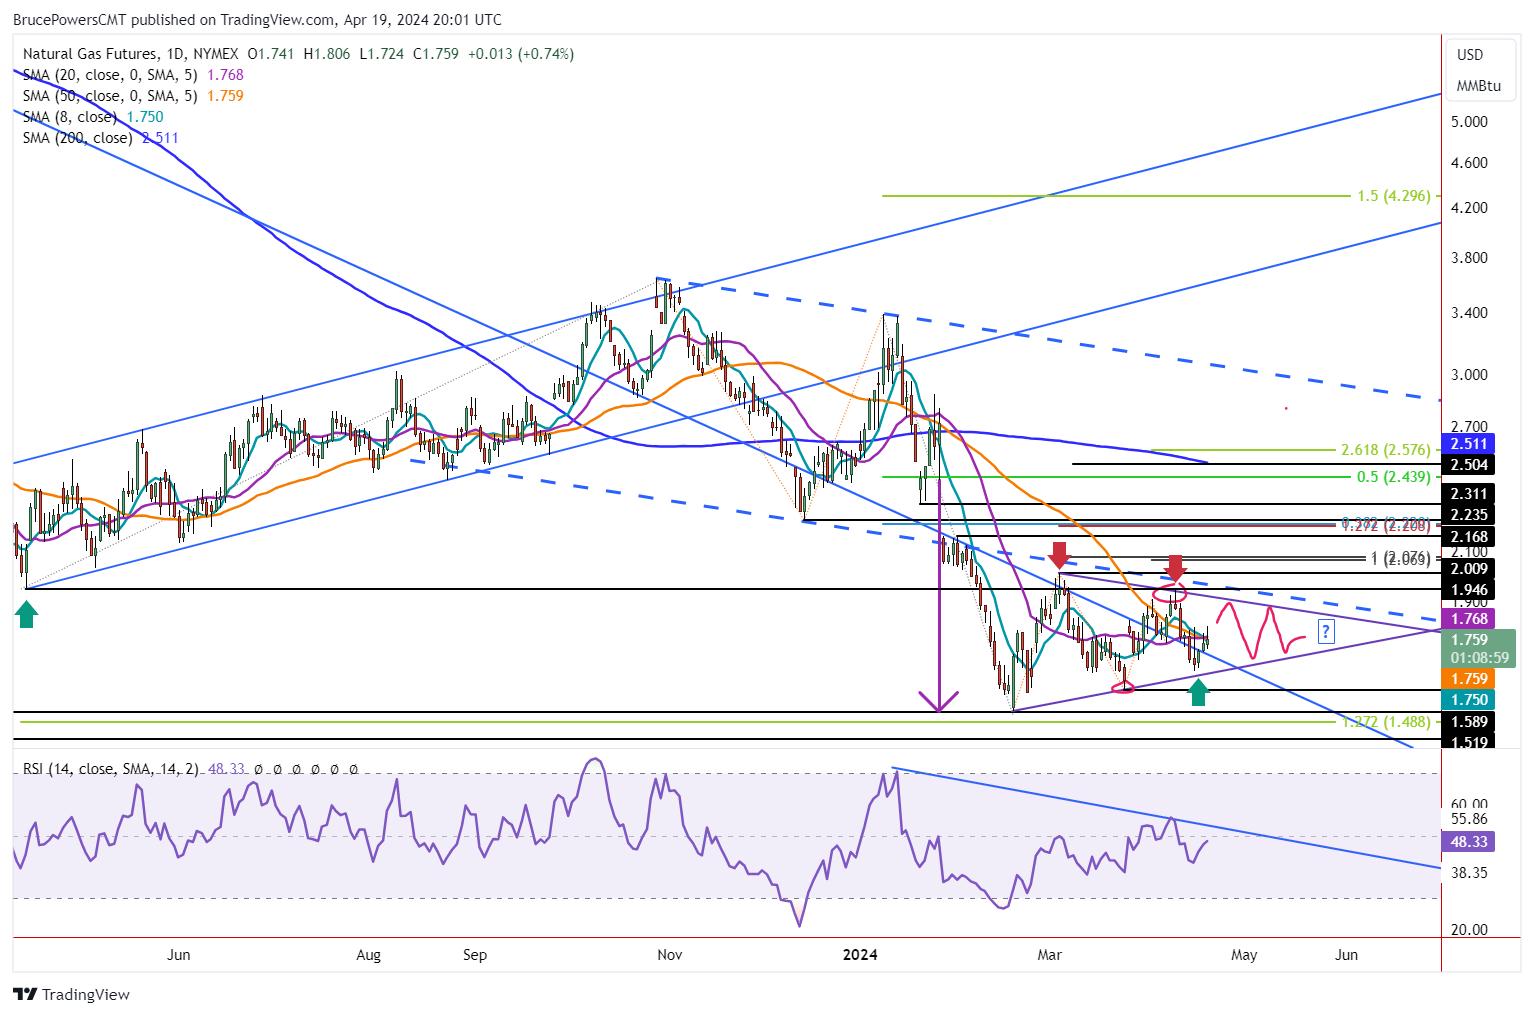
• Natural gas price faces a critical juncture as it tests support within a symmetrical triangle pattern, with implications for a potential breakdown. The current price action highlights the challenges of relying on patterns within consolidation.
Natural gas turns down and drops to a five-day low as heads towards a test of support at the lower boundary line of a symmetrical triangle. At this time of this writing the low for the day was 1.63, and trading continues near the lows. Today’s bearish reversal is occurring within a symmetrical triangle consolidation pattern, so the implications are less than if today’s bearish action occurred in a different part of the trend. However, that will change if a breakdown triggers a decisive decline below the lower boundary line. The prior swing low of 1.65 from last week has already failed to provide support.
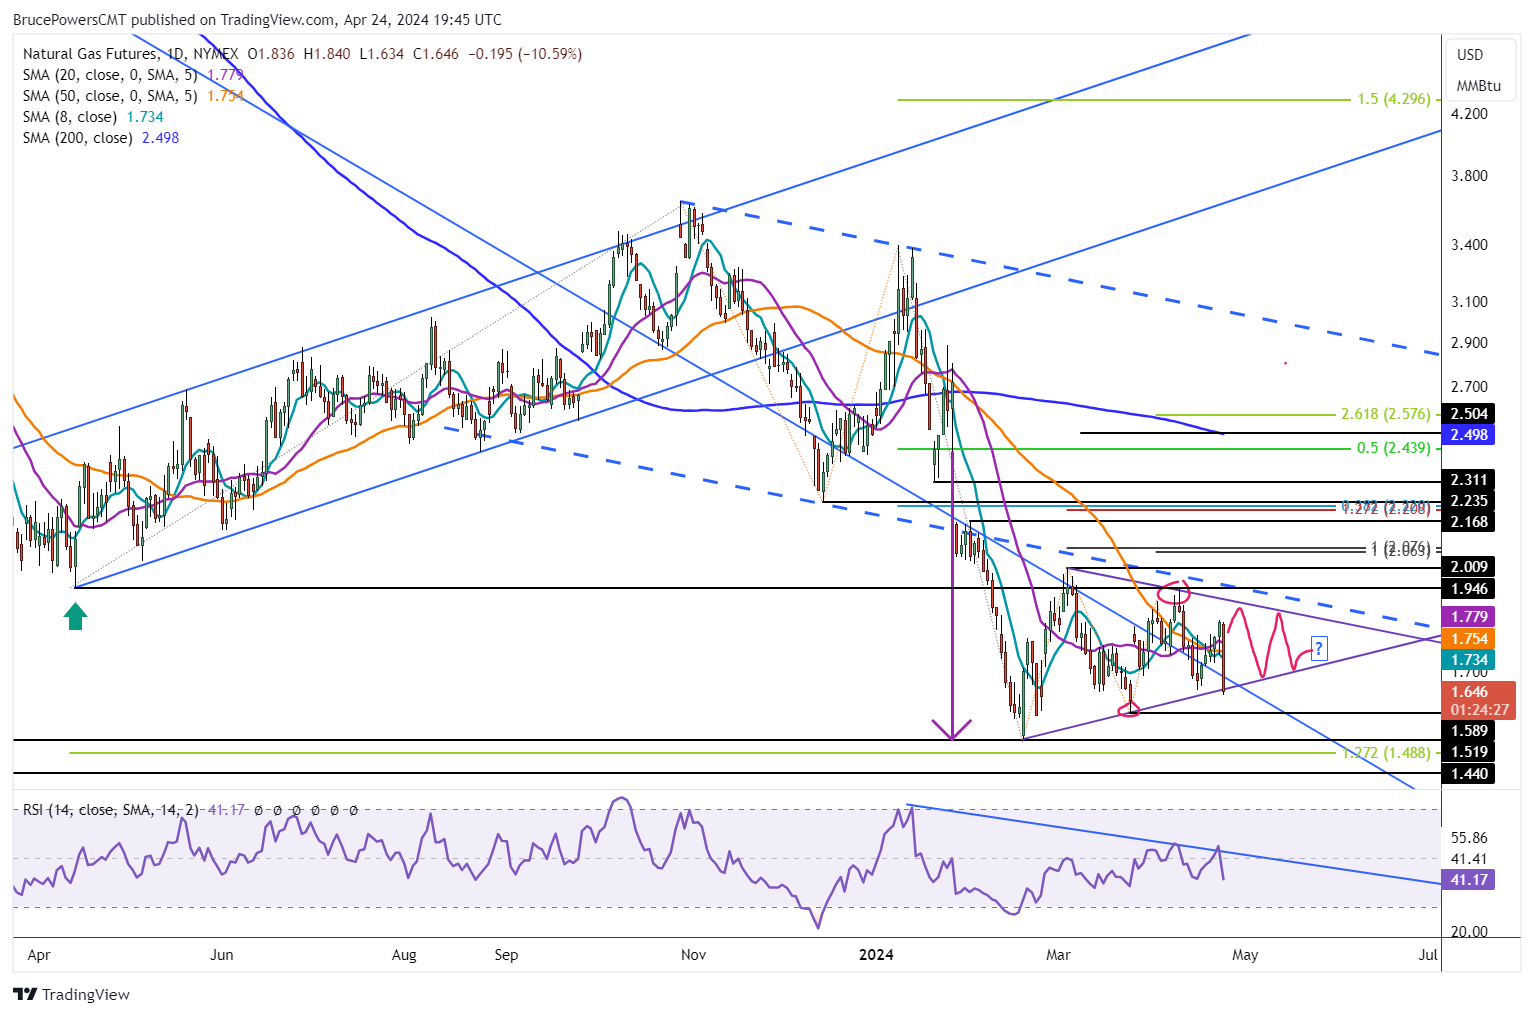
Weekly Support Fails
This puts the weekly bullish reversal of a hammer candlestick pattern that triggered on Wednesday at risk of failure. If the 1.63 price level is the lowest for the day, a drop below it will trigger a breakdown of the triangle pattern. Clearer bearish confirmation is indicated on a decline below the 1.59 swing low from March 25. The next lower target would then be the trend low of 1.52. That is the second lowest support level seen in natural gas in about 29 years. The lowest was 1.44 seen intraday, but the price quickly recovered, and the day ended back above the 1.52 level. In other words, 1.52 is a significant support area.
Support Seen at Bottom of Triangle
Today’s bearish price action is an example of why patterns within consolidation are less reliable to follow through. That is what is happening today following five days of positive performance and a strong close yesterday. It looks like today’s test of support at the lower boundary line may be the lowest price for the day thereby providing a third touch of the line. If it continues to act as support a bullish reversal may yet take natural gas back up towards the top line of the triangle.
Reaction Following Test of Support to Provide Clues
Thursday’s closing price will provide a clue. If natural gas can end the day above last week’s low of 1.65 it will be a slightly stronger close than being below last week’s low. But what happens next should provide further clarity. Either natural gas bounces off today’s low or breaks through it triggering a breakdown of the triangle.
Read Full Story »»»
DiscoverGold
Not Over. The Energy Report
By: Phil Flynn | April 24, 2024
Oil prices rebounded yesterday from signs that the geopolitical tension may not have eased as much as previously believed. After the close we saw the American Petroleum Institute (API) report that petroleum supplies came in tighter than the market was expecting. The API reported the crude oil inventories fell by 3.23 million barrels where the market expectation was that they were going to increase by 1.8 million barrels. We also saw a 595,000 barrel drop in gasoline inventories and distillate inventories eked out a gain of 724,000. Attacks on Russian oil infrastructure and commitments by Russia to lower oil production and keep exports steady should provide some support for diesel. We did see some weakness in a report that Chinese refinery runs fell by 919 kb/d to a seven-month low but that could be offset by signs that maybe this week US demand is going to look robust, at least compared to recent weeks.
The reduction of the war premium in oil came when it appeared that the global tensions between Israel and Iran had calmed down, yet that war premium is creeping back in on reports as Israel is warning civilians to get out of Rafah as they prepare an invasion. Reports say that Israel is getting ready to find tents for Palestinian civilians they intend to evacuate before the invasion. There’s also some speculation that Israel’s response Iran’s attack isn’t over yet and it’s just biding its time before it sends Iran a real message.
The House and Senate passed new sanctions on Iran. Last week Biden announced sanctions against Iranian steel and drone companies as well as 16 individuals on Thursday in response to last weekend’s aerial attack by Tehran against Israel. Yet the Biden administration is fearful to enforce sanctions on Iran? At first it was an attempt to appease Iran to try to cajole them into a new Iranian nuclear accord that supposedly fixed all the problems with the previous accord that President Trump rightly pulled out of. Now it appears that Iran just used the negotiations to fortify their economic position and their oil production and now it is seeing their exports hit a six-year high. Iran used its Biden oil windfall of course to fund their operations and support groups like Hamas, Hezbollah and the Houthi rebels.
While the Biden administration fails to enforce sanctions on Iran, the truth is that innovation in the oil and gas industry in the US could replace Iranian oil production if there was incentive to do so. Reuters reported that, “Technology advances are making it possible for U.S. shale oil and gas companies to reverse years of productivity declines, but the related requirement to frontload costs by drilling many more wells is deterring some companies from doing so. While overall output is at record levels, the amount of oil recovered per foot drilled in the Permian Basin of Texas, the main U.S. shale formation, fell 15% from 2020 to 2023, putting it on par with a decade ago, according to energy researcher Enverus.
Reuters writes that, “That is because fracking, the extraction method that emerged in the mid-2000s, has become less efficient there. In the technique, water, sand and chemicals are injected at high pressure underground to release the trapped resources. Two decades of drilling wells relatively close together, resulting in hundreds of thousands of wells, have interfered with underground pressure and made getting oil out of the ground more difficult. “Wells are getting worse and that is going to continue,” said Dane Gregoris, managing director at Enverus Intelligence Research firm.
But new oilfield innovations, which began being implemented more widely last year, have made it possible for fracking to be faster, less expensive and higher yielding. The advances in the past few years include the ability to double the length of lateral wells to three miles and equipment that can simultaneously frack two or three wells. Electric pumps can replace high-cost, high maintenance diesel equipment. “Companies now can complete (frack) wells faster and cheaper,” said Betty Jiang, an oil analyst with Barclays.
A drawback to the new simultaneous fracking technology, also called simul-frac, is that companies need to have lots of wells drilled and ready to move to the fracking phase in unison before they can proceed. Pumps inject fluids into and get oil and gas out of two or three wells at the same time, instead of just one. Because these act as an interconnected system, wells cannot be added piecemeal. But companies eager to cut costs have not deployed enough drill rigs to capitalize fully on the potential of the innovations.”
The Biden administration is very anti fossil fuel production in the United States. While they are trying to take credit for record oil and gas production, it’s clear that most of the gains have been made by innovation by the oil and gas industry and most of it has been done on private lands. Private oil and gas companies have been flourishing despite the attempts by the Biden administration to accuse them of war profiteering and price gouging. Matador Resources Co. pumped more oil than expected in the first three months of 2024 at a time when most US producers have pledged flat to moderate output growth this year.
Bloomberg reports that Matador’s 2% production over-performance to start the year was done while spending less money on drilling than projected, the company said. During the first quarter of 2024, Matador’s average oil production of 84,777 barrels per day beat its guidance of 83,500 barrels, the company said. “We now expect full-year production for 2024 at the high end of our previously announced average production guidance for oil of 91,000 to 95,000 barrels of oil per day,” the statement said.
The commodity super cycle comes in waves. Coffee and cocoa are making historic moves and industrial and precious metals are back in vogue. Major players have been taking notice and shifting their investments back to the futures. Bloomberg News is reporting that, “Some of the world’s biggest energy trading companies are returning to metals, years after getting burnt in the notoriously difficult markets. Vitol Group, Gunvor Group and Mercuria Energy Group are among the traders building out their metal’s teams, as they look to deploy capital generated by record profits. The shift comes as forecasters turn increasingly bullish on copper, aluminum and other metals, where long-anticipated production shortfalls are starting to take shape. Many commodities house’s also see strong links between metals usage and power markets — another growth area for traders according to Bloomberg.
What are we going to do with the electric car glut. The Biden administration says that we are in a race with China to control the EV market. The problem is that the Chinese consumers, like the American consumers, just don’t not want them. Oh sure, the International Energy Agency claims that, “over 20% of global car sales this year are projected to be electric, driving a transformative shift in the auto industry and cutting oil use for transport.” Yet these are the same folks that predicted that global oil demand would peak years ago.
Reuters reported that, “By most measures, the last thing China needs is more electric cars crowding a market with more losers than winners, driving down prices at the expense of profit and taking the fight for market share beyond China. And that’s just what it is getting. Automakers are expected to launch 110 EVs and plug-in hybrids in 2024, many at the Beijing auto show that starts Thursday. Those new offerings, dominated by Chinese brands, will join By contrast, there were just over 50 EV models on sale in the United States last year. But while there is a peril in China’s overcapacity, there is also a power in the hyper-competition it has unleashed, analysts, suppliers and executives say. China’s leading EV makers have found ways to slash vehicle development time, combining speed to market with new features and a pricing advantage rivals outside cannot match. the almost 400 “new energy” models already in China’s showrooms, according to industry data.” But the main problem is still sales, which even though they are growing in China, are not growing at the pace to get rid of the oversupply. And there doesn’t appear to be any plan to deal with the batteries once they start to go bad in 10 years.
Natural gas is still trying to put in a little bit of a bottom here. It has a tough road ahead. We are looking for an injection of 85 BCF this week.
Read Full Story »»»
DiscoverGold
$Wheat has exploded... from 523.50 about 8 weeks ago to today at 597
$Natgas is looking primed. TY
Wheat jumps 28¢ in the last 2 sessions.
Agriculture Master Report
By: Bill Moore | April 23, 2024
JULY WHEAT
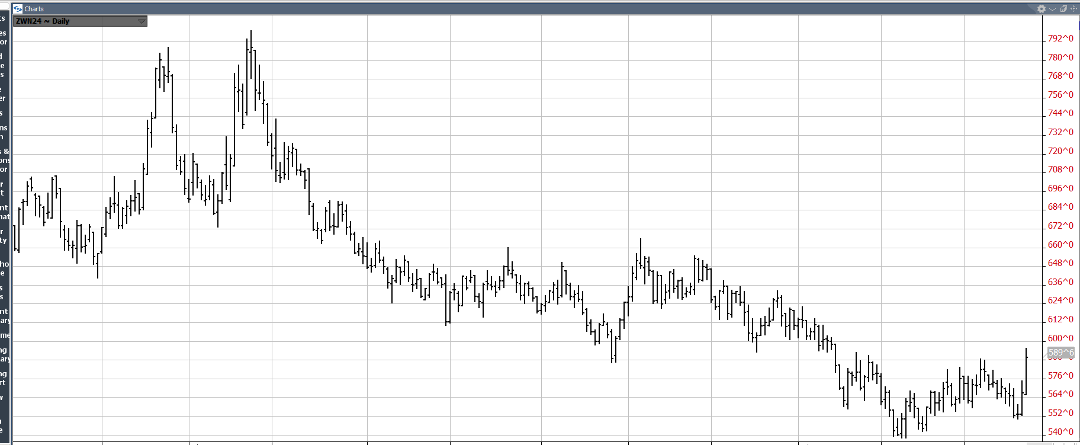
A plethora of bullish fundamentals have driven July Wht to two month highs – including historical cheapness, dryness in the US Southern Plains & Russia & military strikes into Ukraine perpetrated by Russia! Also, Russia has had recent difficulties with its export system! These factors coupled with a probable upside technical break-out could finally signal a long-awaited bottom in July Wht!
JULY CORN
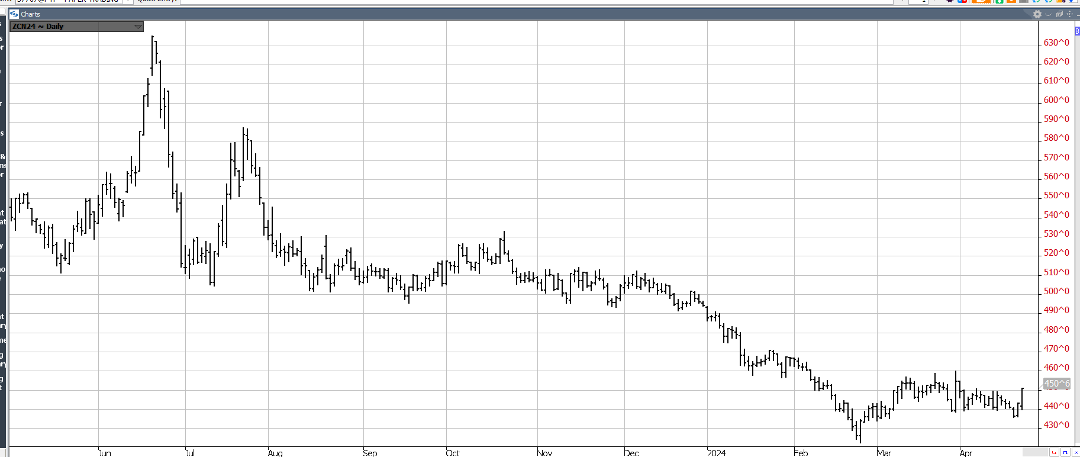
July Corn was “down & dirty” at the end of last wk breaking out of its consolidation pattern on the downside, but it quickly reversed with solid gains Friday & today as the contract quickly marched up to the top end of its March trading range! Marketing year high export inspections of 1.623mmt also helped – as well as July Wht’s 20 cent upside explosion to 7 wk highs! The corn contract has dropped $2.00 since last summer -in the process factoring in a lot of bearishness – including adequate stocks & slack exports! Since the 1st, exports have run about 35% over 2023! At current levels, July Corn can allow no margin for error – should there be any glitches in the US Crop!
JULY BEANS
July Beans rode the short-covering wave that engulfed grains today as harvest is nearly complete in Brazil & dryness persists in Argentina! Flash sales have begun appearing regularly with 3 last week & the fund short position is quite large – as well, the mkt is $2.50 off last Summer’s highs! Spiller-over from wheat was prominent as global dryness in wht areas & geopolitical issues sent wht more than 20 cent higher! Bean stocks are not abundant & there is no weather premium in the mkt as planting is just beginning!
JUNE CAT
Cattle-on-Feed reports have been widely unpredictable of late & the April version issued last Friday at 2pm was no exception! Placements came in at 88% (est-93) after last months 110% which started cattle’s $16 slide! The expected reaction was a gap-higher, sharply higher close as the mkt rallied to the midpoint of the recent break! Two factors helped encourage the rally – one was the realization that the Bird Flu impact was mitigated & two is the grilling season we’re currently in – cattle’s best demand period of the year!
JUNE HOGS
June Hogs basically jumped on board the short-covering rally in grains & cattle posting modest gains but closing within $3.00 of the recent of its recent highs! They are also the beneficiary of an excellent demand as folks roll out their grills! Also, recent slaughter & avg weights have been down & exports up as China’s recent herd liquidation has leveled out!
Read Full Story »»»
DiscoverGold
Grains Report: Wheat, Rice, Corn and Oats, Soybeans, Canola and Palm Oil
By: Jack Scoville | April 23, 2024
• WHEAT
General Comments: Wheat was lower last week and trends remain mixed in all three markets. The weekly export sales report showed poor sales once again. The problems with Russian Wheat exporters continue but are apparently getting resolved in the governments favor. The reports indicate that the government is seeking more control of the exports and has made life very difficult on the private exporters in an effort to extract more sales and powers to the government. Russia is the world’s largest exporter and sets the world price and prices remain low. Big world supplies and low world prices are still around. Export sales remain weak on competition from Russia, Ukraine, and the EU as those countries look to export a lot of Wheat in the coming period. Black Sea offers are still plentiful, but Russia has been bombing Ukraine again and shipments might be hurt from that origin.
Overnight News: The southern Great Plains should get mostly dry conditions. Temperatures should be above normal. Northern areas should see mostly dry conditions. Temperatures will average above normal. The Canadian Prairies should see mostly dry conditions. Temperatures should average above normal.
Chart Analysis: Trends in Chicago are mixed. Support is at 527, 517, and 510 May, with resistance at 557, 568, and 575 May. Trends in Kansas City are mixed. Support is at 571, 561, and 556 May, with resistance at 597, 602, and 605 May. Trends in Minneapolis are mixed. Support is at 626, 610, and 604 May, and resistance is at 651, 658, and 660 May.
• RICE
General Comments: Rice closed higher again last week and has rallied back to the contract highs. Trends are up in this market on the daily charts. The market noted good planting and emergence progress in the weekly USDA reports.
Overnight News:
Chart Analysis: Trends are up with no objectives. Support is at 1818, 1792, and 1778 May and resistance is at 1907, 1916, and 1935 May.
• CORN AND OATS
General Comments: Corn closed lower and Oats closed higher last week as traders think that good Spring weather here will greatly increase planted Corn area. Increased demand was noted in all domestic categories, but export demand was left unchanged. South American production estimates were little changed. It is very expensive to plant Corn and Corn is considered unprofitable to plant right now, so planted are might not increase that much if at all. USDA issued its crop progress report for Corn and Corn planting is proceeding slowly. Demand for Corn has been strong at lower prices. Big supplies and reports of better demand are still around, but futures have been very oversold. Funds remain very large shorts in the market.
Overnight News:
Chart Analysis: Trends in Corn are mixed. Support is at 426, 422, and 408 May, and resistance is at 437, 448, and 459 May. Trends in Oats are mixed. Support is at 339, 334, and 328 May, and resistance is at 369, 362, and 369 May.
• SOYBEANS
General Comments: Soybeans and the products closed lower last week. Reports of great export demand in Brazil provide some support. Reports indicate that China has been a very active buyer of Brazil Soybeans this season. Ideas that South American production is taking demand from the US have pressured futures lower. Domestic demand has been strong in the US. Funds remain large shorts in the market. The US reports strong domestic demand.
Overnight News:
Chart Analysis: Trends in Soybeans are mixed. Support is at 1128, 1114, and 1100 May, and resistance is at 1156, 1181, and 1193 May. Trends in Soybean Meal are mixed. Support is at 330.00, 325.00, and 323.00 May, and resistance is at 348.00, 352.00, and 357.00 May. Trends in Soybean Oil are down with objectives of 4430 May. Support is at 4360, 4300, and 4240 May, with resistance at 4620, 4730, and 4830 May.
• CANOLA AND PALM OIL
General Comments: Palm Oil was lower on price action in Chicago. The export pace is expected to continue to really improve but this is part of the price already, in part due to stronger world petroleum prices that have affected world vegetable oils prices as well. Domestic biofuels demand is likely to improve. Ideas of weaker production ideas against good demand still support the market overall. Trends are turning up on the daily charts. Canola was lower in response to the price action in Chicago.
Overnight News:
Chart Analysis: Trends in Canola are mixed to down with objectives of 596.00 May. Support is at 602.00, 594.00, and 588.00 May, with resistance at 621.00, 637.00, and 645.00 May. Trends in Palm Oil are mixed. Support is at 4970, 3920, and 3860 July, with resistance at 4020, 4080, and 4140 July.
Midwest Weather Forecast Scattered showers. Temperatures should average near to above normal.
Read Full Story »»»
DiscoverGold
Softs Report: Cotton, OJ, Coffee, Sugar, Cocoa
By: Jack Scoville | April 23, 2024
• COTTON
General Comments: Cotton was higher yesterday in recovery trading. Demand remains a problem. The export sales report showed poor sales once again. USDA made no changes to the domestic supply or demand sides of the balance sheets, but did cut world ending stocks slightly. Trends are still down on the daily and weekly charts. Demand has been weaker so far this year. The US economic data has been positive, but the Chinese economic data has not been real positive and demand concerns are still around. However, Chinese consumer demand has held together well, leading some to think that demand for Cotton in world markets will increase over time.
Overnight News: The Delta will get mostly dry conditions and near normal temperatures. The Southeast will see showers and rains and below normal temperatures. Texas will have mostly dry conditions and near normal temperatures.
Chart Trends: Trends in Cotton are mixed. Support is at 77.40, 76.80, and 76.20 May, with resistance of 82.00, 85.30 and 86.20 May.
This Week Last Qeek Last Year Average
Cotton Planted 11 8 11 11
• FCOJ
General Comments: FCOJ closed sharply higher to limit up yesterday and futures are back in the middle of the trading range. Reports of tight supplies are around. Florida said that Oranges production will be low, but above a year ago. Futures still appear to have topped out even with no real downtrend showing yet, so a range trade has been seen. Prices had been moving lower on the increased production potential for Florida and the US and in Brazil but is now holding as current supplies remain very tight amid only incremental relief for supplies is forecast for the coming new crop season. There are no weather concerns to speak of for Florida or for Brazil right now. The weather has improved in Brazil with some moderation in temperatures and increased rainfall amid reports of short supplies in Florida and Brazil are around but will start to disappear as the weather improves and the new crop gets harvested.
Overnight News: Florida should get scattered showers or dry conditions. Temperatures will average near normal. Brazil should get scattered showers and above normal temperatures.
Chart Trends: Trends in FCOJ are mixed. Support is at 354.00, 350.00, and 347.00 May, with resistance at 380.00, 389.00, and 391.00 May.
• COFFEE
General Comments: New York closed lower and London closed higher yesterday and both are now developing a trading range. The lack of Robusta Coffee in the market is still the main feature. Robusta offers from Vietnam remain difficult to find and the lack of offer of Robusta is a bullish force behind the London market action. There were some indications that Vietnam producers were now offering a little Coffee, but not much and not nearly enough to satisfy demand. Vietnamese producers are reported to have about a quarter of the crop left to sell or less and reports indicate that Brazil producers are reluctant sellers for now after selling a lot earlier in the year. The next Robusta harvest in Brazil is starting now and offers increased yesterday on weakness in the Real.
Overnight News: The ICO daily average price is now 228.48 ct/lb. Brazil will get mostly scattered showers with near normal temperatures. Central America will get mostly dry conditions. Vietnam will see scattered showers. ICE NY said that 384 notices were posted for delivery today and that total deliveries for the month are now 742 contracts.
Chart Trends: Trends in New York are mixed. Support is at 239.00, 215.00, and 210.00 July, and resistance is at 249.00, 253.00 and 259.00 July. Trends in London are mixed. Support is at 4070, 3980, and 3850 July, with resistance at 4290, 4350, and 4400 July.
• SUGAR
General Comments: New York and London closed higher yesterday in recovery trading and trends remain down on the charts as the market seems to have supplies available for sale. There are still ideas that the Brazil harvest can be strong for the next few weeks if not longer. Indian production estimates are creeping higher but are still reduced from recent years. There are worries about the Thai and Indian production, but data shows better than expected production from both countries. Offers from Brazil are still active but other origins. are still not offering in large amounts except for Ukraine. Ukraine offers have suffered lately with the war.
Overnight News: Brazil will get rains in the south and scattered showers in the north. Temperatures should average above normal. India will get mostly dry conditions and below normal temperatures.
Chart Trends: Trends in New York are mixed. Support is at 1960, 1920, and 1890 July and resistance is at 2050, 2100, and 2150 July. Trends in London are mixed. Support is at 566.00, 580.00, and 554.00 August, with resistance at 580.00, 590.00, and 600.00 August.
• COCOA
General Comments: New York and London were lower and trends are mixed. Production concerns in West Africa as well as demand from nontraditional sources along with traditional buyers keep supporting futures. Production in West Africa could be reduced this year due to the extreme weather which included Harmattan conditions. The availability of Cocoa from West Africa remains very restricted and projections for another production deficit against demand for the coming year are increasing. Ideas of tig8ht supplies remain based on more reports of reduced arrivals in Ivory Coast and Ghana continue. Mid crop harvest is now underway and here are hopes for additional supplies for the market from the second harvest. Demand continues to be strong, especially from traditional buyers of Cocoa.
Overnight News: Isolated showers are forecast for West Africa. Temperatures will be near normal. Malaysia and Indonesia should see scattered showers. Temperatures should average near normal. Brazil will get isolated showers and above normal temperatures.
Chart Trends: Trends in New York are mixed. Support is at 10600, 9990, and 9880 May, with resistance at 12200, 12380, and 12500 May. Trends in London are mixed. Support is at 9500, 9060, and 8500 May, with resistance at 10280, 10400, and 10520 May.
Read Full Story »»»
DiscoverGold
Commodities Daily Market Movers (% Price Change)
By: Marty Armstrong | April 23, 2024
• Top Movers
Cheese 4.76 %
Wheat #2 3.68 %
Wheat CBT Futures 3.67 %
US - Dow / Gold Ratio 3.56 %
Gold / Silver Ratio 2.92 %
• Bottom Movers
NY Silver COMEX Futures 5.54 %
Cocoa (NYCSCE) Futures 3.46 %
Palm Kernel Oil 3.46 %
LME Tin (99.85%) 3.42 %
NY Gold Futures 2.79 %
*Close from the last completed Daily
DiscoverGold
Who’s The Leader. The Energy Report
By: Phil Flynn | April 23, 2024
Who’s the leader of the club that was made for me. JOE-BID-eeeen. Joe Biden, Joe Biden forever hold your banner high. High, High. For those of you young folks that missed being a part of the Micky Mouse Club, at least you have a chance to become a member of Joe Biden’s “American Climate Corp”. Joe Biden, in an effort to win back the hearts and minds of young, disgruntled Biden voters or perhaps in an attempt to get them to stop protesting at US college campuses across the land, is offering 20,000 jobs to young environmentally minded young folks so the can save the planet from what he sees as the biggest threat to mankind and to “ensure that poverty, race and ethnic status do not lead to worse exposure to environmental harm”. To try to inspire young people and their hearts and minds and votes that he has lost, Biden is trying to summon his inner Franklin D. Roosevelt by trying to copy a 1936 summer camp for underprivileged youth that Roosevelt called the Civilian Conservation Corp (CCC) to help create jobs during the Great Depression. Now Biden hopes that he can win back some votes by getting them to join this fine club.
While this youthful group cannot wear Mickey Mouse ears, perhaps they could wear caribou antlers because at the same time Biden has decided to block 40% of all oil and gas development in the Alaska National Petroleum reserve in an attempt to protect the so-called native habitat of the caribou and polar bears. Now normally the population of the caribou thrive near warmer oil pipelines but that’s a story for another day.
The Biden team also wants to block a road in Alaska that can bring out the precious metals that we would seemingly be needing if we’re going to electrify our economy. But perhaps he’s a little bit worried about putting some of those slave labor kids out of work in the cobalt mines. Maybe he could send those kids some of some of those cute caribou antler hats to make up for it.
Biden’s energy policies are raising real concerns about the future of energy security in the United States. People in the oil and gas industry and the mining industry are just scratching their heads wondering why the president continues to encourage the production of oil and gas and rare earth minerals in other countries while continuing to try to stymie the US. It’s very disturbing to many in these industries that the Biden administration continues to make short term political decisions regarding energy without any concept of the longer term damage that it’s doing to the US energy space. There are warnings from the American Petroleum Institute and others that are saying that Biden’s policies are creating the next major energy crisis but if you can’t beat them, I guess just join the club.
In the meantime, the market doesn’t seem to be too phased by the sanctions that are being placed in Iran. There’s a growing sense that new sanctions are not needed but also what we must do is enforce the sanctions that are already on the books. Javiar Blass at Bloomberg agrees writing that, “if you believe the Chinese government, the country doesn’t import any oil from Iran. Zero. Not a barrel. Instead, it imports lots of Malaysian crude. So much that, according to official Chinese customs data, it somehow buys more than twice as much Malaysian oil as Malaysia actually produces. Impossible? Well, of course. The reality is that China simply rebrands every barrel of Iranian crude it imports as Malaysian — the easiest and cheapest way to defy US sanctions, according to oil traders. It isn’t a small matter: “Malaysia” was China’s fourth-biggest foreign oil suppler last year, behind Saudi Arabia, Russia and Iraq. He says that, “The truth is, the US doesn’t need new sanctions on Iranian oil — it needs to enforce the ones it already has. For the last several years, either the White House has turned a blind eye to surging Chinese purchases of Iranian oil, with Biden seeming to be more concerned about rising oil prices than increased Iranian oil output, or the web of Chinese and Iranian obfuscation has outwitted US officials. I’m not sure which would be worse, but the result is the same: Iranian oil production last month surged to a six-year high of 3.3 million barrels a day, up 75% from the low point of 1.9 million barrels during the “maximum pressure” sanctions applied by former US President Donald Trump in late 2020.
I would take it a step further. I would argue that the lifting or the failure to enforce sanctions on Iran has made the world a more dangerous place. There’s absolutely no doubt that a lot of the turmoil that we’re seeing in the world today is because Iran has been able to fund terror groups like Hamas, Hezbollah and the Houthi rebels. Don’t believe the talking point that the reason why Iran is lashing out is because of Donald Trump and that he stepped away from the Iran nuclear accord. The reality is that Iran was never in the business of not wanting to get a nuclear weapon and that Iran nuclear accord would have stopped them.
WTI prices hit over $83.00 a barrel today before pulling back in a normal 3:00 AM central time sell off. The market did get a bit of a pullback on signs that manufacturing growth overseas is slowing while inflation continues to be strong. We get the S&P flash US services purchasing managers index today and we also get the flash US manufacturing purchasing managers index. The market is going to look at the rate of growth but also the inflation component and that could be a market mover for oil today. We also will get the American Petroleum Institute supply report, and the expectations are that we will see a pretty good draw across the board.
We’re seeing diesel prices gain on Rbob gasoline prices suggesting that refiners are starting to get caught up with gasoline inventories. If that gets confirmed from today’s report and tomorrow’s Energy Information Administration supply report, it could mean that we could be getting close to a peak on gasoline prices.
Natural gas prices are trying to hold steady. The big picture is there are still concerns about the Biden administration’s pause on liquefied natural gas exports approvals. Insiders continue to believe that this is just a political sideshow to try to win favor from Biden voters. Still, if the United States lives up to its potential as the largest natural gas exporter, then world will be a cleaner place. The best chance for developing nations to reduce their greenhouse gas emissions is to replace coal plants and oil plants with liquefied natural gas. It’s realistic and doable and affordable and ultimately good for the planet.
Read Full Story »»»
DiscoverGold
Lumber's long losing streak has mercifully come to an end, back in the green
By: Barchart | April 22, 2024
• Lumber's long losing streak has mercifully come to an end, back in the green.

Read Full Story »»»
DiscoverGold
Natural Gas Bullish Weekly Setup on Deck
By: Bruce Powers | April 22, 2024
• Natural gas continues to trade within last Tuesday's range, hinting at a potential breakout of last week’s hammer candlestick pattern on a rally above 1.81.
Natural gas rises on Monday but continues to trade within the price range from last Tuesday with momentum and volatility muted. Tuesday’s high was 1.80 and it was briefly exceeded to the upside on Friday, with a high of 1.81. It looks like natural gas is eventually heading towards the top line of the symmetrical triangle consolidation pattern to test resistance.
If it were hit today the line would represent approximately 1.92. However, given the lack of enthusiasm in the advance so far, further consolidation may come first. The long-term downtrend line is an area to watch for support during short-term pullbacks.
Weekly Bullish Hammer Candle Setup
A key price level for natural gas is last week’s high of 1.81. If exceeded, the upper range of the triangle becomes the next target zone. Also, last week ended with a bullish hammer candlestick pattern. Therefore, a bullish breakout above 1.81 will trigger that candlestick pattern. Interestingly, the prior week ended with a bearish shooting star candlestick pattern, and it was triggered to the downside last Monday.
This provides a potential setup on the long side that could lead to a pickup in momentum. What we have is the potential for a bullish reversal in the weekly time frame, following a bearish reversal that was triggered the previous week. This type of “whipsaw” is what can sometimes begin sharp moves.
Next Opportunity for Breakout is with the Current Advance
Once a breakout of the triangle triggers, the price of natural gas should see a clear increase in momentum. The triangle pattern is well defined with five touches of the boundary lines so far. Given the clear establishment of the pattern a breakout, either up or down, can follow.
However, given that natural gas has been rising following the most recent swing low of 1.65, the next potential breakout would likely be to the upside. Either the current advance breaks through the top line and then rises above the most recent swing high of 1.94, or resistance is seen near the top line that leads to a turn lower. If the turn lower is brief, another attempt at an upside breakout could follow.
Read Full Story »»»
DiscoverGold
Sanction Hokum. The Energy Report
By: Phil Flynn | April 22, 2024
Oil prices are pulling back as well as silver and gold on the reduction of risk of war and more sanction hokum. Both Israel and Iran seemed to suggest that the tit for tat responses to their escalating tensions had ended but at the same time because of Iran’s attack on Israel, the US has put on mores sanctions. Iran may be shaking in its boots because of the way the Biden administration enforces sanctions instead of their oil exports hitting a 6-year high, they can now go for a 7-year high.
Reuters reported that, “The package, which includes billions of dollars of aid for Ukraine, Israel and the Indo-Pacific, contains several measures on Iran sanctions. Two “could explicitly impact Iranian petroleum exports if implemented and enforced”, according to ClearView Energy Partners, a non-partisan research group. The first, the Stop Harboring Iranian Petroleum Act, or SHIP, would impose sanctions on ports, vessels and refineries that “knowingly engage” in shipping, transfers, transactions and processing of Iranian crude oil and products, ClearView said. Ships that violate the ban would be barred from U.S. ports for two years. However, the bill includes 180-day waivers that Biden could invoke that would avert oil price spikes. Election day USA is 197 days away. That is just a coincidence, I am sure. It was expected to pass the Senate and will be signed by Biden. Yet the Whitehouse is going to have a say on how, when and if the sanctions are going to be enforced. With a looming election and consumers already complaining about inflation and gas prices, it’s unlike the Biden team will enforce sanctions and Iran once again gets away with murder.
Sanctions, of course, may be the best example this week of wishful thinking since the International Monetary Fund last week thought that OPEC and Russia might start lifting gradually their production cuts in July. IMF assumes a full reversal of oil output cuts at the start of 2025 which I guess could be possible and more than likely we will need oil. Yet last week three anonymous OPEC+ sources who spoke to Reuters indicated that OPEC+ was considering an extension of its voluntary production cuts into the second quarter to lend further support to the market. What’s more, the sources suggested that the group could keep the voluntary cuts in place through the end of this year.
These new sanctions and the OPEC production cut extension comes as AAA comes out this morning about gas prices. They pointed out that the average price of gas increased by 27 cents in the first two weeks of April 2024, and AAA anticipates the cost will continue to rise. Yet they did point out that, “Lackluster domestic demand for gasoline paired with decreasing oil prices led to the national average for a gallon of gas climbing just four cents to $3.67 since last week.” Currently their latest data shows that gasoline prices are $3.675 a gallon for regular unlimited. That is slightly higher than yesterday, about four cents a gallon higher than a week ago about $0.14 higher than a month ago. Yet amazingly we’re just slightly higher than we were a year ago.
The wildfire in Canada may impact oil production as well as natural gas. Bloomberg reported that A 74-acre (30—hectare) wildfire in the Canadian oil sands prompted an evacuation alert for a community near Fort McMurray, the biggest city in the region. Residents of Saprae Creek, located about 25 kilometers (16 miles) by car southeast of the oil sands capital, were told to prepare for possible evacuation if wildfire spreads toward the community, the Regional Municipality of Wood Buffalo said in an alert. The fire is one of two out-of-control blazes in Alberta, home to the Canadian oil sands, the world’s third-largest crude oil reserves. The warning was issued after massive forest fires burned down whole swathes of Fort McMurray, forcing tens of thousands of residents to evacuate for more than a month. Those fires also prompted the suspension of more than 1 million barrels a day of oil production.
EBW Analytics reports that the May natural gas contract initially tested as low as $1.649 last week before a brief fire scare in Alberta threatening supply reinforced support. Extended Henry Hub weakness averaging just $1.57/MMBtu April-to-date may be a bearish indicator for the June contract, however. Still, dry gas production scrapes continued to grind lower to offer support while weather also edged higher. If LNG demand can rebound from last week’s lows, initial strength is probable early this week before trader positioning into final settlement biases risks lower.
We definitely have seen the rebound in the stock market and the big sell-off in silver and gold as the risk of World War 3 breaking out over the weekend seems to be reduced pretty substantially. Still the supply and demand situation remains very tight and this false perception that supplies are really ample could be changed dramatically over the next couple of weeks. The 3rd test seems to be more interested in the Brent crude than the WTI. Most of the tightness on that side of the pond, at the same time here in the US, complacency on gasoline demand may be our undoing. Weekly demand numbers are very volatile. Our expectation is that if the weather turns a bit better across the country we could see a real uptick in demand.
Read Full Story »»»
DiscoverGold
Rice is running... Beans, Oats, Wheat and Corn bottomed???
BREAKING: Lumber The tear drop pattern is only getting worse for Lumber as it has now closed red for 14 consecutive days
By: Barchart | April 19, 2024
• BREAKING: Lumber
The tear drop pattern is only getting worse for Lumber as it has now closed red for 14 consecutive days.

Read Full Story »»»
DiscoverGold
Natural Gas Stuck Inside Consolidation Range
By: Bruce Powers | April 19, 2024
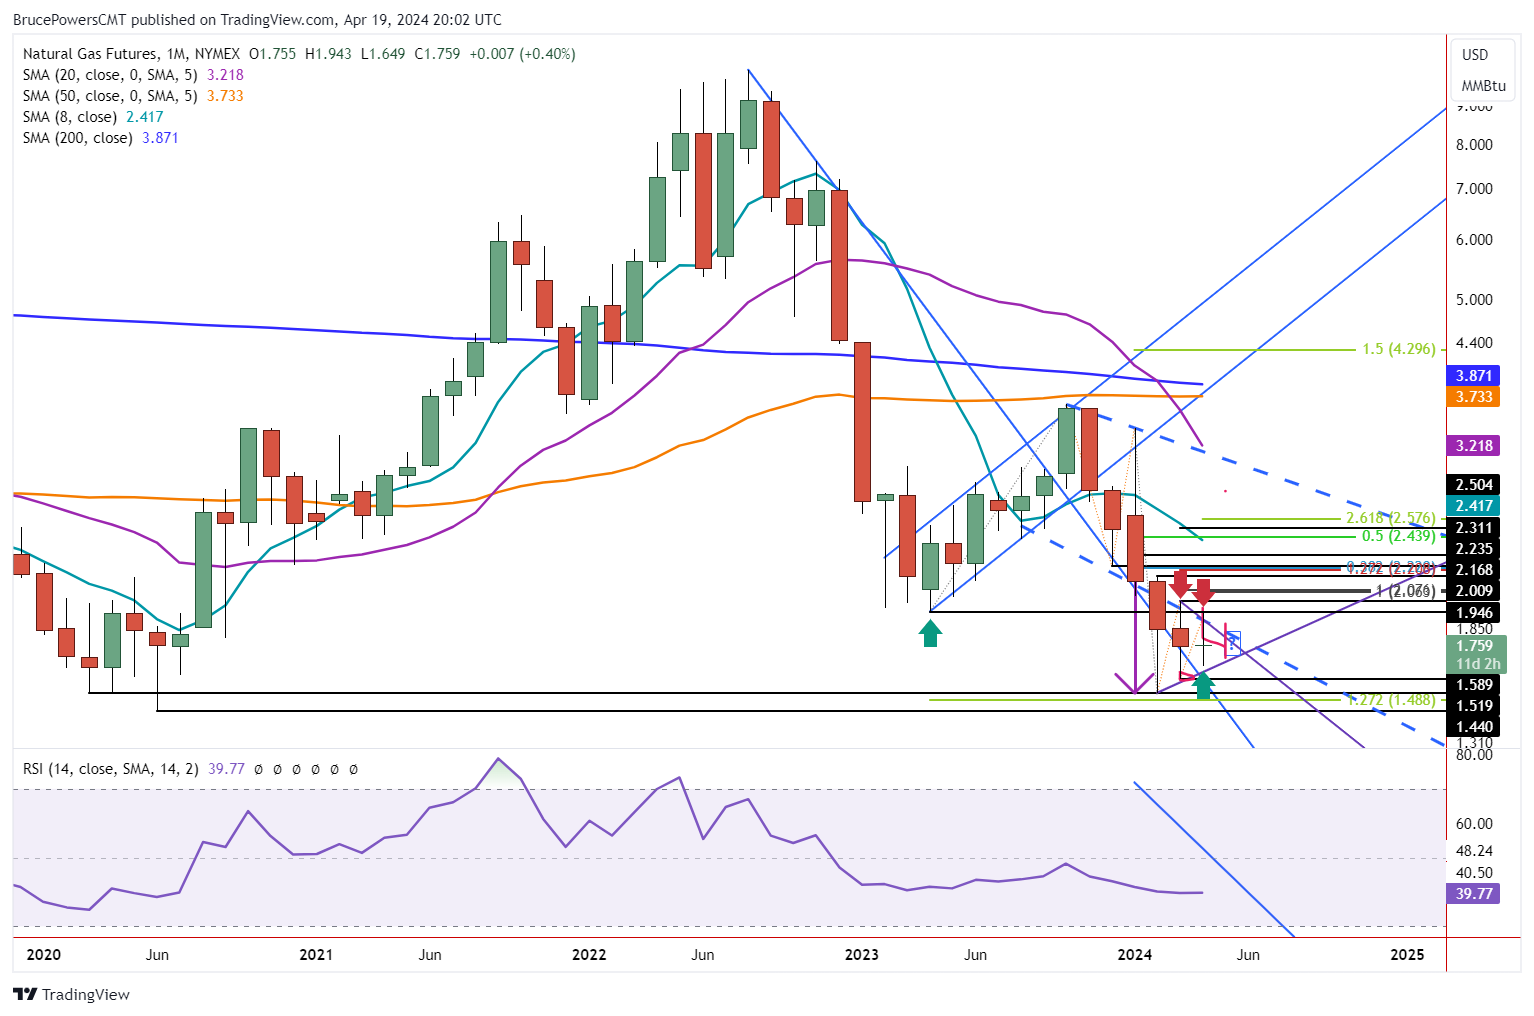
• Historical context suggests that 1.52 support is significant, suggesting that a drop below it could lead to further selling, and if it is retained there is the potential for an eventual upside breakout.
Natural gas shows signs of strength but cannot sustain it. A breakout above the three-day high of 1.80 triggered today before resistance was seen around 1.81. That led to a selloff that took natural gas down to the lower half of the day’s range.
Although the breakout to a four-day high is a sign of strength, the potential close in the lower half of the range is not. Moreover, Thursday also closed in the lower half of the range. Nevertheless, this is the type of uncertainty that can be expected when trading occurs inside a clear consolidation pattern.
Directionless Choppy Outlook Until Breakout
A bear pennant trend continuation consolidation pattern has been forming and the swing low at 1.65 that was reached on Tuesday further confirmed the pattern. That swing low has been followed by a low momentum advance. The logical target is an eventual test of resistance at the top boundary line of the pattern. If resistance is then seen, a possible drop to test the lower line may occur. In other words, until there is a clear breakout of the pennant momentum and volatility will be diminished.
Upside Breakout Would Be Bullish
Although this pennant is considered bearish since it is within a downtrend, a bullish reversal can also occur. On the downside, a decline below this week’s low of 1.65 indicates that a breakdown has started. The first target would then be the trend low at 1.52. However, if the breakdown follows through as it normally might, a decline to new trend lows is likely. Given that, it is important to consider historical context.
Sitting On Strong Support
In June 2020 natural gas reversed from a swing low of 1.44. That low was the lowest traded price in natural gas of the past 28 years. The prior low was 1.52, which is where it found support most recently. Further, the decline below support of 1.52 to the new low of 1.44 occurred in only one day.
A daily close above the 1.52 level occurred the next day and it was followed by a sustained rally. What this seems to indicate is that another drop below 1.52 could be a big deal and lead to further selling and risks seeing natural gas fall below 1.44. Also, there is a good chance that 1.52 is not broken to the downside given its significant, and an upside breakout of the pennant eventually occurs.
Read Full Story »»»
DiscoverGold
Fear Strike Out. The Energy Report
By: Phil Flynn | April 19, 2024
A wild evening of risk on and risk off as the market fear cages had a significant test and geopolitical events are on the cusp of our worst nightmares. Now the market must decide whether the tensions are closer to the beginning or closer to the end.
Oil popped and dropped after it was reported that Israel responded to Iran’s attack on their country with a missile strike or drone strike or a combination of both. The early indications seem to suggest a limited response by Israel, perhaps in an attempt to not escalate the conflict but is already being criticized by some in Israel as a ‘weak” response” and calls for more significant action. Iran overnight also seems to be downplaying the attack.
The Wall Street Journal reported that, “The strike targeted the area around Isfahan in central Iran, one of the people said. Iranian media and social media reported explosions near the city, where Iran has nuclear facilities and a drone factory, and the activation of air-defense systems in provinces across the country after suspicious flying objects were detected. Much remained unclear about the extent or the impact of the Israeli action. State-run news agency IRNA said Friday morning that its reporters hadn’t seen any large-scale damage or explosions anywhere in the country and that no incidents were reported at Iran’s nuclear facilities. Flight restrictions imposed overnight by Iran were lifted in the morning.” This came after Iran was already seeking to lower tensions.
Bloomberg News reported that Iran is prepared to de-escalate tensions with Israel provided that it agrees to stop further military moves against Tehran’s interests, Foreign Minister Hossein Amirabdollahian said at the United Nations. “Iran’s legitimate defense and countermeasures have been concluded,” Amirabdollahian told the UN Security Council Thursday. Israel “must be compelled to stop any further military adventurism against our interests.” If not, he said, Iran will “give a decisive and proper response” that will make Israel “regret its actions.” So after some pretty dramatic moves and the risk on markets such as bonds, oil and gold, we seem to be pricing in that the worst may be over the rumors that Israel was going to hit Iran hard after the Passover holiday and talk of two other attacks on Iran being canceled seems to suggest that at least for the near term, the worst may be over.
Yet will it be enough to believe that this is over going into the weekend? It’s very possible that they will retaliate again. So, the fears of some of the worst-case scenarios of a major oil disruption seems to be on the back burner at least for now. I guess Iran can go back to celebrating the fact that they just saw their oil exports hit a new six year high yesterday according to the Financial Times giving the country an extra $35 billion dollars that they can spend on more global terror groups like Hamas, Hezbollah and the Houthi rebels.
The Iranian state media reported that the air strike by Israel’s Air Force was targeting their 8th tactical air base of the Iranian Air Force. The attack was near some of their nuclear facilities. According to the reports coming out of Iran, none of them were damaged and its business as usual. So, I guess that means that their secret nuclear weapons program is still on going. Oops I forgot, it’s supposed to be a secret.
No secret that the Biden administration did turn a blind eye to Iranian sanctions in the hope to reinvent the Iranian nuclear deal but at the same time now they need that oil if they’re going to win the election. The Biden administration now is in another desperate attempt to please the environmental base and is now restricting drilling and mining in Alaska. The Biden administration says they took steps to limit both oil and gas drilling on public lands and conserve 30% of US lands and water to combat climate change. The Interior Department finalized a regulation to block oil and gas development and 40% of Alaska’s National Petroleum preserve they say in an attempt to protect habitats for polar bears and Caribou and other wildlife in the way of life for indigenous communities. Biden also said that he was proud that his administration was taking action to conserve more than 13 million acres in the western Arctic.
Many experts believe that Biden’s action is going to jeopardize our future not only for oil and gas production but also for the production for the type of minerals that we would need if Biden is ever going to have a chance to achieve his dream of electrifying the US transportation fleet. By restricting mining but increasing the demand for metals, Biden is going to make the US more dependent on other countries for our economy to survive. This is not a good long-term strategy for U.S. economic growth nor is it a good strategy for the average American family.
For commodity traders, we’re seeing some great volatility and great opportunities to try to pick up some big moves. This means the volatility in commodities isn’t just in your normal risk assets where we’re seeing explosive moves in cocoa, coffee as well as industrial and precious metals. Be prepared to play both sides of the market but hedges should use sharp breaks to lock in hedges. Because after the dust settles and the geopolitical risk goes away, the underlying fundamentals for food and industrial and precious metals is that supplies are just too darn tight.
Natural gas, after what a bearish report, is attempting to rise from the ashes. There is a possibility and the market is hopeful that production cuts and reductions of drillings of wells would stop the bloodletting.
Yesterday Market Watch reported that the Energy Information Administration on Thursday reported a weekly increase of 50 billion cubic feet in domestic supplies for the week that ended April 12. On average, analysts had forecast a climb of 44 billion cubic feet, according to S&P Global Commodity Insights. Still with some base of seeing natural gas prices at historic lows there will still be more pain for the producers.
Read Full Story »»»
DiscoverGold
Natural Gas Rebound Faces Resistance at Moving Average Zone
By: Bruce Powers | April 18, 2024
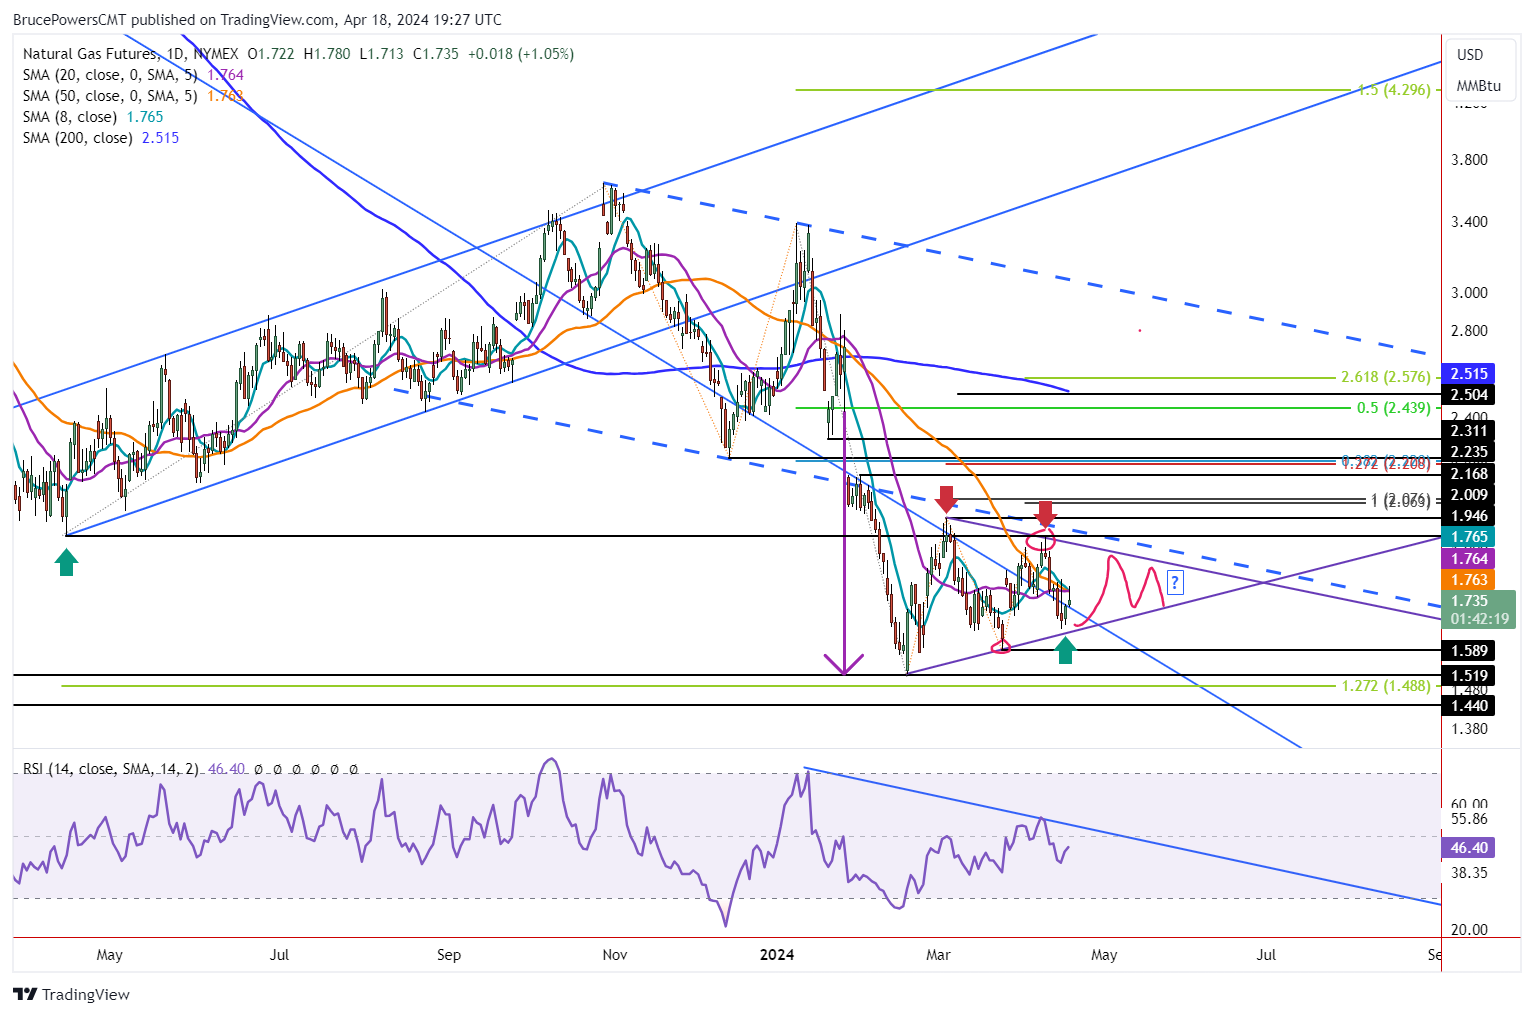
• Trading in natural gas expected to be choppy, as volatility declines in the narrowing pennant.
Natural gas bounces to test a moving average resistance zone with the day’s high of 1.78. Today’s advance (Thursday) broke out above the high of Wednesday, which was an inside day. Natural gas is on track to end the day above yesterday’s high of 1.72. However, it remains inside the wide trading range from Monday, and it is also within a developing bearish pennant consolidation pattern.
Signs of strength seen today may take the price of natural gas up to the top boundary line to test resistance. However, it is not clear whether Tuesday’s swing low will be the low of the swing until there is an advance above Monday’s high of 1.80.
Choppy Moves While in Consolidation
Until natural gas breaks out of the pennant consolidation pattern trading will likely be choppy and difficult to predict, as with any consolidation period. Volatility can be expected to decline as the pennant narrows the trading range as the apex of the triangle is approached.
Further, the three moving averages representing different time frames of 8-Day, 20-Day, and 50-Day have converged. This is another indication of low volatility. How natural gas behaves when testing the upper or lower boundary lines will provide clues as you whether a breakout to the upside or downside may occur.
Consolidation Could Continue for Weeks
The pattern is bearish since natural gas remains in a downtrend and there was a sharp decline prior to the formation of the pennant. Nevertheless, it is not determined until a breakout occurs. A breakout either up or down should occur before the apex is reached. This means that trading within the pennant could go on for as long as more seven weeks. Regardless, a breakout could occur at any time as the pennant is already well defined.
8-Week Moving Average Recaptured
It is interesting to note that there was a breakdown from last week’s bearish shooting star candlestick pattern (not shown) before this week’s low of 1.65 was reached, leading to a bounce. Also, the 8-Week MA, which had marked support for the last two weeks was broken to the downside. Today’s advance has recaptured the 8-Week MA, a sign of strength. Confirmation of strength will be provided on a daily close above the current price for the 8-Week MA at 1.75. Natural gas exceeded that level today.
Read Full Story »»»
DiscoverGold
The Corn & Ethanol Report
By: Daniel Flynn | April 18, 2024
We kickoff the day with Export Sales, Initial Jobless Claims, Philadelphia Fed Manufacturing Index, Continuing Jobless Claims, Jobless Claims 4-Week Average, Philly Fed Business Conditions, Philly CAPEX Index, Philly Fed Employment, Philly Fed New Orders, and Philly Fed Prices Paid at 7:30 A.M., Fed Bowman Speech at 8:05 A.M., Fed Williams Speech at 8:15 A.M., Existing Home Sales, Existing Home Sales MoM, and CB Leading Index at 9:00 A.M., EIA Natural Gas Storage at 9:30 A.M., Fed Bostic Speech at 10:00 AM.,4-Week & 8-Week Bill Auction at 10:30 A.M., 5-Year TIPS Auction at 12:00 P.M., and Fed Bostic Speech at 4:45 P.M.
Grain futures are mixed in a reversal of yesterday with corn & soybean futures lower while wheat futures get a dead cat bounce. Low volume totals reflect lack of trading interest as the bulls & Bears debate the upcoming Northern hemisphere growing season.. Expect another choppy trade in today’s action with a modest bounce on Friday as we head into the weekend with many geo-political risks-on-at play. The Phillips 66Rodeo California Refinery (Rodeo Renewed) announced it is operating and producing 27,000 barrels of renewable diesel daily as of April 15th . Rodeo Renewable plans to reach it’s plant’s production capacity of 50,000 barrels per day later this quarter. At the current rate of renewable diesel production, the Rodeo Phillips 66 plant is consuming 8.6 Mil pounds of feedstocks daily with a push to reach 16.1 Mil pounds of feedstock consumption by late June. At capacity, this would add 15% of US biofuel production. Rodeo is the largest US biofuel producer and will significantly boost US renewable diesel production. Phillips 66 has not announced what feedstocks the plant will utilizing, but soybean oil should hold a sizable percentage of the feedstocks based on current price relationships, The US Soybean Crush industry has been waiting for Rodeo to come online for years. And talk of squeezing out more fuel from the Strategic Petroleum Reserves (SPR’s) instead of replenishing always at a loss from where and when the government tap’s into the Reserves. This is dangerous to National Security as the administration as both domestic and foreign policy extremely dangerous and just another self-inflicted failure that needs to be held accountable.
The Rosario Grain Exchange raised corn crop size questions on Wednesday with their crop size questions suggesting that corn stunt losses could grow with N Argentine fields reporting harvested yield losses of 40-50%. Also, corn stunt disease has pushed unusually far south into Central Santa Fe and Cordoba. BAGE may further lower their ’24 Argentine corn production estimate later today, but additional harvest data is required to define the disease’s full impact. Play It Again Sam! For the Bears & Bulls it’s the US Marine line of Hurry Up & Wait!
Read Full Story »»»
DiscoverGold
Commodities Daily Market Movers (% Price Change)
By: Marty Armstrong | April 18, 2024
• Top Movers
LBMA Silver in USD 0.74 %
• Bottom Movers
Tokyo Platinum Futures 2 %
NSW Baseload Electricity Continuous 1 %
Tokyo Rubber Futures 0.89 %
AU - Victoria Base-Load Electricity Futures 0.58 %
Tokyo Corn Futures 0.27 %
*Close from the last completed Daily
DiscoverGold
You Can’t Hurry Cuts. The Energy Report
By: Phil Flynn | April 18, 2024
Jerome Powell hints: You can’t hurry cuts. No, you’ll just have to wait. Inflations not easing, But It’s a game of give and take. You can’t hurry cuts, no, you just got to wait, just trust in the Fed’s time, it’s a game of interest rates. How many heartaches must we stand before inflation’s so tame to let us live again. Rate cuts were the only thing that kept us hanging on. When I feel my paycheck, you know it’s almost gone. No, you can’t hurry cuts….
Well after trying to hold support for days, the market had the rug pulled out from underneath it as the market seemed to lose the Fed and the Strategic Petroleum Reserve (SPR) put in quick succession. Backing off rate cuts and the Biden administration switching to a potential seller from a buyer for the SPR took away the invisible floor that oil had. We also saw an easing of war premium in part because of an Axios report that said that Israel considered a retaliatory strike against Iran on Monday but decided to wait.
The market also was less than inspired by the weekly Energy Information Administration (EIA) status report that seemed to suggest the gasoline demand in the United States is struggling but at the same time so are the inventories of oil products. Yet the tightness of diesel supply and gasoline, especially in certain parts of the country, seem to be overshadowed as the market tries to reprice oil and gas in an environment where we might not get any rate cuts this year after all and perhaps a measured response to Iran’s unprecedented attack on Israel.
Federal Reserve Bank of Cleveland President Loretta Mester seemed to echo the sentiment from Fed Chair Jerome Powell by saying monetary policy is in a good place, adding that the central bank shouldn’t be in a hurry to cut interest rates. Yet by backing off the suggestion that rate cuts would be coming, it took away what some might say was the Fed oil put that would keep a floor under oil just a day after the Biden administration took away the Strategic Petroleum Reserve put by saying that instead of buying back for the reserve they might be selling.
Add to that its seems that the market believes that the Biden administration will not impose sanctions on Iranian oil because they fear a shortage. Even so called reimposition of oil sanctions on Venezuela will not impact their exports to the US ahead of the election. Bloomberg News reports they intend to reimpose oil sanctions on Venezuela, ending a six-month reprieve, if Nicolas Maduro’s regime does not take steps in the next two days to honor an agreement to allow a fairer vote in elections scheduled for July.
The US plans to allow a Treasury Department license permitting oil and gas production to expire without renewal on Thursday, according to people familiar with the plan, who asked not to be identified without permission to speak publicly if Venezuela fails to act. Sounds ominous but as oil analyst Anas Alhajji points out, the reimposition of sanctions will not cover Venezuela’s oil exports nor U.S. oil imports from Venezuela. So, while the Biden administration is trying to act tough protecting free and fair elections, they are more worried about the price of oil and diesel hurting their reelection chances.
In fact, John Kemp at Reuters pointed out that Brent crude oil calendar spreads have continued to soften as traders downgrade the probability the conflict between Iran and Israel will escalate to the point where it disrupts oil production and exports. The spread from June to December 2024 has fallen to its lowest for more than five weeks. Most of the softening has come in the nearest-to-deliver June-July and July-August spreads where most of the speculative money is concentrated and where the supply-demand balance would be impacted most immediately by any escalation that threatened oil production and exports from the Persian Gulf. Traders have concluded Iran will not risk any disruption of its exports; the United States will not risk higher oil prices in an election year; and the United States will restrain the next round of responses by Israel. Then again, if it does happen, well, stay tuned.
How about gasoline futures which in recent days has been surging also saw the bottom drop out after the Energy Information Agency {EIA) report. The market became concerned about the strength of the consumer after another week of subpar 8.862 million barrels a day demand. Even though it was stronger than the week before, the market is concerned that this summer driving season might not be getting off to a bang up start.
We did see a big rebound in U.S. oil exports that surged to a whooping 4.726 million barrels a day, that probably included some post Easter Holiday work. Then I would have to say that the report really wasn’t bearish. In fact, I would suggest you could even see green shoots in this report that would suggest more bullishness in the weeks to come. Yet when we lost the Fed put and with the market taking off some more premium, we started the see people’s online positions after they took out support.
According to the EIA, demand in the four-week moving average, which is really what you must keep an eye on, showed that based on total products supplied over the last four-week period averaged 19.8 million barrels a day, down by 0.2% from the same period last year. Over the past four weeks, motor gasoline products supplied averaged 8.8 million barrels a day, down by 1.9% from the same period last year. Distillate fuel product supplied averaged 3.5 million barrels a day over the past four weeks, down by 8.4% from the same period last year. Jet fuel product supplied was up 0.8% compared with the same four-week period last year.
EIA said supplies of U.S. commercial crude oil inventories (excluding those in the Strategic Petroleum Reserve) increased by 2.7 million barrels from the previous week. At 460.0 million barrels, putting U.S. crude oil inventories are about 1% below the five year average for this time of year. Total motor gasoline inventories decreased by 1.2 million barrels from last week and are about 4% below the five-year average for this time of year. Finished gasoline inventories increased, while blending components inventories decreased last week. Distillate fuel inventories decreased by 2.8 million barrels last week and are about 7% below the five-year average for this time of year.
After taking off support both oil and products are vulnerable from a price standpoint. There is still geopolitical risk in the marketplace even though it’s been downplayed in the short term. If the demand side of the equation bounces back just a little bit, we can see by the inventories that supplies will tighten significantly. And while right now we are vulnerable to see oil retest near $80.00 a barrel, we believe it would be prudent to put on some call positions on breaks.
Gas producers are praying that today’s natural gas inventory report will throw them a lifeline so they can survive another week. The U.S. likely saw a below-average build in natural gas inventories last week, lowering slightly the storage surplus as the injection season gets under way, according to a survey by The Wall Street Journal. Natural gas in underground storage is expected to have increased by 45 billion cubic feet to 2,328 Bcf as of April 12, according to the average estimate of nine traders, brokers and analysts. Estimates range from a storage increase of 39 Bcf to one of 51 Bcf.t Journal writes that “the EIA is scheduled to report last week’s storage levels on Thursday at 10:30 a.m. EDT. The projected rise is smaller than the five-year average injection for the week of 61 Bcf and would reduce the surplus from 633 Bcf the week before. The large surplus over the five-year average follows an unusually mild winter that limited inventory drawdowns. The U.S. Energy Information Administration estimates that natural gas in storage will end the injection season at a record 4,120 Bcf, or 10% above the five-year average.
Read Full Story »»»
DiscoverGold
Natural Gas Volatility Decline Setting Stage for Pennant Breakout
By: Bruce Powers | April 17, 2024
• Natural gas is consolidating within a bear pennant pattern, with volatility declining as it trades inside a narrowing price range.
Natural gas further consolidates on Wednesday within a bear pennant pattern. It is on track to end the day as a relatively narrow inside day. Yesterday’s low of 1.65 approached a test of support at the lower trendline of a developing bear pennant consolidation pattern. This week’s decline has clarified that pattern as an attempt to hold support above the 50-Day MA and long-term trendline failed earlier this week.
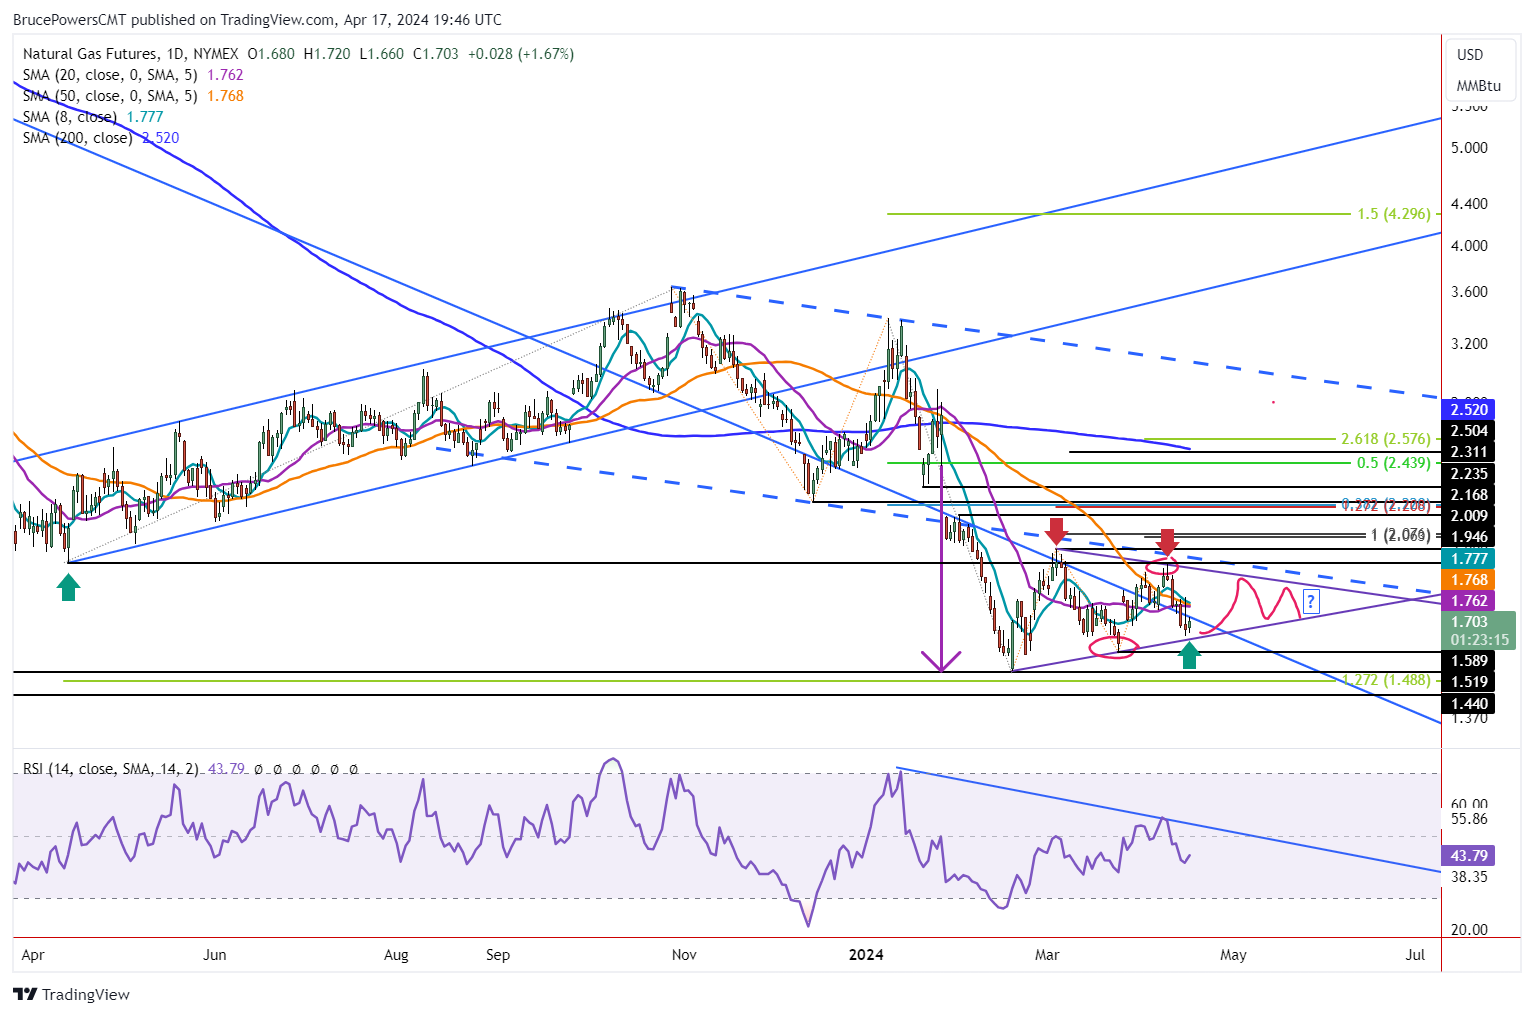
Declining Volatility Likely to Continue
Volatility has been declining and it will likely continue to fall as natural gas further trades inside the small triangle pattern with a narrowing price range. The decline in volatility is also indicated by the three moving averages that have converged. The 8-Day, 20-Day, and 50-Day have come together.
What follows a period of low volatility is a clear increase in volatility. That will likely happen upon a breakout of the pennant. Natural gas remains in a clear downtrend and there was a relatively sharp decline prior to the pennant consolidation pattern. However, the downside may be limited.
29-Year Low is 1.44
In June 2020 a low of 1.44 was reached and price was quickly rejected to the upside. Natural gas traded below the prior support level of 1.52 for only one day before buyers took back control and the early stages of an advance began. That is the lowest price that natural gas has traded at in approximately 29 years. This means that 1.52 is a key low price to watch if a breakdown from the pennant occurs. Given the quick rebound off the 1.44 price level it seems unlikely that that price area will be tested again as support. Nevertheless, it is always a possibility.
Breakdown Signal
Until it is clear that Tuesday’s low of 1.65 is going to be a swing low, a breakdown is triggered on a drop below the earlier swing low at 1.59. It is confirmed on a daily close below that price level. Otherwise, support is likely to continue to be seen near the lower boundary line with trading contained within the pattern. Such a low volatility environment is likely to keep some traders on the sidelines until price breaks out.
Upside Trigger
Although the bear pennant is considered a trend continuation pattern, it is not valid until a breakout is triggered. Therefore, an eventual upside breakout remains a possibility. An upside breakout is triggered on a move above the recent swing high of 1.94. The next time that a bullish breakout could occur would be on the next rally towards the top of the pattern if it does occur.
Read Full Story »»»
DiscoverGold
Agriculture Master Report
By: Bill Moore | April 17, 2024
JULY CORN
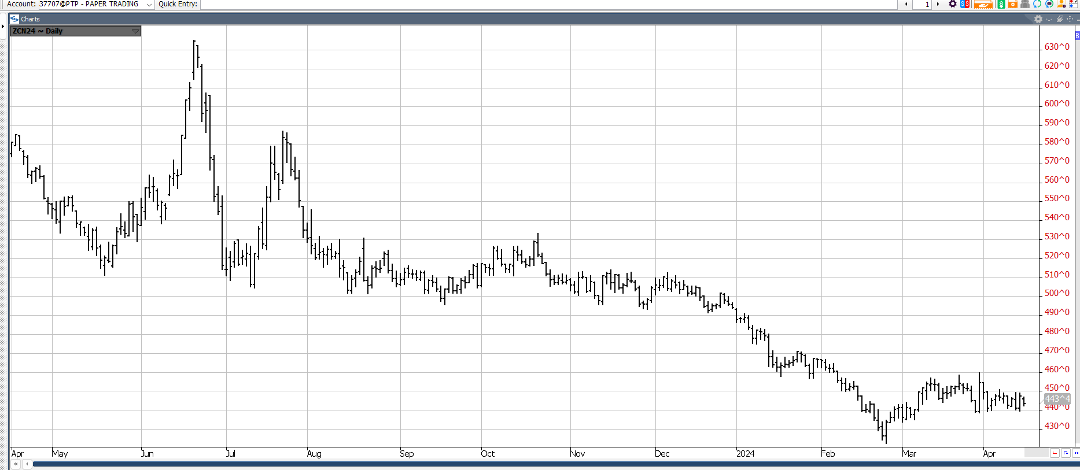
For the past 6 weeks, July Corn has been locked in a tight 20 cent range (440-460), as headwinds such as planting pressure, rains in the dry areas , the Iranian airstrike & the April WASDE Report push it down to the 440 level & tailwinds such as todays export at inspections 1.333 mmt & todays flash sale of 165,000 mt to Mexico lift it to the 460 level! Traders were generally disappointed by the wide disparity in the South American estimates tssued last Friday between the USDA (124) & CONAB (112) & feel the May WADSE will correct it! Common sense would say Brazil has a better handle on their crop size than the USDA!
JULY BEANS
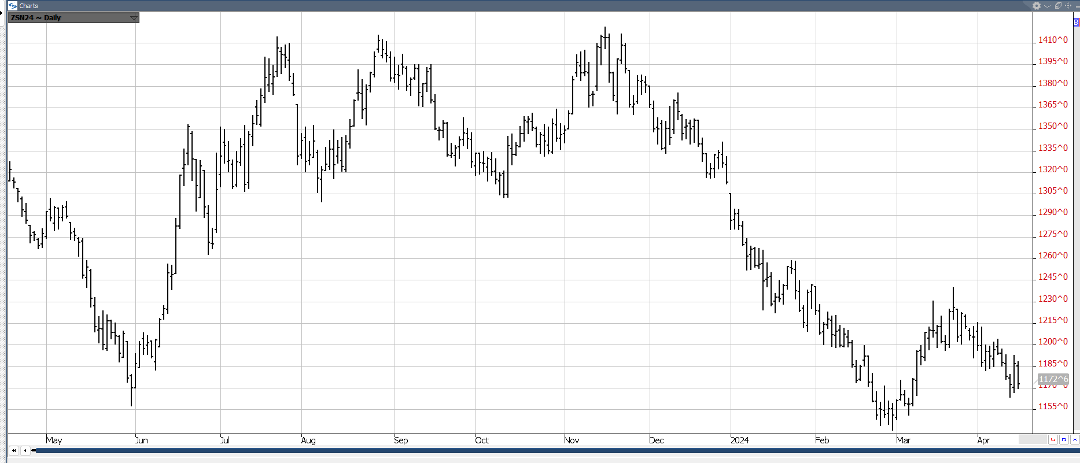
1155 to 1230 has confined July Beans since Mar 1 as it also labors in a tight range buffeted by both positives & negatives! This past week, 3 export flash sales were reported to unknown destinations – 124,000, 254,000 & 124,000! But offsetting that was the USDA report last Thur at 11am CST – keeping the Brazil Beans at 155mmt vs the Conab estimate of 146mmt! This is a very wide discrepancy for this late in the growing season & we expect it to be rectified in the MAY WADSE REPORT! Meanwhile, the mkt is closely monitoring the early planting progress – with corn at 6% & beans at 2-3% complete – due out today at 3pm! With the mkt $2.50 under last Summer & a still sizeable short fund open interest, we feel the mkt leans to an upside bias – when it finally emerges from its sideways, consolidation pattern!
JULY WHT
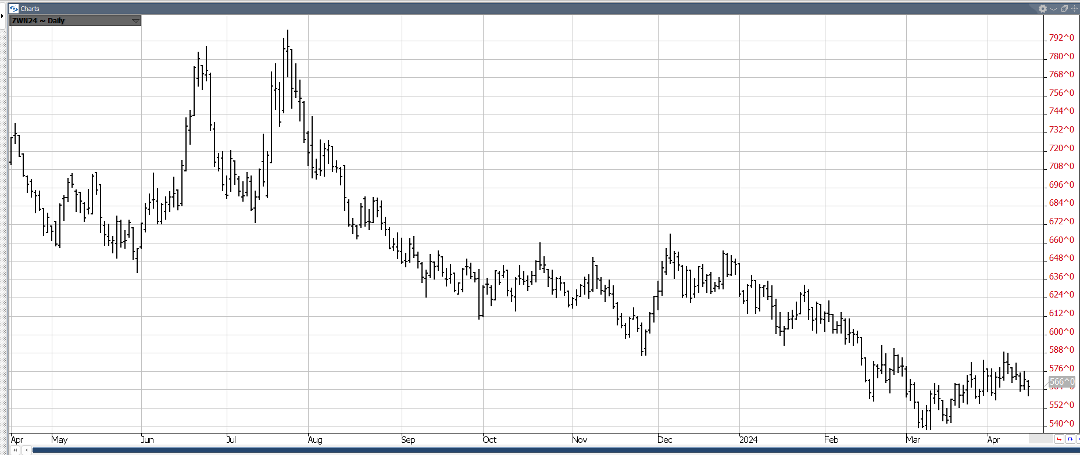
July Wheat was able to back-and-fill its way higher for about a 40 cent rally – before the mkt’s negative reaction to last Thur’s WASDE forced a correction! However, we feel Russian’s recent export woes, the escalating Middle-East conflict, recent Russian military strikes & general dry conditions of their emerging wht crop all favor less production & more exports – and therefore higher prices!
JUNE CAT
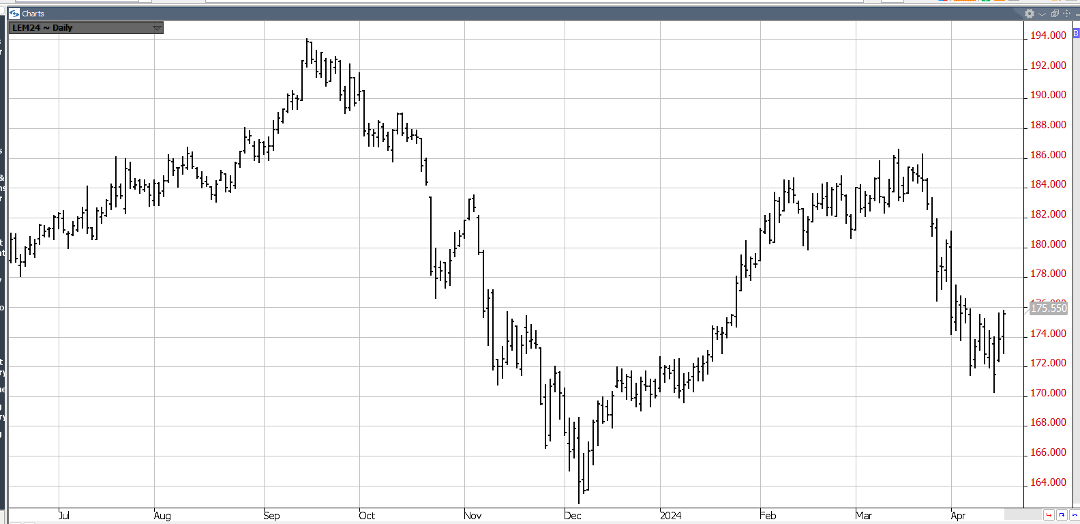
Since late March, June Cattle has plummeted $16 (186-170) – mostly off the impetus of a bearish March Cattle-on-Report which reported placements at 10% over 2023 (est-6%)! The downswing was then exacerbated by the Bird Flu Epidemic which cast serious doubt on beef demand! However, this incident was later mitigated – leaving the mkt sharply over-sold! So, a fierce short-covering rally (170-176) ensued – sparked by our entry into the Spring Grilling season – the best demand period of the year! We look for the mkt to continue to recoup part of the $16 loss – triggered by the fateful March 22nd Cattle-on-Feed Report!
JUNE HOGS
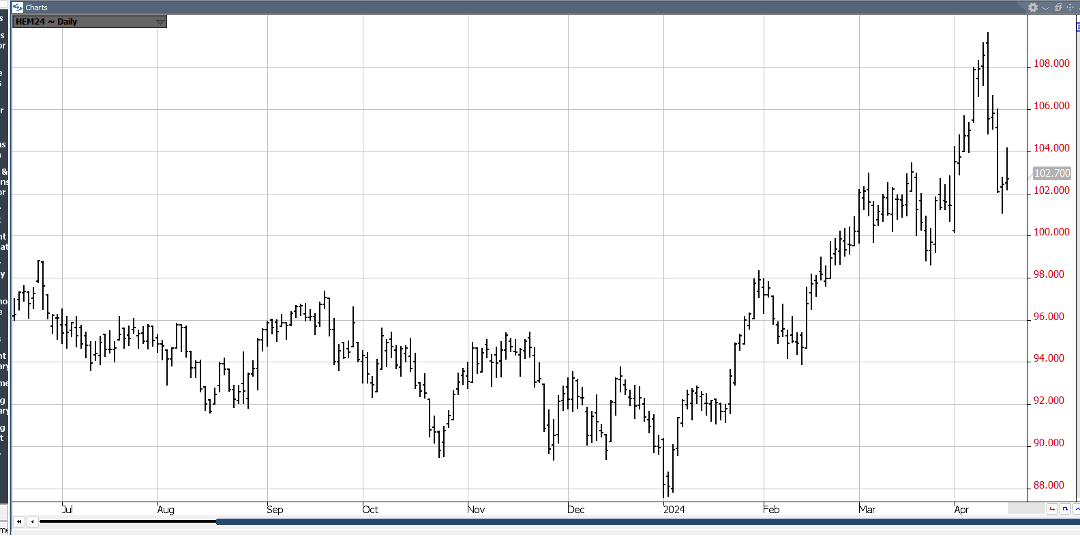
On April 10th, a major Key Reversal occurred – with new contract highs scored early in the trading session – followed by a precipitous decline of nearly $5.00 & a close well under the previous 2-wk lows! The mkt continued down another $4-5.00 to last week’s low of about $101 – as heavier slaughter & pork production fueled the down! But after nearly an $8.00 drop, the mkt became quite oversold & being amidst the best demand period of the year, has rallied back $3.00! We look for all the outdoor grilling to push the mkt back up toward it early April highs! Helping that rally is the fact that China’s 1st Qtr pork production declined to 15.8 million tons – the first qtly fall in 4 years! This seems to indicate that they are finally getting their excess production under control – a positive for pork exports!
Read Full Story »»»
DiscoverGold
Biden’s Oil World. The Energy Report
By: Phil Flynn | April 17, 2024
Wars, rumors of war, record deficits, raging inflation and threating more taxes and regulations on US energy as Iran’s Oil production is allowed to hit a 5 and a half year high and they secretly meet with the Maduro regime while having to decide this week as to whther or not to impose sanctions. And now with the supplies of aluminum platinum tightening ask the CME Group and the London metals exchange decides to not deal with the Russian supply the Biden administration is now suggesting tariffs on Chinese metals.
Oil prices are pulling back as Israel has yet to respond to Iran’s unprecedented attack and stubborn inflation has Jerome Powell said that “If price pressures persist, the Fed can keep rates steady for “as long as needed” and the Biden administration and White House senior adviser John Podesta hinted at another release from the Strategic Petroleum Reserve to try to ease rising gas prices and try to improve his boss’s political fortunes.
The Biden Administration has made no bones about it that the mission of the SPR not just to be used in an emergency but as a political piggy bank where he can use taxpayer paid for oil to improve his political fortunes. Kind of like defying the Constitution and the Supreme court to use your money to pay off some college loans. Yes, President Biden has done this before releasing oil from the SPR before he welcomed a ‘minor incursion” by Russia into Ukraine and before his failed policy of deterrence with sanctions on Russia.
This comes as the American Petroleum Institute released a report that shows that gasoline inventories are tightening as well as diesel but did see an increase in crude oil supply. API reported that gasoline supplies fell by 2.51 million barrels in the current week. AAA pots gas prices at $3.660 A gallon up from $3.644 yesterday and up from $3.461 a month ago, Year over year they are about a penny lower, and that was when the market was getting regular released from the SPR that could be exported to China and India and Europe. Yes, oil exports in the US did hit record highs as we drained our SPR.
So, it’s probably good news that the API reported that we saw crude inventories rise by 4.09 million barrels, but it is more than likely that that’s going to change as refiners have to ramp up production. Gasoline supplies are below normal and so we’re distilling inventories and they fell to 427,000 barrels. The smaller than expected 169,000 drawdown and Cushing OK may be a sign that the crude oil supply increases could be coming to an end and that may pressure the Biden team to use SPR oil once again in an attempt to keep down gasoline prices.
First behind the backdrop is the market waiting to see how Israel is going to respond to that unprecedented attack by Iran on its own soil it seems like Iran is taking steps because I think they are starting to realize that after their failed assault maybe they bit off a little bit more than they can chew. Today Iran is talking about letting in nuclear weapons inspectors from the International Atomic Energy agency which would be the first time this year.
Bloomberg reported that Rafael Mariano Grossi, director-general of the UN’s nuclear watchdog, will visit Iran “soon,” the head of the Atomic Energy Organization of Iran said on Wednesday, according to the state-run Hamshahri newspaper. Mohammad Eslami said the date of Grossi’s visit had not yet been decided, Hamshahri reported. He also said that International Atomic Energy Agency cameras were installed and “constantly monitoring” Iran’s nuclear facilities. Remember the AP reported that the head of the International Atomic Energy Agency said Wednesday that Iran’s decision in September to bar several experienced U.N. inspectors from monitoring the country’s nuclear program constituted “a very serious blow” to the agency’s ability to do its job “to the best possible level” last November.
And while traders may be selling futures at the same time, we’re seeing a record amount of call buying for just in case scenarios some of the calls amazingly enough our way out of the money $250 Brent crude calls. If you buy enough of those options and you’ll get a spike in the price of crude oil you don’t have to get anywhere near $200 a barrel to do very well on a very cheap investment still it’s a long shot but it’s interesting that some serious money is making that bet.
of course geopolitical events sometimes really put a different perspective on good old fashioned supply and demand fundamentals. Once we see a significant change in the economic outlook the global oil market is going to continue to be undersupplied for the rest of the year. Misuse of strategic petroleum reserves around the world have discourage investment along with ESG responsible for taking away much needed funds from fossil fuel investment and putting them into other types of things that will not be able to help the global economy in the short run so it’s no wonder that these losing ESG investments s that were based more in false virtue instead of common sense Have some investors fleeing the sector and droves.
The American Petroleum Institute also is warning that Bidens lessee ban on Federal land is going to be bad for US economy and taxpayers. The API says “As energy demand continues to grow, oil and natural gas development on federal lands will be foundational for maintaining energy security, powering our economy and supporting state and local conservation efforts. Overly burdensome land management regulations will put this critical energy supply at risk. We are reviewing the rule to ensure the Biden administration is upholding its responsibilities to the American taxpayers and promoting fair and consistent access to federal resources.”
They point out some of the benefits that we will forgo such as the fact that “In FY 2022, onshore federal oil and natural gas development supported nearly 250,000 jobs, generated $19.4 billion in labor income, and contributed $36.7 billion to GDP.
In FY 2022, oil production on federal lands averaged 1.2 million barrels per day and marketed natural gas production averaged over 9 billion cubic feet per day. Between FY 2013 and FY 2022, oil and natural gas production on federal lands generated a total of $35 billion in disbursement revenue from bonuses, rents, and royalties, averaging approximately $3.6 billion per year. 53% of this disbursement revenue, totaling more than $19 billion, went to the federal government or programs, while state and local governments received the remaining 47%, totaling $16 billion.
In FY 2022, federal oil and gas development in the five highest producing states supported more than 170,000 jobs and more than 75,500 jobs in other U.S. states mainly through the supply chain and other purchasing. New Mexico: 105,300 jobs/ Wyoming: 24,400 jobs/Colorado: 21,000 jobs/Utah: 11,200 jobs/North Dakota: 10,000 jobs.
I guess we all wonder why that the Biden Administration is not as tough in enforcing Iranian sanctions and sanctions on Venezuela.
Who winters over winter is not over until we say it is. OK maybe that’s a little bit strong but we did get a little bit of a rebound in the beleaguered natural gas market after a report that we could get a may freeze. This is why here in Wisconsin you better not plant those flowers until Mother’s Day. Yet the overall outlook for natural gas continues to be bleak. EBW Analytics says that The mini rally in the May contract crashed lower last week as daily heating demand collapsed and acute weakness in LNG exports emerged alongside a bearish EIA storage surprise. Henry Hub prices in the $1.30s/MMBtu remain an alarming bearish warning sign of downside risks ahead of May expiration.
Acute weakness in LNG feedgas demand collapsing sub-10 Bcf/d represents near-term risks, although a probable rebound higher could help stabilize prices.
Natural gas production scrapes continue to descend more rapidly than projected, offering bullish upside into summer. Still, weak EIA storage figures pose a risk that imprecise pipeline scrapes may overstate supply losses. Near-term difficulties in sustainably lowering the storage surplus indicate likely continued weakness for near-term NYMEX futures. As weather headwinds ebb and storage surpluses decline into summer, however, natural gas may rise.
Read Full Story »»»
DiscoverGold
Lumber forming the dreaded tear drop pattern and is on track for its 11th consecutive red day
By: Barchart | April 16, 2024
• Lumber forming the dreaded tear drop pattern and is on track for its 11th consecutive red day.

Read Full Story »»»
DiscoverGold
Cocoa is crashing down 8.54% today
By: Markets & Mayhem | April 16, 2024
• Cocoa is crashing down 8.54% today.

Read Full Story »»»
DiscoverGold
Grains Report: Wheat, Rice, Corn and Oats, Soybeans, Canola and Palm Oil
By: Jack Scoville | April 16, 2024
• WHEAT
General Comments: Wheat was lower yesterday in range trading. Trends remain mixed in all three markets. The problems with Russian Wheat exporters continue. The reports indicate that the government is seeking more control of the exports and has made life very difficult on the private exporters in an effort to extract more sales and powers to the government. Russia is the world’s largest exporter and sets the world price and prices remain low. Big world supplies and low world prices are still around. Export sales remain weak on competition from Russia, Ukraine, and the EU as those countries look to export a lot of Wheat in the coming period. Black Sea offers are still plentiful, but Russia has been bombing Ukraine again and shipments might be hurt from that origin.
Overnight News: The southern Great Plains should get mostly dry conditions. Temperatures should be above normal. Northern areas should see mostly dry conditions. Temperatures will average above normal. The Canadian Prairies should see mostly dry conditions. Temperatures should average above normal.
Chart Analysis: Trends in Chicago are mixed. Support is at 539, 537, and 527 May, with resistance at 568, 575, and 580 May. Trends in Kansas City are mixed. Support is at 571, 561, and 552 May, with resistance at 597, 602, and 605 May. Trends in Minneapolis are mixed. Support is at 634, 625, and 618 May, and resistance is at 650, 655, and 660 May.
• RICE
General Comments: Rice closed sharply higher yesterday as the long liquidation by the funds is now complete. Futures were a little weaker at points during the week in reaction to the USDA supply and demand reports, but the rebound from the fund selling was more important. USDA cut domestic demand a lot but increased export demand for increased ending stocks levels. USDA also increased world ending stocks estimates for the year. Trends are up in this market on the daily charts. The market noted good planting and emergence progress in the weekly USDA reports released on Monday afternoon. Good demand for exports continues.
Overnight News:
Chart Analysis: Trends are up with no objectives of 1748 May. Support is at 1800, 1778, and 1725 May and resistance is at 1850, 1870, and 1907 May.
• CORN AND OATS
General Comments: Corn closed lower and Oats closed higher yesterdAY as traders think that good Spring weather here will greatly increase planted Corn area. The USDA supply and demand reports showed reductions in Corn ending stocks in line with trade expectations but still over 20 billion bushels. Increased demand was noted in all domestic categories, but export demand was left unchanged. South American production estimates were little changed. It is very expensive to plant Corn and Corn is considered unprofitable to plant right now, so planted are might not increase that much if at all. USDA issued its crop progress report for Corn and Corn planting is proceeding slowly. Demand for Corn has been strong at lower prices. Big supplies and reports of limited demand are still around, but futures have been very oversold. Funds remain very large shorts in the market.
Overnight News:
Chart Analysis: Trends in Corn are mixed. Support is at 426, 422, and 408 May, and resistance is at 437, 448, and 459 May. Trends in Oats are mixed. Support is at 344, 339, and 334 May, and resistance is at 369, 362, and 369 May.
• SOYBEANS
General Comments: Soybeans and Soybean Oil closed lower and Soybean Meal closed higher last week in response to the USDA supply and demand estimates that showed a greater increase in US ending stocks than the market had anticipated. South American production estimates were little changed. Brazil producers had been taking advantage on higher futures in the US and higher basis levels in Brazil, but the basis has fallen sharply in Brazil this week and sales have been less. Reports of great export demand in Brazil provide some support. Reports indicate that China has been a very active buyer of Brazil Soybeans this season. Ideas that South American production is taking demand from the US have pressured futures lower. Funds remain large shorts in the market. The US reports strong domestic demand.
Overnight News:
Chart Analysis: Trends in Soybeans are mixed. Support is at 1166, 1152, and 1140 May, and resistance is at 1181, 1193, and 1207 May. Trends in Soybean Meal are mixed to up with no objectives. Support is at 336.00, 330.00, and 325.00 May, and resistance is at 348.00, 352.00, and 35=7.00 May. Trends in Soybean Oil are down with objectives of 4430 May. Support is at 4520, 4420, and 4360 May, with resistance at 4730, 4830, and 4980 May.
• CANOLA AND PALM OIL
General Comments: Palm Oil was lower last week in sympathy with the price action in Chicago and on demand concerns. It wqs lower today on ideas of demand weakness. The export pace is expected to continue to really improve but this is part of the price already, in part due to stronger world petroleum prices that have affected world vegetable oils prices as well. Domestic biofuels demand is likely to improve. Ideas of weaker production ideas against good demand still support the market overall. Trends are turning up on the daily charts. Canola was lower in response to the USDA reports that showed plenty of oilseeds viable in the US and the world and on price action in Chicago.
Overnight News:
Chart Analysis: Trends in Canola are mixed to down with objectives of 617.00 and 596.00 May. Support is at 620.00, 616.00, and 610.00 May, with resistance at 637.00, 645.00, and 652.00 May. Trends in Palm Oil are mixed. Support is at 4110, 4040, and 3920 July, with resistance at 4180, 4220, and 4300 July.
Midwest Weather Forecast
Read Full Story »»»
DiscoverGold
Softs Report: Cotton, OJ, Coffee, Sugar, Cocoa
By: Jack Scoville | April 16, 2024
• COTTON
General Comments: Cotton was a little higher to relieve oversold conditions from weaker demand ideas. The export sales report showed poor dales once again. USDA made no changes to the domestic supply or demand sides of the balance sheets, but did cut world ending stocks slightly. Trends are still down on the daily and weekly charts. Demand has been weaker so far this year. The US economic data has been positive, but the Chinese economic data has not been real positive and demand concerns are still around. However, Chinese consumer demand has held together well, leading some to think that demand for Cotton in world markets will increase over time.
Overnight News: The Delta will get showers and rains and near normal temperatures. The Southeast will see showers and rains and near normal temperatures. Texas will have mostly dry conditions and near normal temperatures.
Chart Trends: Trends in Cotton are down with objectives of 77.20 May. Support is at 81.70, 80.80, and 79.30 May, with resistance of 86.20, 88.20 and 91.40 May.
This Week Last Qeek Last Year Average
Cotton Planted 8 5 7 8
• FCOJ
General Comments: FCOJ closed higher yesterday and remains at the top edge of a trading range. The move came in reaction to the latest USDA reports that showed less production. Florida production is now estimated at 18.8 million boxes, from 19.8 million last month. Reports of tight supplies are around. Florida said that Oranges production will be low, but above a year ago. Futures still appear to have topped out even with no real downtrend showing yet, so a range trade has been seen. Prices had been moving lower on the increased production potential for Florida and the US and in Brazil but is now holding as current supplies remain very tight amid only incremental relief for supplies is forecast for the coming new crop season. There are no weather concerns to speak of for Florida or for Brazil right now. The weather has improved in Brazil with some moderation in temperatures and increased rainfall amid reports of short supplies in Florida and Brazil are around but will start to disappear as the weather improves and the new crop gets harvested.
Overnight News: Florida should get scattered showers or dry conditions. Temperatures will average near normal. Brazil should get scattered showers and above normal temperatures.
Chart Trends: Trends in FCOJ are mixed. Support is at 350.00, 347.00, and 353.00 May, with resistance at 378.00, 389.00, and 391.00 May.
• COFFEE
General Comments: Both markets closed sharply higher yesterday and both show up trends on the daily and weekly charts. The lack of Robusta Coffee in the market continues to support futures. Robusta offers from Vietnam remain difficult to find and the lack of offer of Robusta is a bullish force behind the London market action. There were some indications that Vietnam producers were now offering a little Coffee, but not much and not nearly enough to satisfy demand. Vietnamese producers are reported to have about a quarter of the crop left to sell or less and reports indicate that Brazil producers are reluctant sellers for now after selling a lot earlier in the year. The next Robusta harvest in Brazil is starting now.
Overnight News: The ICO daily average price is now 223.13 ct/lb. Brazil will get mostly scattered showers with near normal temperatures. Central America will get mostly dry conditions. Vietnam will see scattered showers
Chart Trends: Trends in New York are up with no objectives. Support is at 214.00, 210.00, and 208.00 May, and resistance is at 235.00, 238.00 and 241.00 May. Trends in London are up with objectives of 4090 May. Support is at 3840, 3760, and 3700 May, with resistance at 4000, 4030, and 4060 May.
• SUGAR
General Comments: New York and London closed lower again yesterday and trends are down on the charts as the market seems to have supplies available for sale. There are still ideas that the Brazil harvest can be strong for the next few weeks if not longer. Indian production estimates are creeping higher but are still reduced from recent years. There are worries about the Thai and Indian production. Offers from Brazil are still active but other origins. are still not offering in large amounts except for Ukraine. Ukraine offers have suffered lately with the war. Demand reports from Europe have been strong.
Overnight News: Brazil will get rains in the south and scattered showers in the north. Temperatures should average above normal. India will get mostly dry conditions and below normal temperatures.
Chart Trends: Trends in New York are down with objectives of 1950 July. Support is at 2000, 1980, and 1940 July and resistance is at 2050, 2100, and 2150 July. Trends in London are down with objectives of 567.00 August. Support is at 579.00, 574.00, and 568.00 August, with resistance at 600.00, 608.00, and 617.00 August.
• COCOA
General Comments: New York and London were higher yesterday and trends are up. Production concerns in West Africa as well as demand from nontraditional sources along with traditional buyers keep supporting futures. Production in West Africa could be reduced this year due to the extreme weather which included Harmattan conditions. The availability of Cocoa from West Africa remains very restricted and projections for another production deficit against demand for the coming year are increasing. Ideas of tig8ht supplies remain based on more reports of reduced arrivals in Ivory Coast and Ghana continue. Ivory Coast arrivals are now 1,301 tons, down 26.7% from the previous year. Mid crop harvest is now underway and here are hopes for additional supplies for the market from the second harvest. Demand continues to be strong, especially from nontraditional buyers of Cocoa.
Overnight News: Isolated showers are forecast for West Africa. Temperatures will be near normal. Malaysia and Indonesia should see scattered showers. Temperatures should average near normal. Brazil will get isolated showers and above normal temperatures.
Chart Trends: Trends in New York are up with objectives of 11890 May. Support is at 10380, 10000, and 9630 May, with resistance at 11200, 11320, and 11440 May. Trends in London are mixed to up with no objectives. Support is at 8570, 8080, and 7930 May, with resistance at 9320, 9440, and 9560 May.
Read Full Story »»»
DiscoverGold
Inflation Nation Everywhere. The Corn & Ethanol Report
By: Daniel Flynn | April 16, 2024
We start off the day with Building Permits Prel, Building Permits MoM Prel, Housing Starts, and Housing Starts MoM at 7:30 A.M., Redbook YoY at 7:55 A.M., Industrial Production MoM & YoY, Capacity Utilization, and Manufacturing Production MoM & YoY at 8:15 A.M., 42-Day Bill Auction and 52-Week Bill Auction at 10:30 A.M., and API Energy Stocks at 3:30 P.M.
With inflation rocketing out of control and being on the brink of war physical gold and gold futures have repeatedly set new record highs, starting in early March, as buyers seek a home for cash to avoid lost purchasing power in US dollars. Last week, nearby gold futures reached a record high of $2,429/oz. The latest Commitment of Traders report showed that the week ending Apr 9th, funds bought 929 contracts of gold futures and held the largest net long position since July 2020. This is compared to commercial buying of 1,226 contracts, which resulted in a &82.50 price change for the week. The rally in gold prices appears to be much about limited commercial selling. In fact, commercials have been net buyers for the last month. With the US now adding $ 1 trillion in debt every 100 days in this out of sight-out of mind economy. Inflation rates are expected to rise in the coming months further robbing the US dollar for purchasing power. As such, Chinese demand for gold stays strong. In the overnight grain futures started out firmer but sold off due to strengthening US dollar. China’s economy grew at a better than expected 5.3% in the 1st quarter of 2024 on a 14% gain on exports year-over-year. However, Chinese retail sales grew by just 3.1%, which was lower than expectations of 4.6%. The Chinese GP growth helped bump grain/oilseed futures initially higher, but the strengthening dollar acted to tug commodities to weaker morning levels. Geopolitical fears are now also in the mix with runaway inflation and the usual suspects with seedings started and we will watch South American weather and monitor any movement of Ukraine product into the next phase of the US growing season.
Read Full Story »»»
DiscoverGold
Buying Rumors. The Energy Report
By: Phil Flynn | April 16, 2024
Global oil prices went through the ‘buy the rumor sell the fact’ on the Iranian attack on Israel and now are still waiting to see what Israel’s response will be. Reports by the Israeli Defense Minister Yoav Gallant said that Israel would have no choice but to retaliate and reports that the ground invasion in Rafah southern Gaza will be put off until the Iranian response happens. This raises more questions than answers. Iran’s attack on Israel seems to have given Israel surges in international support even by Arab nations that are tired of Iran’s goal to disrupt peace in the region.
Iran is the driving the force between Hezbollah, Hamas and the Houthi rebels that have basically destabilized the region and caused war and turmoil for almost every country in the world. It also clear that the failure to enforce sanctions on Iran has allowed Iran to raise oil output to a 5 and a half year high and the billions of dollars they are reaping for this has gone to fund terror and bloodshed. Now after the attack, many countries are urging Israeli restraint on its response to Iran but secretly behind the scenes, they would love nothing better than to see the Iranian regime fall because of all the havoc that they’ve been causing. Oil prices have sold off because of the expectation that Israel will be measured in the response and is putting pressure on prices, but it may not be long before we start buying the rumor of an attack once again.
Zero Hedge reports that new statements from the Pentagon issued Monday have said the Houthis fired over 90 ballistic missiles and drones – most of which were intercepted by US and allied forces over the past 48 hours, once the Iranian attack kicked off in the overnight hours of Saturday. US Central Command described that at one point during the attack the Houthis fired an anti-ship ballistic missile directly against US Navy and commercial ships in the Gulf of Aden. “There were no injuries or damage reported by US, coalition, or commercial ships,” CENTCOM said.
Oil prices seem to be getting mixed emotions from Chinese economic data. The gross domestic product seems to be better than expected but the report on consumer demand seemed to be disappointing especially because of past reports that over the Chinese holiday domestic demand was at pre COVID levels.
Domestic oil production also increased but make no mistake about it, they’re still going to need a lot of oil from other places. The Wall Street Journal wrote, “With familiar signs of weakness in consumption and real estate in the first three months of the year, many economists say Beijing still isn’t doing enough to support Chinese households and nurture a more balanced recovery. And the loss of some momentum in March compared with the preceding two months reinforced expectations that further stimulus will be needed to ensure that the government meets its growth target of around 5% for the year. China said its economy grew 5.3% in the first quarter compared with the same three months a year earlier, a faster pace than the 5.2% year-over-year growth rate that the country notched in the final quarter of 2023, China’s National Bureau of Statistics said Tuesday. The pickup was propelled by a rise in industrial production and swelling investment in factories. After a challenging few year, Chinese officials are steering activity and investment toward manufacturing and exports to compensate for domestic consumers’ reluctance to spend and a continuing crunch in the property market.”
It is very powerful that yesterday sell off oil price low set the low for the week. We expect modest drawdowns in crude oil and products and today’s American Petroleum Institute report and we expect to see an uptick in demand after the drop in demand that we saw over the Easter holiday weekend. I expect that the exports for oil and gasoline will rebound, and we should see an uptick in gasoline demand as well and with the ongoing risk to supplies, it’s unlikely that the market is at a point where it will collapse.
Reuter reports that – Russia has been able to swiftly repair some of key oil refineries hit by Ukrainian drones, reducing capacity idled by the attacks to about 10% from almost 14% at the end of March, Reuters calculations showed. Ukraine stepped up drone attacks on Russian energy infrastructure since the start of the year, hitting some major oil refineries across the world’s second largest oil exporter in attacks that sent up oil prices.
Natural gas cash prices are falling once again and even with the drop in US natural gas, rigs production may not be falling quite fast enough. Yahoo finance writes, “the bearish sentiment surrounding the commodity even prompted shale producers Chesapeake Energy CHK and EQT Corporation EQT to hit the brakes on new drilling. Chesapeake announced a reduction in its drilling rigs so as to lower volume. The company has decided to cut this year’s gas production expectations by around 20%. Chesapeake’s plans rippled through the market, with Appalachian Basin-focused EQT following on. The explorer and producer of natural gas said that it will lower its daily output by 1 Bcf to combat the supply glut in the U.S. market. According to EQT, the revised plan will likely reduce net production by 30-40 Bcf. While these production cut announcements temporarily drove natural gas prices higher, they have failed to galvanize the market.”
Read Full Story »»»
DiscoverGold
Commodities Daily Market Movers (% Price Change)
By: Marty Armstrong | April 16, 2024
• Top Movers
AU - Victoria Base-Load Electricity Futures 6.52 %
Rough Rice Futures (CBOT) 6.38 %
London Aluminum Spot 4.91 %
Coffee (NYCSCE) Futures 2.9 %
NY Copper Futures 2.83 %
• Bottom Movers
NY Natural Gas Futures 4.46 %
Palm Kernel Oil 3.05 %
London IPE Gas Oil Futures 3.01 %
Gold LBM per Oz (USD) 2.77 %
Zinc (99.995%) Spot 2.77 %
*Close from the last completed Daily
DiscoverGold
Natural Gas Testing Support Amidst Low Volatility
By: Bruce Powers | April 12, 2024
• Natural gas is testing support around the downtrend line and 20-Day MA. Signs of strength are crucial if the rally off trend lows has a chance to continue.
Natural gas dipped briefly below the minor 1.75 swing low from Monday before finding support at 1.73 and stalling the descent. Volatility diminished as it is on track to complete a narrow range day while further testing support around the long-term downtrend line and 20-Day MA, now at 1.76. If natural gas can advance above today’s high of 1.785 heading into next it has a chance to progress the near-term uptrend that starts from the higher swing low and potential second bottom (C).
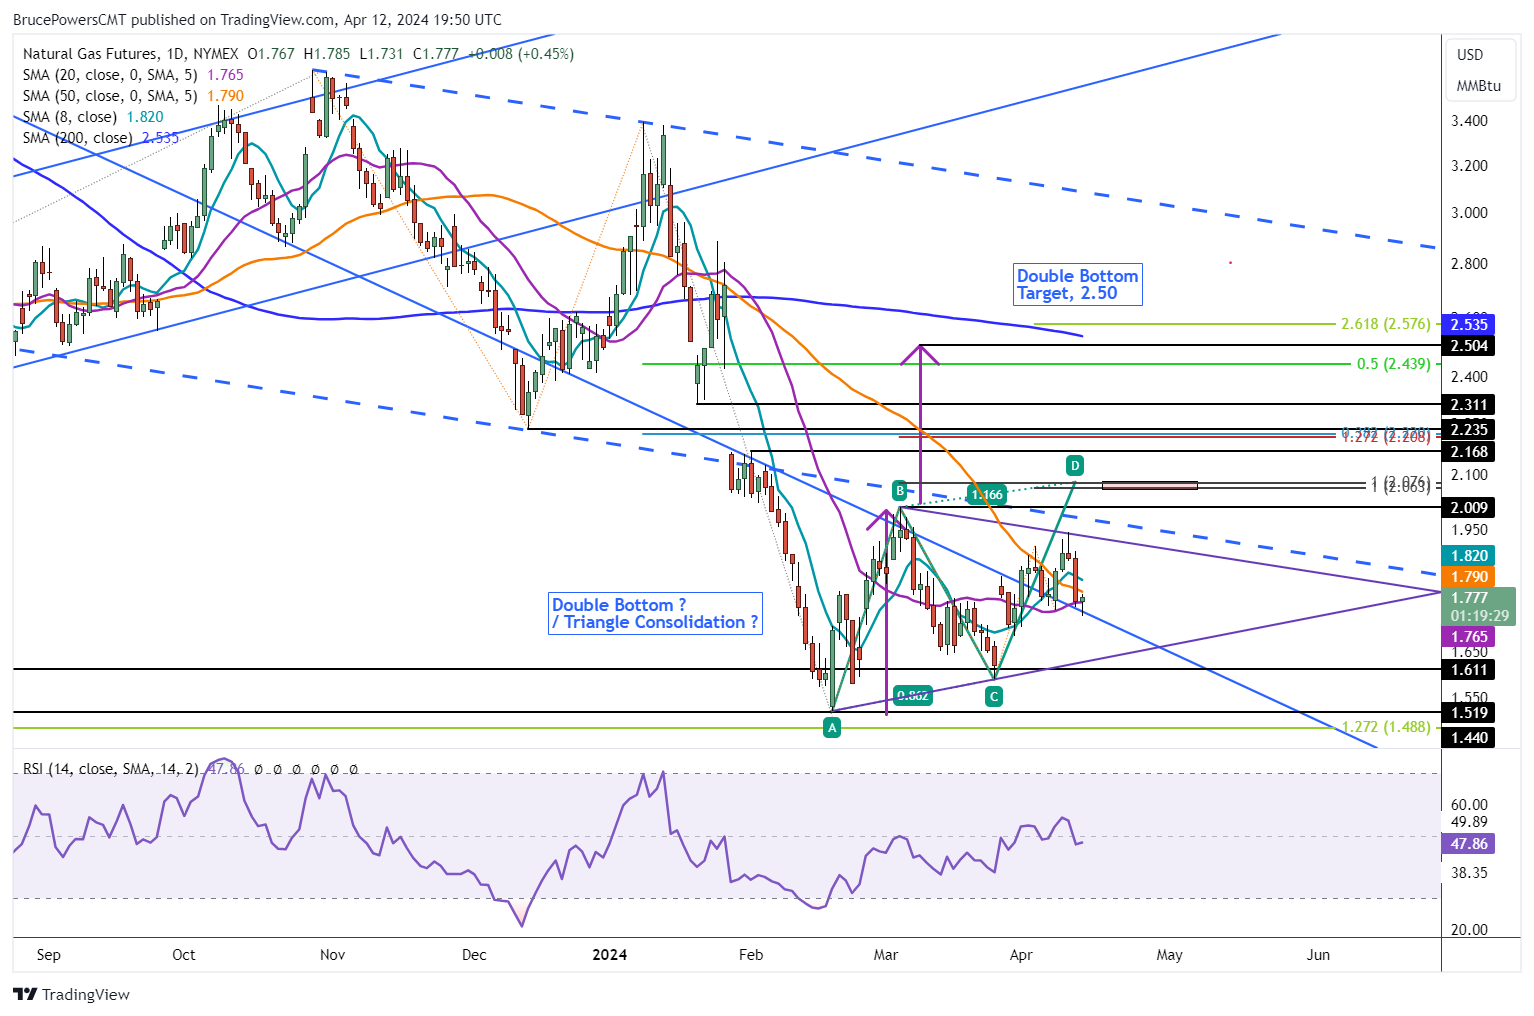
Drop Below Today’s Low Points to Lower Triangle Line
However, a drop below today’s low without a quick recovery increases the chance that natural gas will further trace out a developing symmetrical triangle (purple). A drop below today’s low increases the chance of a test of support at the lower boundary line of the triangle. Recent minor signs of strength seen recently as natural gas recaptured both the 20-Day and 50-Day MAs would then be negated.
Rally Above 1.785 Would Be First Sign of Strengthening
Nevertheless, if natural gas can continue to find support around the downtrend line and 20-Day MA, followed by signs of strength, it will likely have completed a minor pullback. The chance for an eventual bull trend continuation will then become more likely. A rally above today’s high of 1.785 will provide an initial signal, but upside follow through will be key as to whether it can keep rising from there.
Weekly Chart Analysis
On a weekly basis, natural gas is on track to close weak, in the lower third of the week’s range and possibly with a doji. The weekly candle will be bearish unless natural gas can rise before today’s close. Last week also ended relatively weak. This week will be the second in a row where natural gas is closing in the lower area of the week’s range. In both cases support for the week was seen in the 8-Week MA.
Natural gas has been mostly below the 8-Week line since early-January. So, a successful test of support at the 8-Week line is one sign of strength. Regardless, the weekly performance did not confirm strength since this week and last week ended (likely) in the lower part of the range. Therefore, a drop below today’s low would also give a weekly bearish signal relative to this week’s low and the 8-Week MA.
Read Full Story »»»
DiscoverGold
Commodities Daily Market Movers (% Price Change)
By: Marty Armstrong | April 12, 2024
• Top Movers
AU - Victoria Base-Load Electricity Futures 4.05 %
Oats (CBOT) Futures 2.96 %
Oats (Minneapolis) 2.38 %
Coffee (NYCSCE) Futures 2.21 %
Zinc (99.995%) Spot 1.88 %
• Bottom Movers
NY Natural Gas Futures 6.42 %
Cheese 3.82 %
Soybean Oil CBT Futures 3.32 %
London Nickel Spot 3.03 %
Sugar World (CSCE) Futures 2.84 %
*Close from the last completed Daily
DiscoverGold
Natural Gas Testing Support Amidst Consolidation
By: Bruce Powers | April 11, 2024
• Natural gas prices test support at 20-day MA, poised for bullish reversal or failure to lower prices.
Natural gas retreats further from Wednesday’s 1.94 high on Thursday as it tests support around the 20-day MA with the day’s low of 1.77. The 20-Day line is at 1.76 and it is strengthened by the long-term downtrend line, which marks the same price area. Notice that the 20-Day line and trendline have joined together. This should lead to a rejection of price to the upside, but there are no signs of it yet.
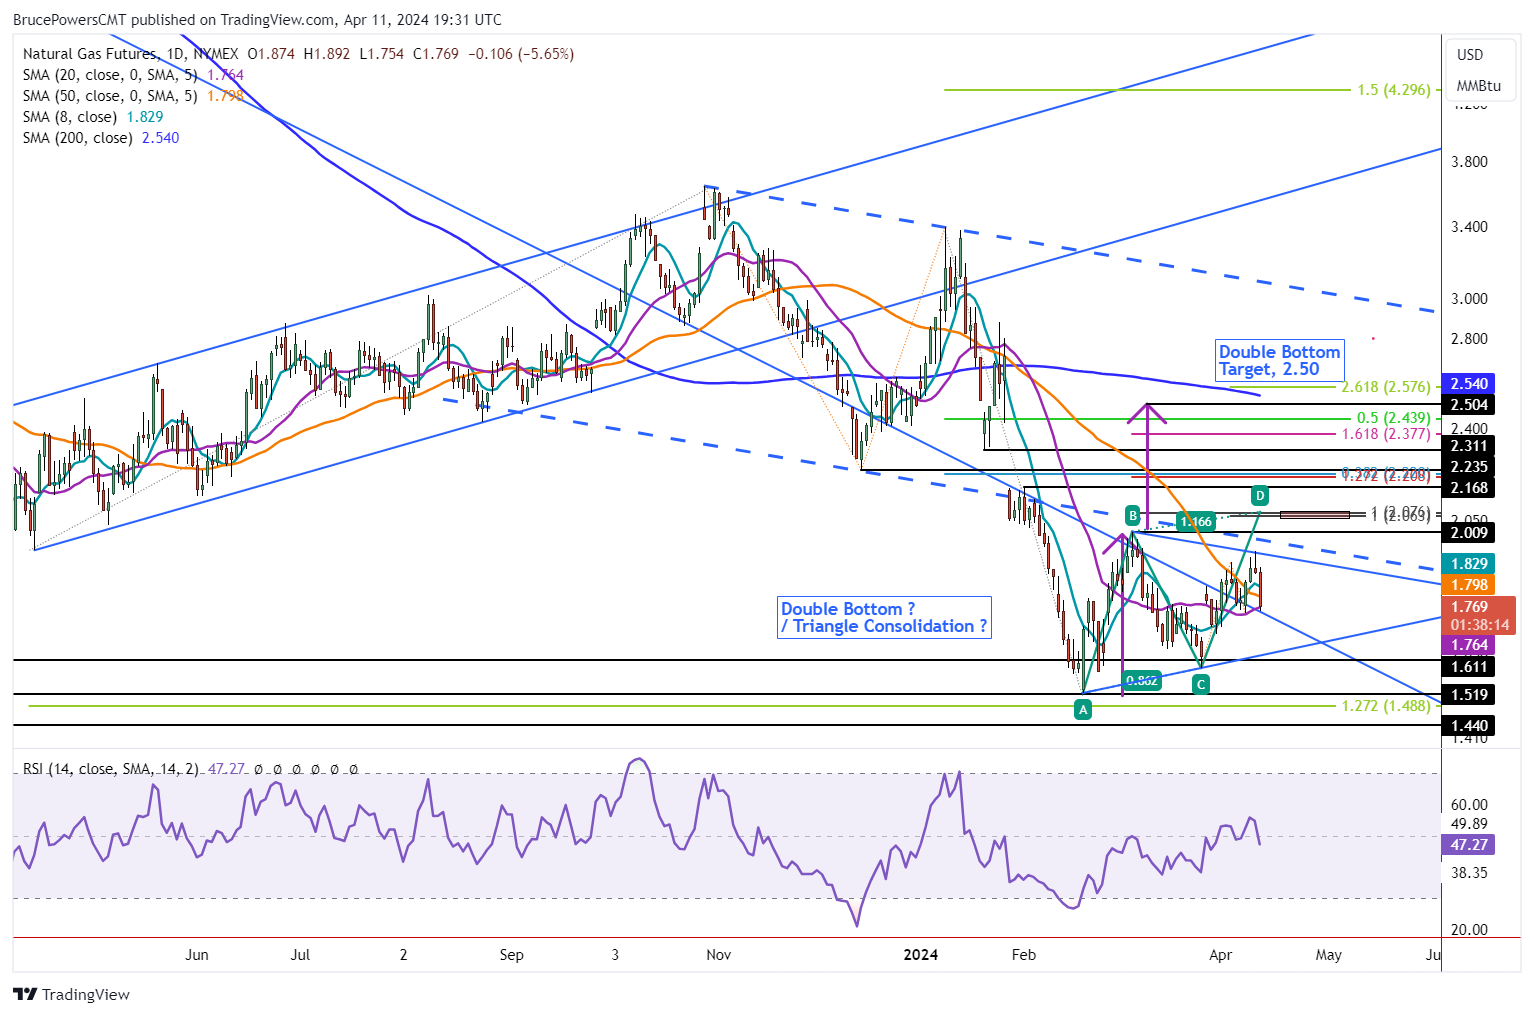
Moving Averages Show Improving Strength
Natural gas rallied back above the 20-Day line on April 1, and there was one subsequent successful test of support at the 20-Day MA. Today provides the second such test. A bounce and bullish reversal off the 1.76 price zone should complete the test and clear the way for natural gas to continue to advance. Over the past week the 8-Day MA has risen back above both the 20-Day and 50-Day MAs. And there was recently a higher swing low (C), reflecting improving demand.
Further Consolidation Possible Until Clear Breakout
Nevertheless, there is also a possibility that natural gas traces out a consolidation pattern. A bearish pennant or symmetrical triangle is the form now taking shape. It remains valid until there is an upside breakout above Wednesday’s high of 1.87. A drop below Monday’s low of 1.75 will increase the likelihood that consolidation may continue.
Rise Above 1.89 Shows Strength
Near-term resistance is now at today’s high of 1.89. A breakout above that high will provide the next sign of strength that could lead to a breakout above Wednesday’s high of 1.94. Once there is a daily close above that level natural gas should be ready to progress higher. The neckline for a potential double bottom bullish pattern is at 2.01 (B), with the first higher target zone around 2.06 to 2.08. Other target areas of interest are marked on the chart.
Weekly Chart, Bullish Signs
The weekly chart (not shown) is not a screaming buy, but it does show bullish progression. Last week’s close was relatively weak as it was in the lower half of the week’s trading range. Further, this week’s performance is also at risk of closing in the lower half of the week’s range. At the same time, this week’s low and last week’s both found support around the 8-Week MA, now at 1.73.
Read Full Story »»»
DiscoverGold
Coffee Hits All-Time High
By: Barchart | April 11, 2024
• Coffee Hits All-Time High.

Read Full Story »»»
DiscoverGold
The Corn & Ethanol Report
By: Daniel Flynn | April 11, 2024
We kickoff the day with Export Sales, PPI MoM & YoY, Core PPI MoM & YoY, PPI, Initial Jobless Claims, Continuing Jobless Claims, Jobless Claims 4-Week Average, PPI Ex Food, Energy, and Trade, and PPI Ex Food, Energy, and Trade MoM & YoY at 7:30 A.M., Fed Williams Speech at 745 A.M., EIA Natural Gas Storage at 9:30 A.M., 4-Week & 8-Week Bill Auction at 10:30 A.M., Crop Production, USDA Supply/Demand, WASDE, Fed Collins Speech, and 15 & 30-Year Mortgage Rate at 11:00 A.M., 30-Year Bond Auction at 12:00 P.M., and Fed Bostic Speech at 12:30 P.M.
With Crop production, USDA Supply/Demand WASDE and CONAB data match up the PPI and Jobless Claims should steel the show. After the morning inflation numbers as we digest the numbers we will see if those numbers put a wrinkle in the April grain reports. There are reports of the FED sounding more hawkish as inflation is taking its toll with the working class and there will be consequences at the ballot box, especially if there is no end in sight. Pre-report long term fundamentals, featuring Ukrainian corn priced to sell. US competitive with South America through summer. Ukraine’s war, freight and insurance cost challenges have kept fob premiums there deflated, which has allowed the Ukraine to capture market share in E Asia. Including China. Otherwise, unlike recent years, US Gulf corn at $490/Bu is not expensive in the world marketplace. Export Sales stay elevated relative to last year into June & July. Spot Argentine fob basis has rallied to $.70 over May CBOT. Brazilian corn isn’t quoted prior to July. US corn for delivery is offer $.12/Bu below Brazilian and at parity with Argen tin when all fobbing costs are added. This is much different than summer 2022 and 2023, when US corn was the high cost origin – due to tight stocks. A year ago April forward Brazilian offers were a full $.90-100/Bu below US Gulf origin! An outright collapse in US export demand is unlikely. Add disease pressures on Argentine corn is knifing production. Traders are waiting and will focus on South American crop sizes and the disparity between CONAB & WASDE data. Most expect a bearish US and world balance sheet. The Brazilian number holds the key, while Argentine disease concerns may lurk in their expected overall good to excellent growing year.
Read Full Story »»»
DiscoverGold
Commodity price changes over last yr
By: Charlie Bilello | April 11, 2024
• Commodity price changes over last yr
Cocoa: +245%
Gold: +17%
Coffee: +16%
Silver: +13%
WTI Crude: +8%
Copper: +8%
Brent Crude: +7%
Aluminum: +6%
US CPI: +3.5%
Cotton: +3%
Heating Oil: +1%
Zinc: -2%
Gasoline: -2%
Sugar: -9%
Natural Gas: -13%
Wheat: -18%
Soybeans: -22%
Corn: -34%
Read Full Story »»»
DiscoverGold
Weighty Decisions. The Energy Report
By: Phil Flynn | April 11, 2024
Global oil markets must decide whether they are more worried about inflation or global conflict. Oil prices fluctuated on the prospect of a widening war with new potential battlefronts in the Middle East, the ongoing war between Russia and Ukraine and surging inflation that could delay or indefinitely postpone interest rate cuts. monitoring amid ongoing uncertainties to ensure a sound and sustainable oil market balance they also are keeping their demand growth forecast for 2024 at a very impressive 2.25 million barrels a day, The stakes are getting higher every day with lives, and sacred fortunes on the line.
The Consumer Price Index was a blow to those sacred fortunes and those trying to live paycheck to paycheck or those migrant debit cards. The consumer-price index, a measure of goods and services prices across the economy, rose 3.5% in March from a year earlier, the Labor Department said Wednesday. That was a touch higher than economists had forecasted and a pickup from February’s 3.2%. The so-called core prices, which exclude volatile food and energy categories, also rose more than expected on a monthly and annual basis according to the Wall Street Journal.
That hot inflation report took the odds of a June rate cut from better than 50% down to the low 20s. The reason for this hot inflation number is very simply corporate greed. How do I know that? Very Simply, Joe Biden said so. Biden urged, “corporations including grocery retailers to use record profits to reduce prices.” As corporations should know that they should be beholden to the Biden administration and not their shareholders. That is why he wants to tax them more so he can use that money to win favor with a student who can’t or refuse to pay back their loans or others that he thinks might vote democrat. So, don’t you listen to all the economists who try to tell you that inflation is caused by the government printing too much money or running up massive historic debt levels because Biden knows better? It seems that based on when Biden got elected it brought in a new era of greed! When President Trump was in office, corporations were not greedy because inflation was at historically low levels.
Of course, you can whine about not having enough money to buy groceries or fill your gas tank or weighty decisions about what you have to put back on the shelf that was in your grocery cart but that is because you don’t understand how good you have it under Biden. Remember he called out those companies that makes your potato chip bag smaller. Maybe that’ll make your waistline shrink a little too! So, to think you’re not better off just because your monthly bills are well above your wage increases, it is just because you have been psychologically damaged. Most likely due to climate change fears. And we all know that was President Donald Trump’s fault.
Even after the hot inflation number, oil tried to hold its ground even with an Energy Information Administration (EIA) report that was bearish on the surface. Yet thoughts about inflation or the volatility of the Weekly EIA were put aside on reports that an attack on Israel by Iranian proxies was imminent according to the United States. Reuters wrote that, “Oil prices settled up $1 on Wednesday after three sons of a Hamas leader were killed in an Israeli airstrike in the Gaza Strip, feeding worries that ceasefire talks might stall.”
The market had other concerns as to whether or not the United States would back Israel in a confrontation with Iran. Some people are suggesting that the Biden administration is emboldening Iran because there is this perception that the United States will not stand with Israel if Iran attacks. The flip side of that is the Biden administration seems to be walking a fine line between saying that they will defend Israel but at the same time trying to appease their base suggesting that they might not if they don’t approve a ceasefire in the Gaza Strip.
Israeli Prime Minister Netanyahu is saying that, “we are preparing for scenarios and challenges from other fields in other words getting ready to fight a war on many fronts. This comes as the Iranian Revolutionary Guard is bragging that they could shut down the Strait of Hormuz, the world’s most important oil chokepoint. This comes as Iranian-backed Houthi rebels are already causing havoc in the Red Sea transit routes. The attempt to shut these oil flows down could lead to an incredible price spike.
While the global oil price spreads are pricing in a very undersupplied market, the EIA is giving us a little reprieve in a weekly report that may be exaggerated due to the Easter Holiday. The EIA reported that oil supplies increased by a surprising 6.4 million barrels as U.S. oil exports plummeted to 2,708 million barrels a day from 4,022 million barrels a day in the holiday-shortened week. Week-over-week drops and demand was likely impacted by the holiday. Total Petroleum demand fell from 9,236 million barrels a day to 21,292 million barrels a day a drop of 2,056 Million barrels a day
Now overnight oil prices are pulling back as well as products as the imminent talk of a threat of an attack haven’t happened just yet. Traders may also be booking profits ahead of the producer price index which if it comes in hotter like the CPI did, it could cause the dollar to rally and put downward pressure on prices. I guess we have to wait to see how greedy corporate America is gonna be this week.
Today we get the natural gas inventories we’re looking for a small injection in the supply of about 11 to 14 BCF. The market does look like it’s trying to bottom here and it still is facing some incredible headwinds but production is starting to taper off.
Read Full Story »»»
DiscoverGold
Natural Gas Hits New Trend High and Pulls Back
By: Bruce Powers | April 10, 2024
• Natural gas triggered a new trend high today but could got turned around after encountering resistance at 1.94.
Natural gas continued its advance on Wednesday with a new minor trend high of 1.94. Although Tuesday’s closing price relative to the day’s range was not particularly strong, it did manage to close at its highest daily closing price in 23 trading days. Today’s advance was hit with selling pressure once the 1.94 high was reached. At the time of this writing natural gas is trading near the lows of the day and set to close relatively weak, in the lower quarter of the day’s range.
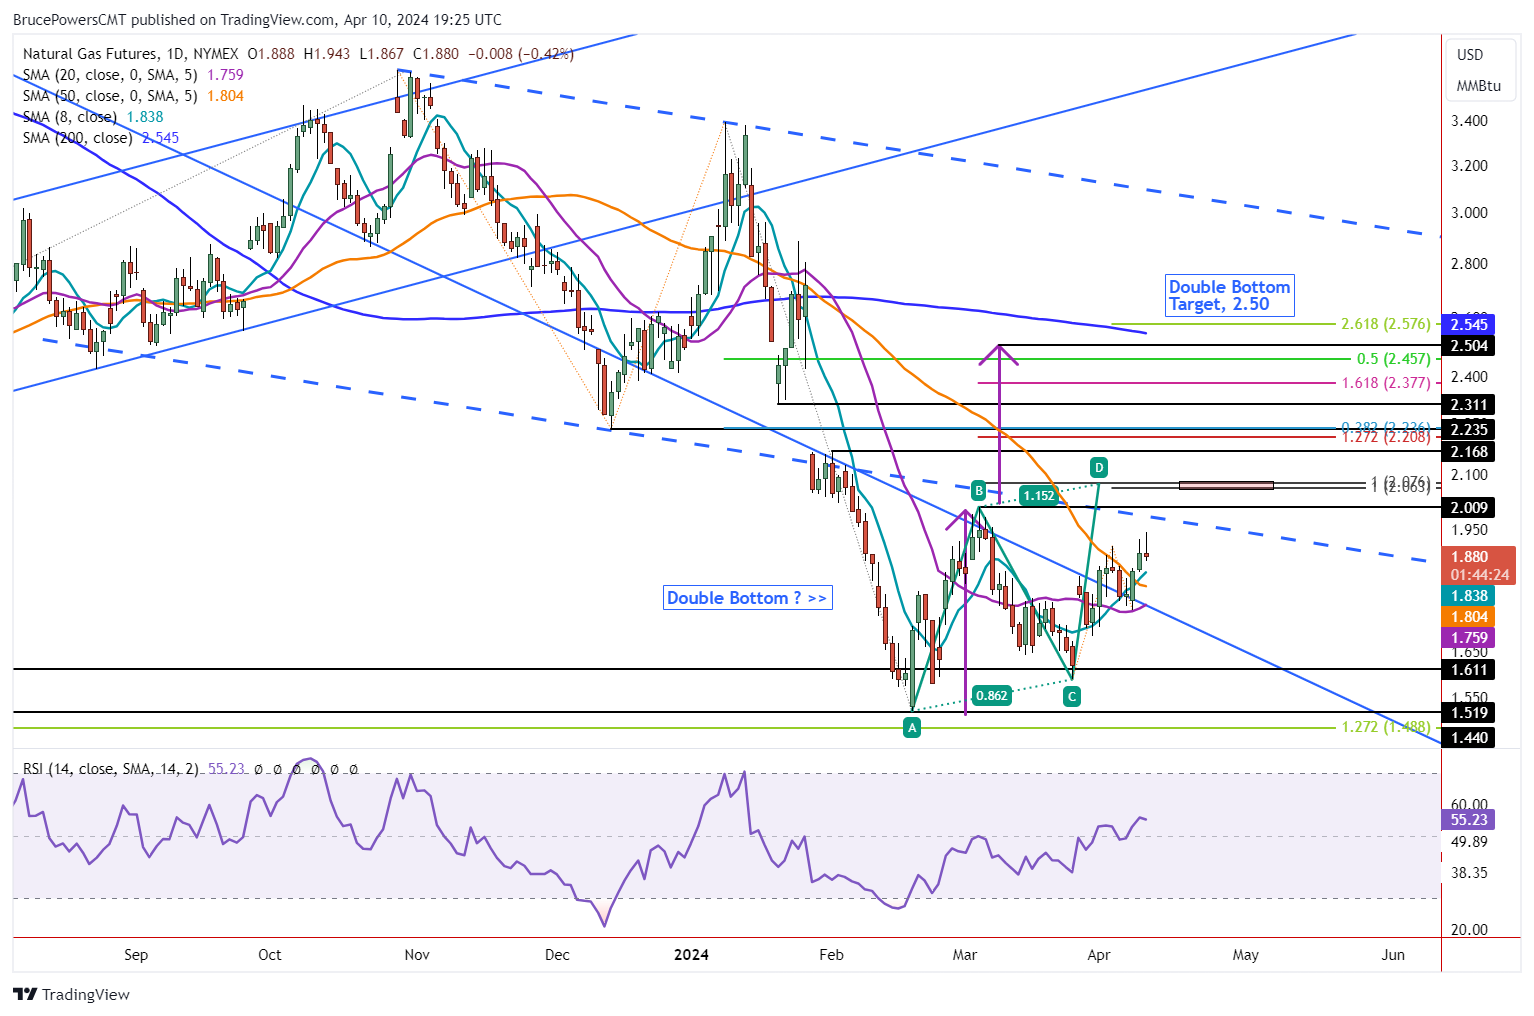
New Bullish Indications
Nonetheless, there are recent bullish indications showing underlying strength in the price of natural gas. The blue 8-Day MA has crossed up above the orange 50-Day and prior peak of the current short-term uptrend was exceeded yesterday. In addition, natural gas is holding above the 50-Day MA and above the long-term downtrend line. Support around the 50-Day line, currently at 1.80, should maintain support during weakness for recent bullish indications to remain valid.
Support Levels
The downtrend line can be priced currently because it has converged with the purple 20-Day moving average, now at 1.76. That is a more critical price area where support should be seen for the near-term bullish outlook to be retained. Given the potential for a weak close today, there is a possibility a pullback towards support may have already begone. However, it seems likely that it should be short lived if the growing bullish sentiment is to remain in charge.
Buyers Back in Charge Above 1.94
Further strength is signaled on a breakout above today’s high of 1.94. There is an initial target zone highlighted on the chart from 2.06 to 2.08. That price zone marks the completion of two rising ABCD patterns. The larger pattern is shown in green and labeled, while the smaller pattern is not labeled and starts from the most recent swing low at (C). Having such a fractal relationship between the two pieces of the developing uptrend should increase the chance for the targets to be reached. Also, a breakout above that price zone should also be met with enthusiasm from buyers.
Read Full Story »»»
DiscoverGold
Some commodity indices are up over 15% from their Q4 lows, too, suggesting that the inflation story is far from over.
By: Markets & Mayhem | April 10, 2024
• Some commodity indices are up over 15% from their Q4 lows, too, suggesting that the inflation story is far from over.
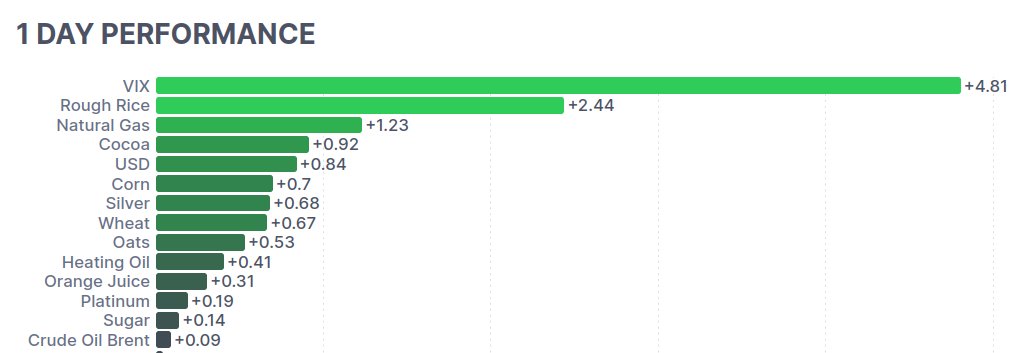
Read Full Story »»»
DiscoverGold
Agriculture Master Report
By: Bill Moore | April 10, 2024
JULY CORN
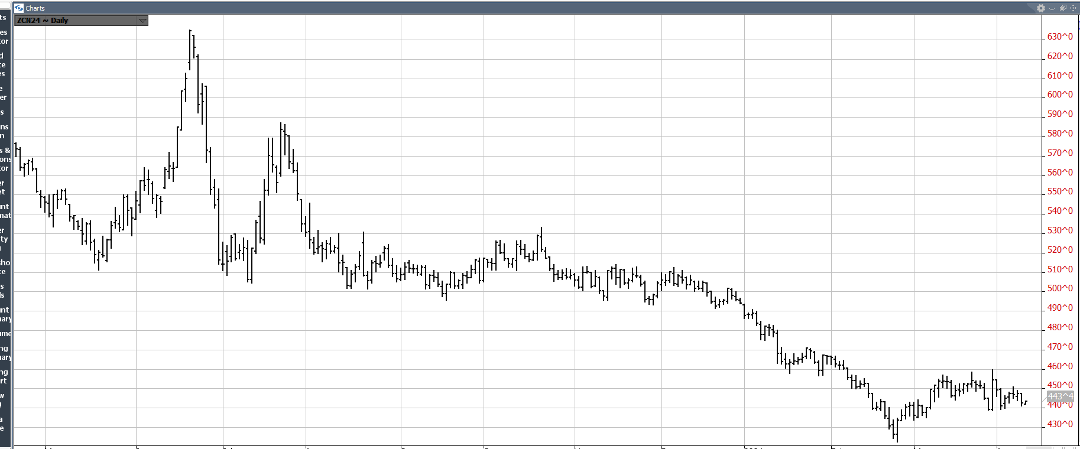
As is evident from the above chart, May Corn has been confined to a 30 cent range (420-450) since Mar 1! The friendly news such as the 3-28-24 Stocks/Seeding Report with an acres estimate 4.6 million acres less than 2023 & positive weekly export inspections & sales push the mkt up towards the top end & negative news such as planting pressure & rains for the dry areas pressure the mkt down to the 420 support! This week is another with sparse fresh news – as the mkt anticipates the onset of active planting after mid-April & the USDA April WASDE REPORT due out at 11am on Thur 4-11-24! Until then, the mkt will continue to chop around as traders “even up” in front of the report!
JULY BEANS
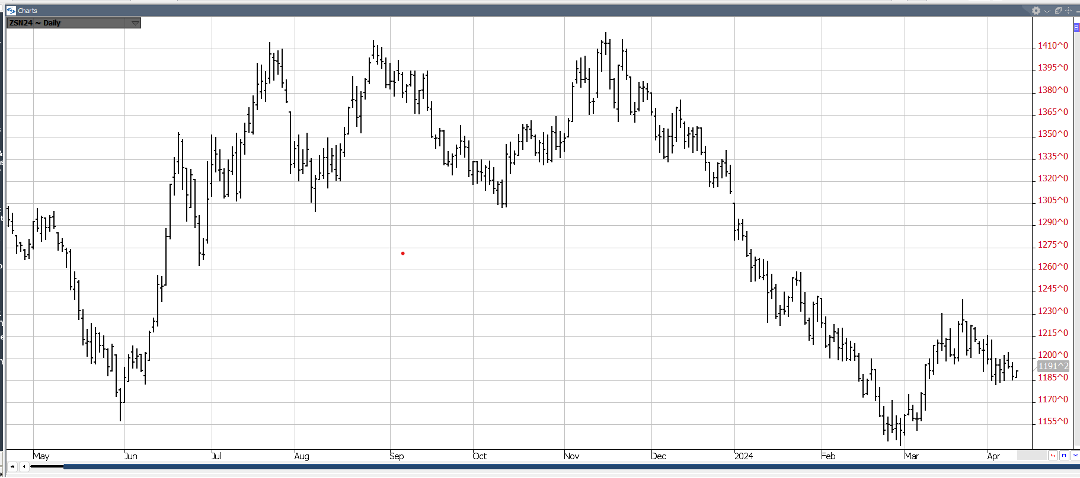
July Beans – much like its sister mkt July Corn – is range-bound (1185-1230) amid lackluster trade – as the mkt awaits updates from the USDA & CONAD on Thursday morning! Planting weather has been benign but some areas have been subject to flooding! Most producers seed corn first – with the wheels expected to roll in the 2nd half of April! Export interest has been meager but has been offset by strong domestic biodiesel demand! The fund short position is still sizeable – & the mkt is nearly $3.00 off its 2023 highs – so there is little margin for error for the US crops this Summer & Fall! South American production continues to ratchet down!
JULY WHT
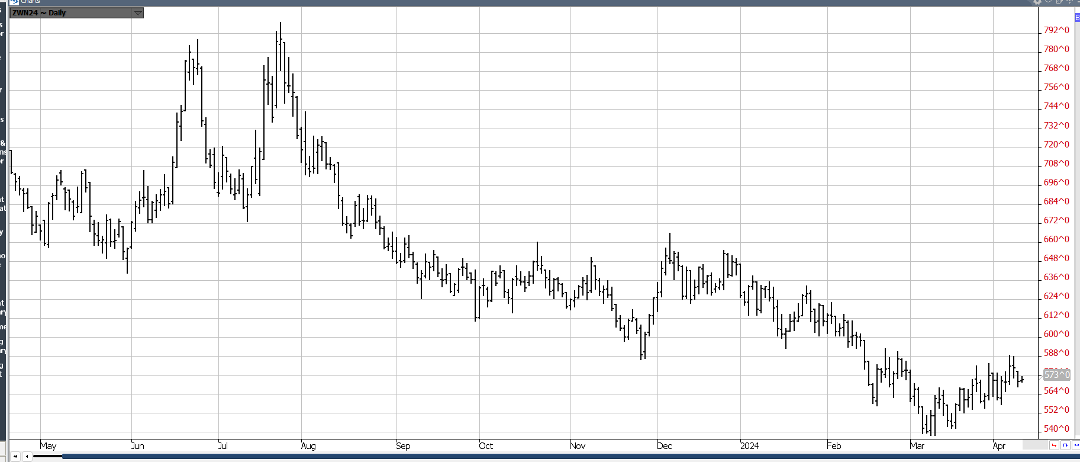
July Wht has been slowly grinding higher since early Mar – occasionally buoyed by geopolitical issues from the escalating Russian-Ukraine War & dryness in the US Southwest plains! However, sluggish exports running 11% under 2023 & a 56% Gd-Ex crop rating has kept the wraps on recent rallies! Spring Wht planting is 3% in! Just like corn & beans, wht anxiously awaits the USDA’s April WASDE on Thur at 11am!
JUNE CAT
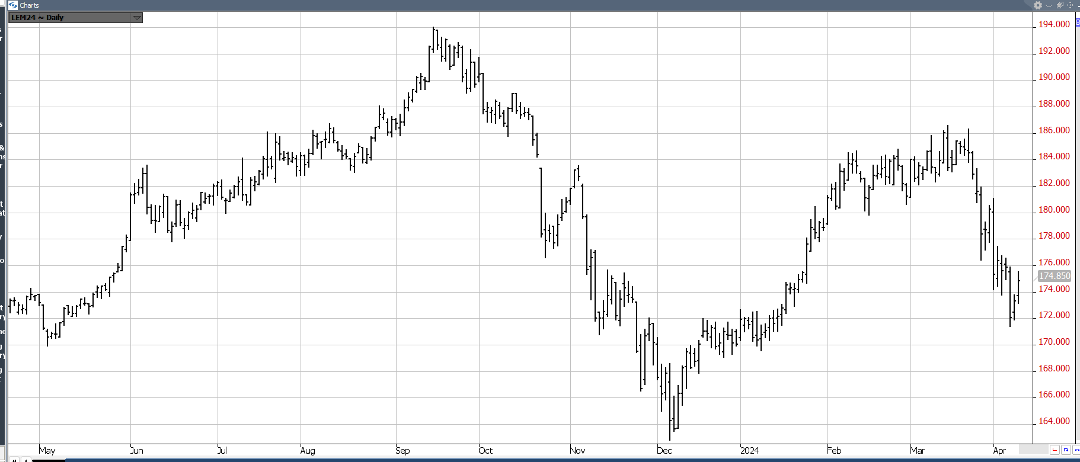
June Cattle topped out in late March – breaking $14 (186-172) due to a convergence of negatives including higher weights & slaughters, demand drying up in response to elevated prices, a bearish March Cattle-on-Feed Report – reflecting 10% more placements & finally the occurrence of Bird Flu in some dairy cattle prompting demand fears! As often happens, the break was overdone – especially as the Bird Flu news waned & the mkt recovered $5 of the plummet! The onset of the “grilling season” – the meats best demand period – will help stabilize June Cattle & cause them to consolidate well off their recent lows!
JUNE HOGS
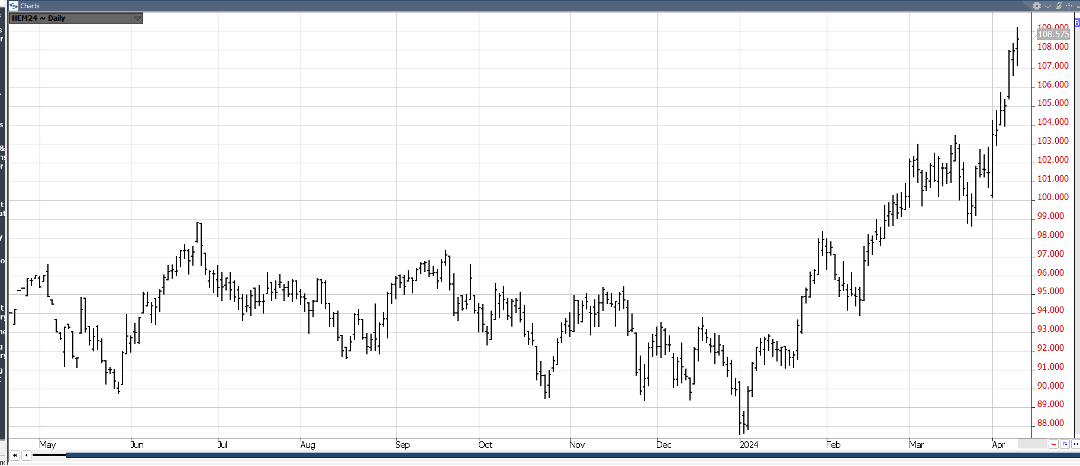
June Hogs unabashedly took over the “upside leadership role” in the meats by staging a remarkable, meteoric $9 rally (100-109) since Mar 1 – including 7 consecutive higher closes! The move was spawned by several positives – a bullishly construed Pig Crop Report on Mar 28 where Farrowing Intentions implied lower supplies, a bird flu epidemic which transferred some demand from suspect beef to much cheaper pork & finally the advent of the best demand season of the year – when everyone pulls out their grills! However, the mkt has rallied into “overbought territory” -accumulating a big premium to cash – & is due for a correction soon!
Read Full Story »»»
DiscoverGold
War Torn Super Cycle. The Energy Report
By: Phil Flynn | April 10, 2024
The Commodity Supercycle that seemed dormant late last year has awakened, incredibly. While many thought that the cycle had passed, it is clear now that price respite was just the eye of the commodity prices super cycle hurricane. The historic record-breaking price surge that we have seen in cocoa may be a preview of what we may see in other commodities where it appears demand will outstrip supply. Commodities like copper, silver, platinum, palladium, and of course the world’s black gold, oil that Texas tea, are headed for supply squeezes unlike anything we have seen since the 1970s and it did not happen overnight. It happened while the world was sleeping.
Underinvestment in fossil fuels as well as a hostile regulatory environment, means global oil supplies are going to be short. Even the Energy Information Administration in their recent short-term energy outlook not only had to raise the oil prices but also had to adjust their downward projections of future demand in an attempt to perhaps justify their previous massive adjustments to their numbers. In other words, the EIA had to raise their demand forecasts before they could lower it. The EIA raised their forecast of WTI crude prices to average $83.78/ barrel(bbl) in 2024, versus an earlier forecast of $82.15/bbl. The EIA also raised its Brent Crude prices to an average of $86.98/bbl in 2025, versus an earlier forecast of $84.80/bbl. Yet it was demand where they had to raise the river instead of lowering the bridge to make their forecast jive.
Or as the EIA put it, “This month we revised the 2022 global liquid fuels consumption data available in our International Energy Statistics, increasing our assessment of global oil consumption that year by nearly 0.8 million barrels per day (b/d) compared to last month’s STEO. The historical data serves as a baseline for our short-term forecasts, affecting our view of energy markets this year and next. This month’s revision to historic data, as well as current market dynamics, led us to increase our forecasts for global oil consumption.” Yet if you want to be confused, then they go on to say that after the adjustment the EIA cuts forecast for 2024 world oil demand growth by 480,000 bpd, now sees 0.95 mln bpd year-on-year increase. And cuts forecast for 2025 world oil demand growth by 30,000 bpd, now sees 1.35 mln bpd year on year increase.” Are they trying to hide their meaning here?
What they won’t be able to hide is rising gasoline prices. The EIA raised its forecast for retail gasoline prices in 2024 to $3.59 a gallon, versus an earlier forecast of $3.48 a gallon.
Yesterday the market was reluctant to move higher as it tried to digest headlines surrounding geopolitical risk that could have major implications for the price of oil and the potential movement for oil. Last week oil put in a lot of risk premium on the expectations that Iran would respond directly against Israel after the attack on its compound in Lebanon. Yesterday there was an unconfirmed report that an Iranian envoy was en route to the United States for some talks to avoid a conflict and made the rounds even though the story wasn’t confirmed.
Another headline that took out some more premium was the report that the US Defense Secretary heard from Israel that there is no set date for its invasion of Rafah, raising hopes that there could be some hope for a ceasefire even if a ceasefire talks broke down. That was after Prime Minister Benjamin Netanyahu said Monday that he has set a date for the IDF to launch its much-anticipated offensive in the southern Gaza city of Rafah. All of this is happening and swaying the market.
Now the American Petroleum Institute (API)report seemed to suggest that supplies from the seasonal viewpoint are very tight but based on weekly numbers are less than inspiring to the bullish side of the market.
The API reported the crude supplies increased by 3.034 million barrels which was more than the market had anticipated but from a seasonal viewpoint smaller than most builds at this time of year. Gasoline inventories fell by 609,000 barrels and distillates rose by 120,000 barrels which wasn’t that inspiring to either the bulls or the bear. The products have been under pressure. This week’s report, if confirmed today by the Energy Information Administration report, could give us the bottom for the products.
Yet what may be important to the oil and product traders today will be the consumer price index. The market fixation on whether or not the Federal Reserve is going to have the ability to cut interest rates as inflation continues to be strong is the question on most traders minds. The key thing here is that even if the Federal Reserve has to backtrack on a rate cutting, the reality is it won’t impact oil demand quickly enough to save the market from a supply squeeze.
What we expect is that oil will react to a hot or cold report in the long run. It’ll be the supply deficit that will keep support under this market. Remember all that talk about peak oil supply and then the switch over to peak oil demand? Well apparently in the big picture neither one of those predictions is correct. There is a new report by Enverus Intelligence Research that expects global oil demand will grow by 108 million barrels a day by 2030 and will not see peak demand at the end of the decade. The quiet little secret known by many people in the oil industry is simply this: the predictions of peak oil demand were greatly exaggerated.
Speaking about being greatly exaggerated, did you know that Treasury Secretary Janet Yellen is trying to tell people that she believes that the Russian price caps worked? I’m not kidding you. My good friend and noted oil analyst Anas Alhajji said, “Yellen’s price caps on Russian oil are a joke and have no impact. Attacks on Russian refineries meant more crude to export. Here is what Argus wrote today: “Russian crude production rose by 30,000 b/d to 9.44mn b/d, just 10,000 b/d shy of its target. Drone attacks have damaged over 800,000 b/d of Russian refining capacity in recent months, freeing up more crude for export — shipments hit an 11-month high in March.” Take that, Vladimir. Now let’s talk about those so-called sanctions on Iran that have given them billions of dollars. Never mind…I am running out of time.
Let’s move on to natural gas quickly. Reports that Freeport is going to get back online a month earlier than expected and more capacity coming online for LNG exports is giving us a ray of hope that maybe the bottom is in for natural gas. What’s interesting to note is the Energy Information Administration pointed out that for the first time in history, the cost of natural gas is lower than coal. This should be incredible news for people who are concerned about greenhouse gas emissions. The United States is the biggest producer of natural gas and we can change the world by providing cheap natural gas to replace coal plants thereby reducing greenhouse gas emissions. Incredibly this comes even as the Biden administration plays politics with projects surrounding LNG exports.
In yesterday’s Short-Term Energy Outlook, the EIA reported that, “The U.S. winter natural gas withdrawal season ended with 39% more natural gas in storage compared with the five-year average. From April through October this year, EIA forecast less natural gas will be injected into storage than is typical, largely because we expect the United States will produce less natural gas on average in 2Q24 and 3Q24 compared with 1Q24. Despite lower production, EIA still expects the United States will have the most natural gas in storage on record when the winter withdrawal season begins in November. As a result of high inventories, we expect the Henry Hub spot price to average less than $2.00 per million British thermal units (MMBtu) in 2Q24 before increasing slightly in 3Q24. EIA forecast for all of 2024 averages about $2.20/MMBtu.
Read Full Story »»»
DiscoverGold
The Corn & Ethanol Report
By: Daniel Flynn | April 10, 2024
We kickoff the day with MBA 30-Year Mortgage Rate, MBA Mortgage Applications, MBA Mortgage Market Index, MBA Mortgage Refinance Index, and MBA Purchase Index at 6:00 A.M., Core Inflation Rate MoM & YoY, Inflation Rate MoM & YoY, CPI, and CPI sa at 7:30 A.M., Fed Bowman Speech at 7:45 A.M., Wholesale Inventories at 9:00 A.M., API Energy Stocks at 9:30 A.M., 17-Week Bill Auction at 10:30 A.M., Fed Goolsbee Speech at 11:45 A.M., 10-Year Note Auction at 12:00 P.M., FOMC Minutes and Monthly Budget Statement at 1:00 P.M., and Dairy Products Sales at 2:00 P.M.
Welcome to the 1st day of 2024, when most Midwest farmers can seed corn under the revenue insurance rules. April 10th is often is the 1st day of spring in which wide spread Midwest corn seeding can commence – and weather and soil moisture permitting, from this day forward Midwest farmers will become more active in seeding spring crops. USDA, Brazil CONAB and WASDE will release their April crop estimates tomorrow. Garnering keen attention will be the size of the ’24 Brazilian corn/soybean crops. In March there was an 8.2 MMT’s spread between CONAB and WASDE soybean crop estimates which has a sizable impact on 2-24/25 US soybean export forecasts. It’s the direction of the WASDE Brazilian soybean/corn estimates which key the post report reaction tomorrow. Choppy grain action has prevailed since late February when longer term market lows were scored. Brazil has harvested more than 80% of its soybean crop while world wheat prices are turning upwards. The April USDA reports are unlikely to end the bull & bear debate on South American crop sizes. However, Brazilian soybean fob offers at Paranaqua are rising and positive through August at $.40/Bu over. A year ago, for May shipment Paranaqua soybeans were offered at $1.45 under today’s $.05 over – a big $1.50/Bu difference! As I mentioned before, I expect choppy trade as the bulls & bears duke it out with managed funds reshuffling their large net short position.
Read Full Story »»»
DiscoverGold
Natural Gas Moving Average Breakout Improves Bullish Outlook
By: Bruce Powers | April 9, 2024
• Natural gas showed strength by closing above its 50-Day MA, signaling potential demand increase.
Natural gas closed above its 50-Day MA for the first time since mid-January on Monday. That is a sign of strength that should see demand increase in the coming days. A teaser occurred today as natural gas rallied above the recent 1.91 minor swing high before encountering resistance at the day’s high of 1.92. An intraday selloff followed back to the lows of the day. Where it closes relative to the day’s range should provide a clue as to current sentiment.
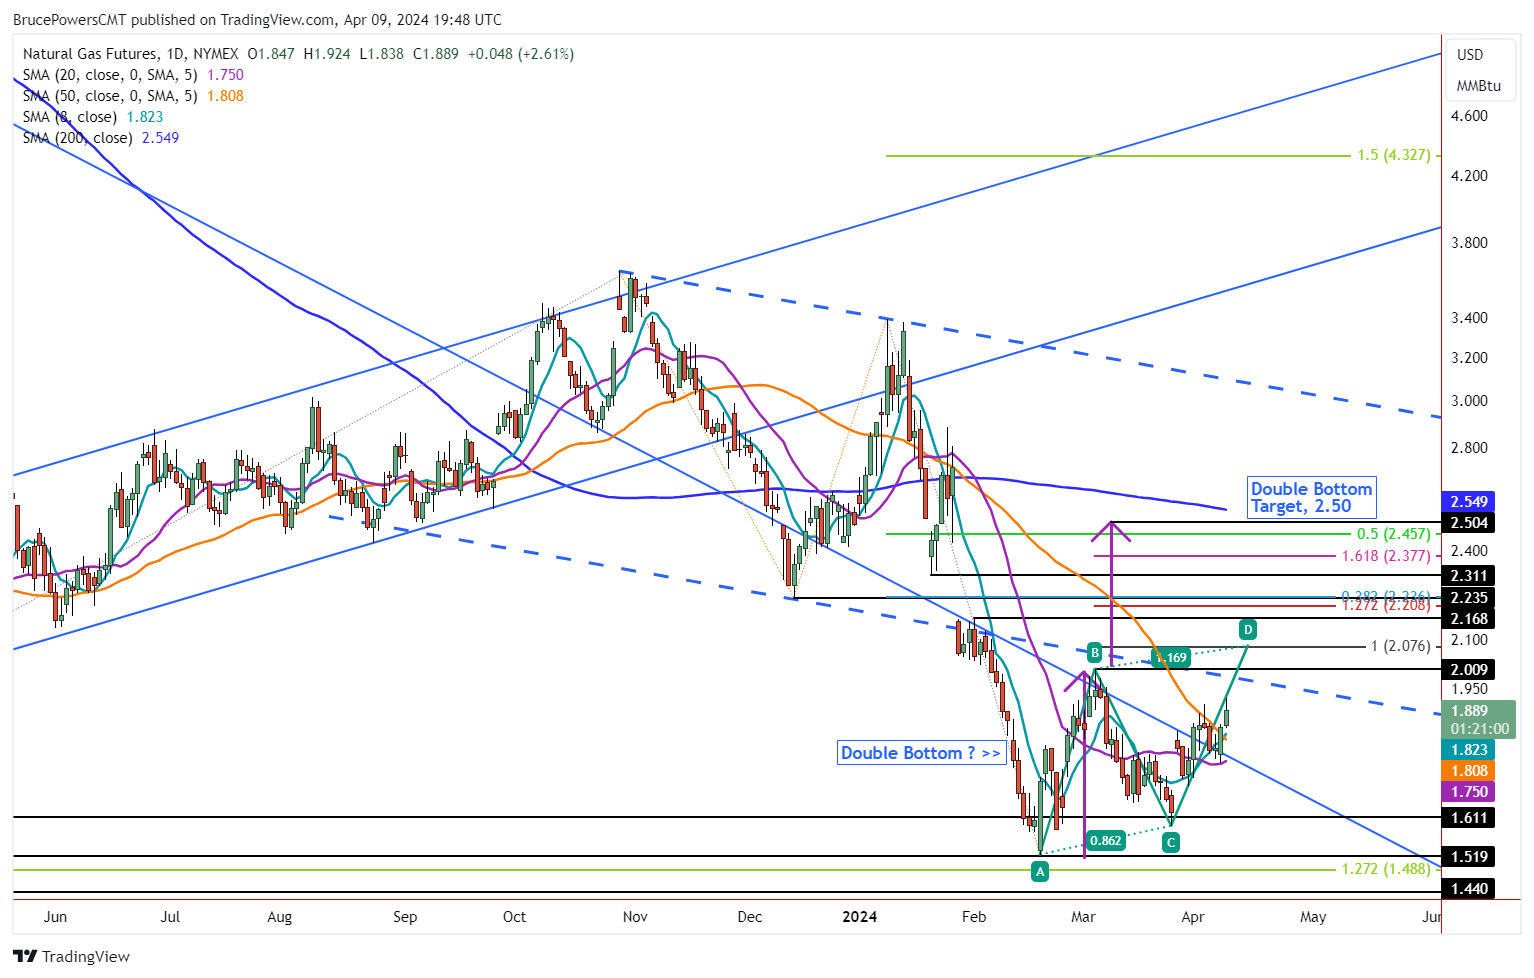
Advance Continues Following 50-Day MA Breakout
There was minor confirmation of strength since the breakout above the 50-Day MA, as the 8-Day MA crossed above the 50-Day today for the first time since mid-January, today. Also, yesterday the 20-Day MA was successfully tested as support for the first time since the price of natural gas rallied back above the 20-Day line on April 1.
That cleared the way for further strengthening, which we saw yesterday and then again today. What happens next will be key though as a failed breakout is always possible. A second daily close above the 50-Day line today would dampen that possibility. Then, we need to see signs of further strengthening if natural gas is going to have a chance at reaching higher targets.
Potential Double Bottom Setup
A rally above the 2.01 (B) swing high will trigger a breakout of a double bottom bullish reversal pattern and a continuation of the current developing uptrend. At that point there would be a higher swing high that would follow the recent higher swing low (C). The first identified target from current levels is the completion of a small rising ABCD pattern at 2.08.
At that price the CD leg of the advance will match the price appreciation seen in the first leg up, marked A to B. Once there is price symmetry a potential resistance zone has been reached. There are also interim price targets on the way up to the double bottom target of 2.50.
Higher Targets
The consolidation high following the large gap down in late-January is at 2.17. However, the more notable 38.2% Fibonacci retracement level is at 2.24. That price level takes on a somewhat greater significance since it is also match with prior support at the December swing low.
Read Full Story »»»
DiscoverGold
|
Followers
|
89
|
Posters
|
|
|
Posts (Today)
|
2
|
Posts (Total)
|
8775
|
|
Created
|
05/01/07
|
Type
|
Free
|
| Moderators DiscoverGold Pro-Life | |||
- The Commodity Bull is Running... Inflation is Running... Harder Living (i.e. FOOD, CLOTHING, SHELTER) is Dead Ahead... -
- Commodity Futures Trading -
http://finviz.com/futures_performance.ashx
Beneficial Educational Resources on Futures TradingThe futures market is volatile, and it cuts both ways. Leverage that makes it profitable can also ruin reckless, undisciplined traders overnight. Most brokers have paper trading available on their platforms, so those who are new to futures should take advantage and learn with these tools before going live with real money. Mitigate risk with stop loss orders at all times, and cut losses quickly instead of adding contracts and attempting to flip your way out of a losing position. Also, use mini instruments when available, with lower margin requirements, until you have sufficient capital to buy and sell more expensive contracts. Even though the potential is there, don't try to make too many profits at once. If things aren't going well, often times quitting for the day and collecting one's thoughts is the best decision. New opportunities come along daily. Markets are open nearly 24 hours, so set a schedule and stick to it. Avoid trading while tired or distracted, and please don't listen to the advice of others. Do research on fundamentals affecting markets as well as paying attention to TA. Watch key indices, and listen to accurate, real-time news during the session to stay aware of shifting trends. Trade smart, trade safely, and have fun.
Videos on Futureshttps://www.youtube.com/playlist?list=PL9A5C5A93D243CA44 Continuous Improvement in Progress |
Commodity Futures Trading
https://www.tdameritrade.com/investment-products/futures-trading.page
| Volume | |
| Day Range: | |
| Bid Price | |
| Ask Price | |
| Last Trade Time: |


