Natural Gas Hits New Trend High and Pulls Back By: Bruce Powers | April 10, 2024
• Natural gas triggered a new trend high today but could got turned around after encountering resistance at 1.94.
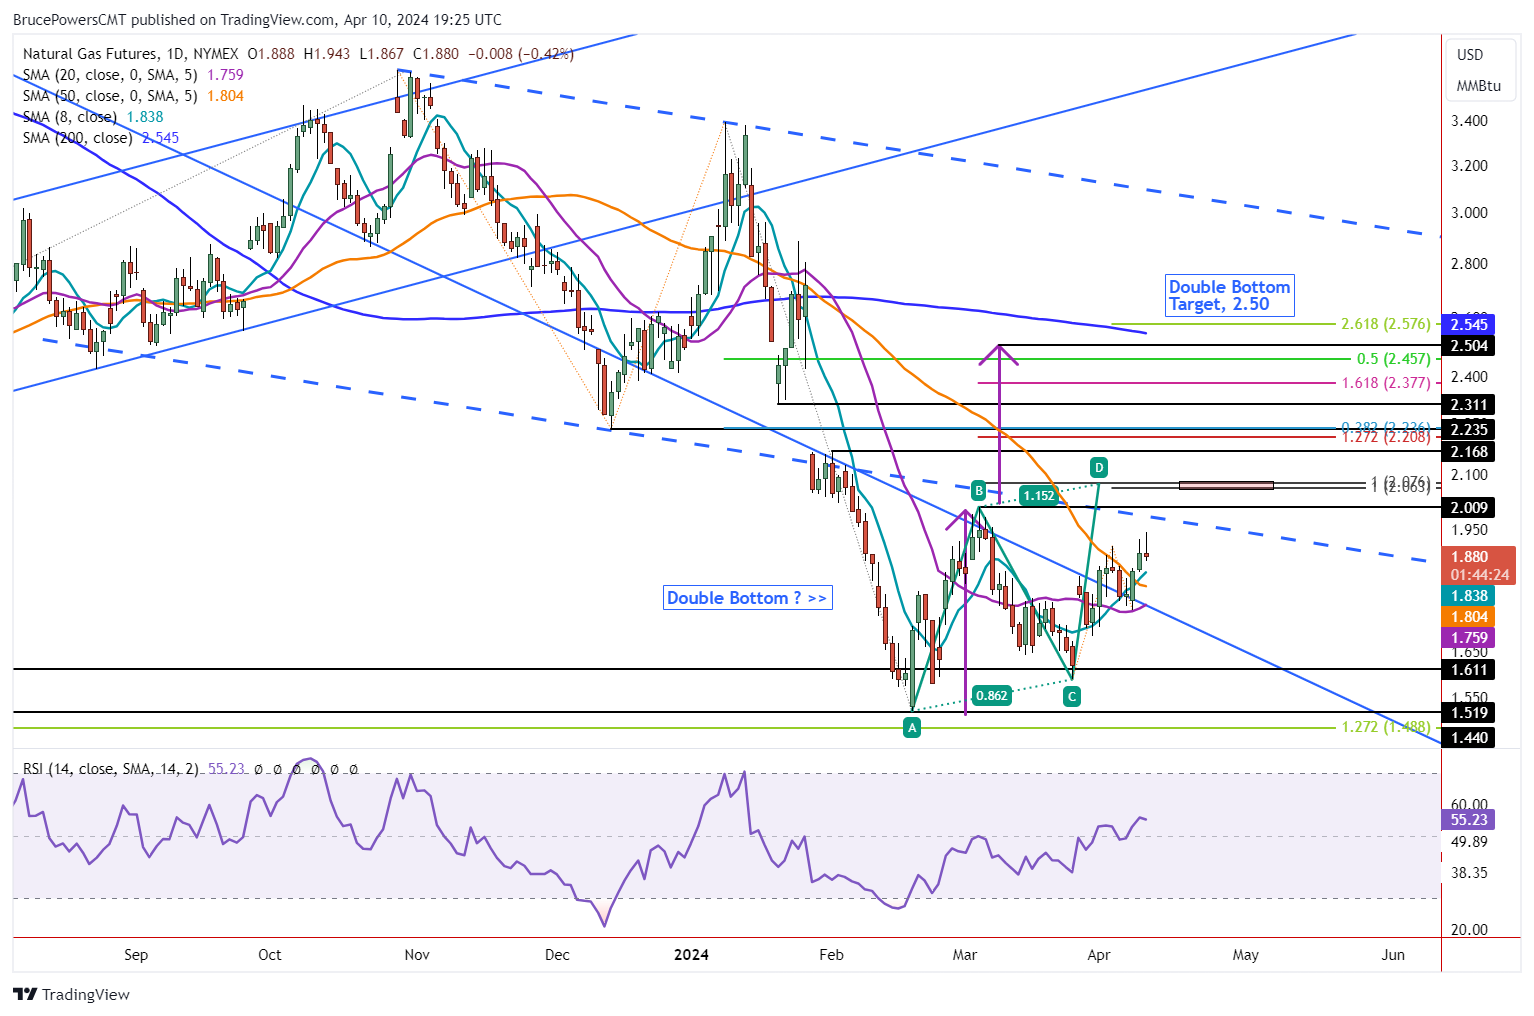
Natural gas continued its advance on Wednesday with a new minor trend high of 1.94. Although Tuesday’s closing price relative to the day’s range was not particularly strong, it did manage to close at its highest daily closing price in 23 trading days. Today’s advance was hit with selling pressure once the 1.94 high was reached. At the time of this writing natural gas is trading near the lows of the day and set to close relatively weak, in the lower quarter of the day’s range.
New Bullish Indications
Nonetheless, there are recent bullish indications showing underlying strength in the price of natural gas. The blue 8-Day MA has crossed up above the orange 50-Day and prior peak of the current short-term uptrend was exceeded yesterday. In addition, natural gas is holding above the 50-Day MA and above the long-term downtrend line. Support around the 50-Day line, currently at 1.80, should maintain support during weakness for recent bullish indications to remain valid.
Support Levels
The downtrend line can be priced currently because it has converged with the purple 20-Day moving average, now at 1.76. That is a more critical price area where support should be seen for the near-term bullish outlook to be retained. Given the potential for a weak close today, there is a possibility a pullback towards support may have already begone. However, it seems likely that it should be short lived if the growing bullish sentiment is to remain in charge.
Buyers Back in Charge Above 1.94
Further strength is signaled on a breakout above today’s high of 1.94. There is an initial target zone highlighted on the chart from 2.06 to 2.08. That price zone marks the completion of two rising ABCD patterns. The larger pattern is shown in green and labeled, while the smaller pattern is not labeled and starts from the most recent swing low at (C). Having such a fractal relationship between the two pieces of the developing uptrend should increase the chance for the targets to be reached. Also, a breakout above that price zone should also be met with enthusiasm from buyers.
Information posted to this board is not meant to suggest any specific action, but to point out the technical signs that can help our readers make their own specific decisions. Caveat emptor! • DiscoverGold
Register for free to join our community of investors and share your ideas. You will also get access to streaming quotes, interactive charts, trades, portfolio, live options flow and more tools.


 News
News  Market Data
  Discover