Natural Gas Will Support Hold or Breakdown Continue? By: Bruce Powers | April 25, 2024
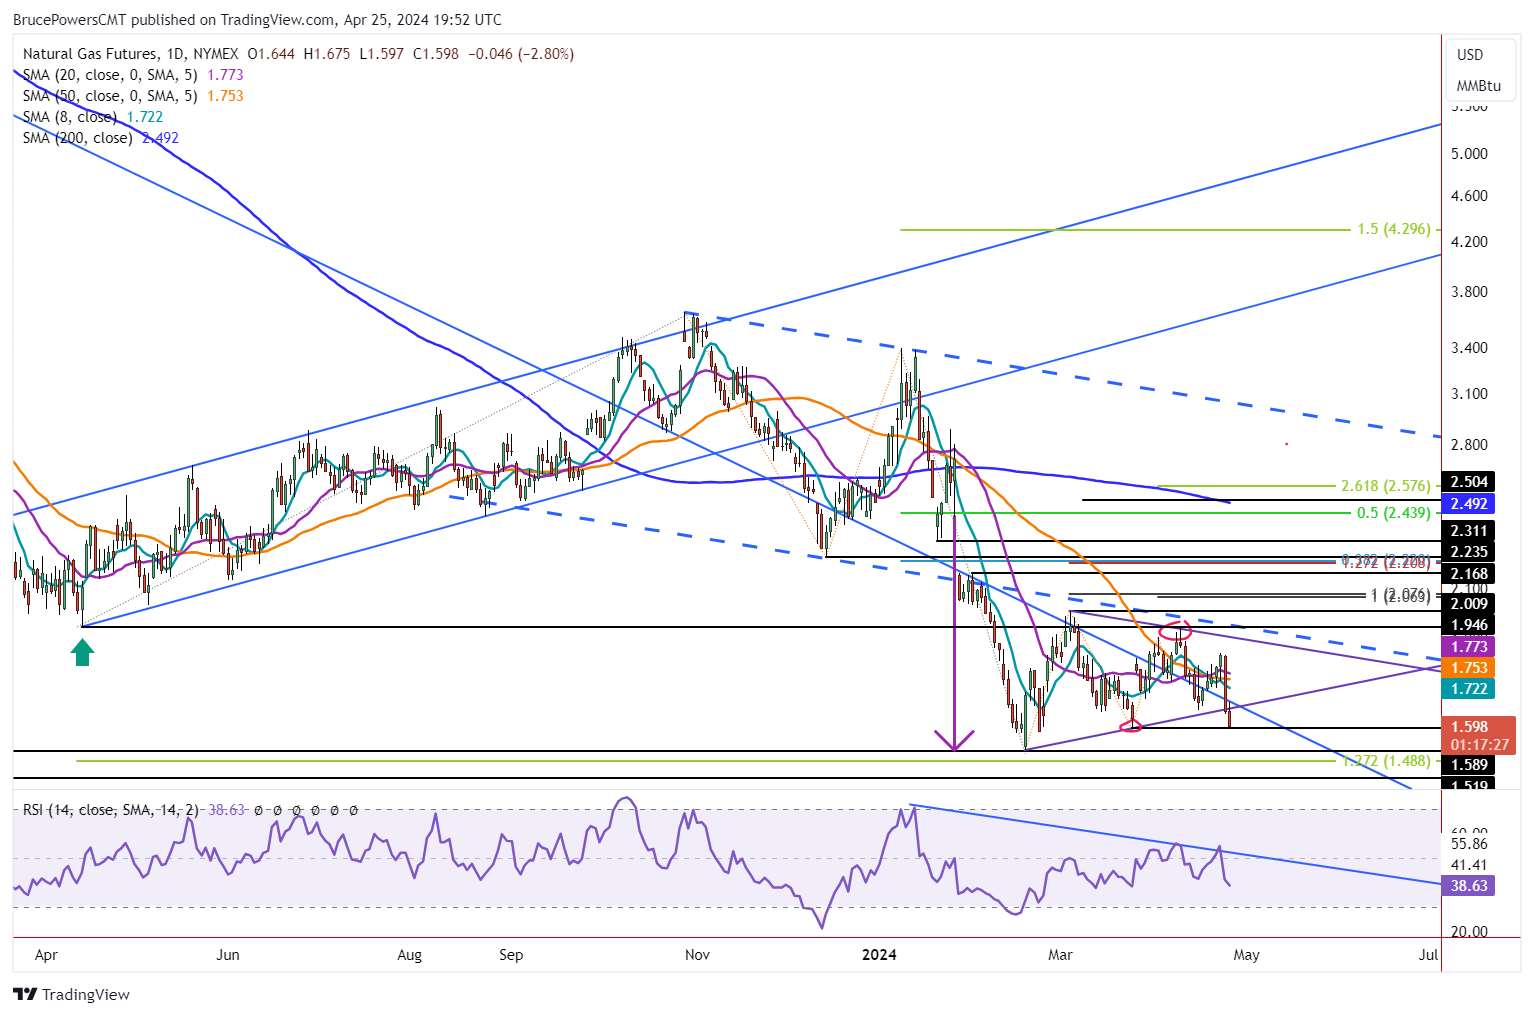
• Natural gas broke down from a symmetrical triangle, finding support at 1.60. Monthly support is at 1.59.
Natural gas breaks down from a symmetrical triangle on a drop below Wednesday’s low before finding support at 1.60 and bouncing. The high for the day was 1.675, which completed a test of resistance at the long-term downtrend line. Support is around the most recent swing low of 1.59. If broken to the downside and natural gas stays below it, lower prices may be coming.
Breakdown in Play
The trend low of 1.52 from February is a significant support level going back 29 years. Although a breakdown from consolidation has triggered, downside follow through is key. Will selling pressure accelerate or support hold and eventually turn prices higher? There are no signs of it yet, but this possibility remains. A bullish sign will next be indicated on a rally above today’s high (at time of this writing) of 1.675. The key near term resistance level of significant is this week’s high of 1.84. Once there is a daily close above that price level the possibility of an upside continuation improves.
Monthly Support May Continue to Hold
Monthly support is also at the 1.59 swing low. During April natural gas has remained within the range from March forming a possible second sequential inside month. Therefore, a sustained breakdown below 1.59, if it occurs before the end of the month, will trigger an inside month breakdown from March. That’s a bearish signal that could be followed by an expansion of volatility.
Strong Support at or Above 1.52 May Continue
As noted above, the 1.52 price level is significant and may continue to act as support. Consequently, if volatility expands there is a possibility the 1.52 level is broken. If that happens the next lower target is around 1.44, a 29-year low. However, there is another price area to watch at 1.49. That is the target from an extended retracement of the six-month rally that began from the prior trend low a year ago.
Contraction in Volatility
If April ends without a breakdown below last month’s low, there will be two inside months further highlighting the decline in volatility experienced recently. As price compresses it prepares for its next move and a pickup in volatility. That could come from a bounce off monthly support or a breakdown.
Information posted to this board is not meant to suggest any specific action, but to point out the technical signs that can help our readers make their own specific decisions. Caveat emptor! • DiscoverGold
Register for free to join our community of investors and share your ideas. You will also get access to streaming quotes, interactive charts, trades, portfolio, live options flow and more tools.


 News
News  Market Data
  Discover