Natural Gas Rebound Faces Resistance at Moving Average Zone By: Bruce Powers | April 18, 2024
• Trading in natural gas expected to be choppy, as volatility declines in the narrowing pennant.
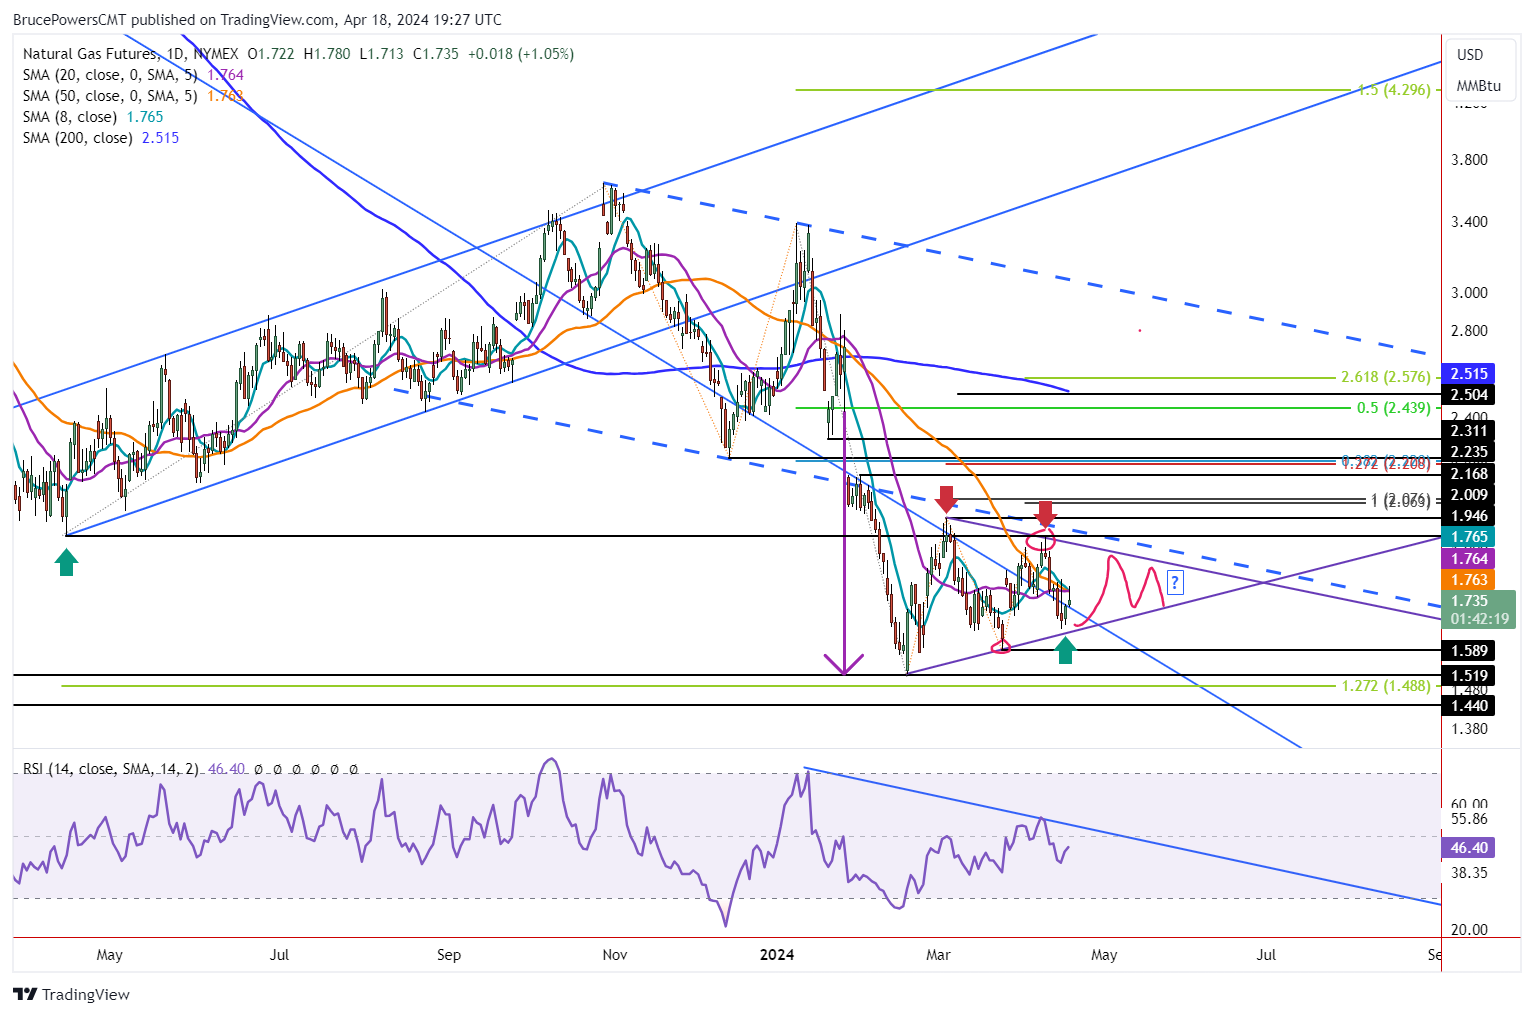
Natural gas bounces to test a moving average resistance zone with the day’s high of 1.78. Today’s advance (Thursday) broke out above the high of Wednesday, which was an inside day. Natural gas is on track to end the day above yesterday’s high of 1.72. However, it remains inside the wide trading range from Monday, and it is also within a developing bearish pennant consolidation pattern.
Signs of strength seen today may take the price of natural gas up to the top boundary line to test resistance. However, it is not clear whether Tuesday’s swing low will be the low of the swing until there is an advance above Monday’s high of 1.80.
Choppy Moves While in Consolidation
Until natural gas breaks out of the pennant consolidation pattern trading will likely be choppy and difficult to predict, as with any consolidation period. Volatility can be expected to decline as the pennant narrows the trading range as the apex of the triangle is approached.
Further, the three moving averages representing different time frames of 8-Day, 20-Day, and 50-Day have converged. This is another indication of low volatility. How natural gas behaves when testing the upper or lower boundary lines will provide clues as you whether a breakout to the upside or downside may occur.
Consolidation Could Continue for Weeks
The pattern is bearish since natural gas remains in a downtrend and there was a sharp decline prior to the formation of the pennant. Nevertheless, it is not determined until a breakout occurs. A breakout either up or down should occur before the apex is reached. This means that trading within the pennant could go on for as long as more seven weeks. Regardless, a breakout could occur at any time as the pennant is already well defined.
8-Week Moving Average Recaptured
It is interesting to note that there was a breakdown from last week’s bearish shooting star candlestick pattern (not shown) before this week’s low of 1.65 was reached, leading to a bounce. Also, the 8-Week MA, which had marked support for the last two weeks was broken to the downside. Today’s advance has recaptured the 8-Week MA, a sign of strength. Confirmation of strength will be provided on a daily close above the current price for the 8-Week MA at 1.75. Natural gas exceeded that level today.
Information posted to this board is not meant to suggest any specific action, but to point out the technical signs that can help our readers make their own specific decisions. Caveat emptor! • DiscoverGold
Register for free to join our community of investors and share your ideas. You will also get access to streaming quotes, interactive charts, trades, portfolio, live options flow and more tools.


 News
News  Market Data
  Discover