 News
News  Market Data
  Discover
Support: 888-992-3836
Copyright © 2023 InvestorsHub Inc.


Register for free to join our community of investors and share your ideas. You will also get access to streaming quotes, interactive charts, trades, portfolio, live options flow and more tools.
Softs Report: Cotton, OJ, Coffee, Sugar, Cocoa
By: Jack Scoville | April 9, 2024
• COTTON
General Comments: Cotton was mixed yesterday, with nearby prices a little higher and deferred months a little lower. Trends are still down on the daily and weekly charts on concerns about the planting intentions report released a week ago and despite improving ideas of demand potential from China. Demand has been weaker so far this year. USDA said that 10.7 on acres might get planted this year, from 10.2 million last year. It is too early to plant in Texas but the heat and dry weather raises concerns about production potential later in the growing season and blackened soils might not permit much planting, anyway. The demand news has been reduced from previous levels in this market for the last several weeks. The US economic data has been positive, but the Chinese economic data has not been real positive and demand concerns are still around. However, Chinese consumer demand has held together well, leading some to think that demand for Cotton in world markets will increase over time.
Overnight News: The Delta will get showers and rains and near normal temperatures. The Southeast will see showers and rains and near normal temperatures. Texas will have mostly dry conditions and near normal temperatures. USDA said that Cotton is now 5% planted, from 3% last week, 5% last year, and 6% average.
Chart Trends: Trends in Cotton are down with objectives of 86.00, 83.20, and 77.20 May. Support is at 86.10, 85.60, and 82.90 May, with resistance of 91.30, 92.90 and 94.30 May.
• FCOJ
General Comments: FCOJ closed lower yesterday and remains in a trading range. Reports of tight supplies are around. Florida said that Oranges production will be low, but above a year ago. Futures still appear to have topped out even with no real downtrend showing yet, so a range trade has been seen. Prices had been moving lower on the increased production potential for Florida and the US and in Brazil but is now holding as current supplies remain very tight amid only incremental relief for supplies is forecast for the coming new crop season. There are no weather concerns to speak of for Florida or for Brazil right now. The weather has improved in Brazil with some moderation in temperatures and increased rainfall amid reports of short supplies in Florida and Brazil are around but will start to disappear as the weather improves and the new crop gets harvested.
Overnight News: Florida should get scattered showers or dry conditions. Temperatures will average near normal. Brazil should get scattered showers and above normal temperatures.
Chart Trends: Trends in FCOJ are mixed. Support is at 350.00, 347.00, and 353.00 May, with resistance at 378.00, 389.00, and 391.00 May.
• COFFEE
General Comments: New York closed a little lower and London was mixed to higher and both show up trends on the daily and weekly charts. Trading was quiet. The lack of Robusta Coffee in the market continues to support futures. Robusta offers from Vietnam remain difficult to find and the lack of offer of Robusta is a bullish force behind the London market action. There were some indications that Vietnam producers were now offering a little Coffee, but not much and not nearly enough to satisfy demand. Vietnamese producers are reported to have about a quarter of the crop left to sell or less and reports indicate that Brazil producers are reluctant sellers for now after selling a lot earlier in the year. The next Robusta harvest in Brazil will start next month. Brazil weather continues to improve for Coffee production and conditions are called good.
Overnight News: The ICO daily average price is now 205.50 ct/lb. Brazil will get mostly scattered showers with near normal temperatures. Central America will get mostly dry conditions. Vietnam will see scattered showers
Chart Trends: Trends in New York are up with no objectives. Support is at 208.00, 201.00, and 195.00 May, and resistance is at 213.00, 216.00 and 219.00 May. Trends in London are up with no objectives. Support is at 3600, 3480, and 3360 May, with resistance at 3830, 3860, and 3890 May.
• SUGAR
General Comments: New York and London closed lower yesterday on ideas that the Brazil harvest can be strong for the next few weeks if not longer. Indian production estimates are creeping higher but are still reduced from recent years. There are worries about the Thai and Indian production. Offers from Brazil are still active but other origins. are still not offering in large amounts except for Ukraine. Ukraine offers have suffered lately with the war. Demand reports from Europe have been strong.
Overnight News: Brazil will get rains in the south and scattered showers in the north. Temperatures should average above normal. India will get mostly dry conditions and below normal temperatures.
Chart Trends: Trends in New York are mixed. Support is at 2150, 2080, and 2040 July and resistance is at 2220, 2250, and 2260 July. Trends in London are mixed. Support is at 613.00, 610.00, and 595.00 August, with resistance at 630.00, 636.00, and 647.00 August.
• COCOA
General Comments: New York was lower and London was higher yesterday and continued to consolidate the massive gains from the recent rally. A short term top is possible but far from guaranteed. Production concerns in West Africa as well as demand from nontraditional sources along with traditional buyers keep supporting futures. Production in West Africa could be reduced this year due to the extreme weather which included Harmattan conditions. The availability of Cocoa from West Africa remains very restricted and projections for another production deficit against demand for the coming year are increasing. Ideas of tight supplies remain based on more reports of reduced arrivals in Ivory Coast and Ghana continue. Ivory Coast arrivals are now 1,301 tons, down 26.7% from the previous year. Mid crop harvest is now underway and here are hopes for additional supplies for the market from the second harvest. Demand continues to be strong, especially from nontraditional buyers of Cocoa.
Overnight News: Isolated showers are forecast for West Africa. Temperatures will be near normal. Malaysia and Indonesia should see scattered showers. Temperatures should average near normal. Brazil will get isolated showers and above normal temperatures.
Chart Trends: Trends in New York are mixed. Support is at 9000, 8410, and 8730 May, with resistance at 10120, 10240, and 10360 May. Trends in London are mixed. Support is at 7500, 6860, and 6500 May, with resistance at 8690, 8840, and 8960 May.
Read Full Story »»»
 DiscoverGold
Grains Report: Wheat, Rice, Corn and Oats, Soybeans, Canola and Palm Oil
By: Jack Scoville | April 9, 2024
• WHEAT
General Comments: Wheat was a little higher in slow trading with little fresh news yesterday. Trends turned up in SRW but remain mixed in HRW and Spring The USDA reports released a week ago were considered friendly. USDA said that All Wheat plantings would be about 47.5 million acres, with the big reductions seen in Winter Wheat. In contrast, Spring Wheat plantings were above the trade guesses at 11.335 million acres. Inventories were just above the average trade guess and 1.083 billion bushels. The weekly condition report a week ago showed good conditions and the weekly export sales report was poor. The problems with Russian Wheat exporters continue. The dispute has held up shipments of at least 400,000 tons of grain so far. The reports indicate that the government is seeking more control of the exports and has made life very difficult on the private exporters in an effort to extract more sales and powers to the government. Russia is the worlds largest exporter and sets the world price and prices remain low. Big world supplies and low world prices are still around. Export sales remain weak on competition from Russia, Ukraine, and the EU as those countries look to export a lot of Wheat in the coming period. Black Sea offers are still plentiful.
Overnight News: The southern Great Plains should get Scattered showers. Temperatures should be below normal. Northern areas should see scattered showers. Temperatures will average below normal. The Canadian Prairies should see scattered showers. Temperatures should average below normal.
Chart Analysis: Trends in Chicago are up with objectives of 590 and 618 May. Support is at 560, 539, and 537 May, with resistance at 575, 580, and 584 May. Trends in Kansas City are mixed. Support is at 561, 552, and 546 May, with resistance at 595, 602, and 605 May. Trends in Minneapolis are mixed. Support is at 646, 640, and 634 May, and resistance is at 660, 677, and 681 May.
• RICE
General Comments: Rice closed mixed in quiet trading yesterday. Futures turned sideways after the big move lower. Trends are mixed in this market on the daily charts. The market noted good planting and emergence progress in the weekly USDA reports released on Monday afternoon. Good demand for exports continues. The overseas markets feature less production in Brazil and India, and it appears that the lack of offer from these markets is supporting increased demand for US Rice and prices here in the US. It turning drier and warmer in the US this week and fieldwork should become active.
Overnight News:
Chart Analysis: Trends are mixed. Support is at 1602, 1588, and 1576 May and resistance is at 1670, 1704, and 1751 May.
• CORN AND OATS
General Comments: Corn and Oats closed a little higher in quiet trading as traders think that good Spring weather here will greatly increase planted Corn area. This might not be true as it is very expensive to plant Corn and Corn is considered unprofitable to plant right now. USDA issued its first crop progress report for Corn early last week. The USDA reports released more than a week ago showed inventories and planting ideas below trade expectations. Demand for Corn has been strong at lower prices. Big supplies and reports of limited demand are still around, but futures have been very oversold. Funds remain very large shorts in the market.
Overnight News:
Chart Analysis: Trends in Corn are mixed. Support is at 426, 422, and 408 May, and resistance is at 448, 459, and 463 May. Trends in Oats are mixed. Support is at 328, 322, and 316 May, and resistance is at 349, 353, and 359 May.
• SOYBEANS
General Comments: Soybeans closed a little lower and Soybean Meal closed a little higher. Soybean Oil was lower. Brazil producers had been taking advantage on higher futures in the US and higher basis levels in Brazil, but the basis has fallen sharply in Brazil this week and sales have been less. Reports of great export demand in Brazil provide some support. Reports indicate that China has been a very active buyer of Brazil Soybeans this season. Ideas that South American production is taking demand from the US have pressured futures lower. Funds remain large shorts in the market. The US reports strong domestic demand.
Overnight News:
Chart Analysis: Trends in Soybeans are mixed. Support is at 1165, 1153, and 1140 May, and resistance is at 1207, 1211, and 1217 May. Trends in Soybean Meal are mixed. Support is at 323.00, 320.00, and 317.00 May, and resistance is at 340.00, 348.00, and 352.00 May. Trends in Soybean Oil are mixed. Support is at 4730, 4690, and 4640 May, with resistance at 4980, 5000, and 5030 May.
• CANOLA AND PALM OIL
General Comments: Palm Oil was lower yesterday on profit taking but found support from strong export data for the month from private sources. It was higher today n strong exports and rallies in the Crude Oil futures. The export pace is expected to continue to really improve but this is part of the price already, in part due to stronger world petroleum prices that have affected world vegetable oils prices as well. Domestic biofuels demand is likely to improve. Ideas of weaker production ideas against good demand still support the market overall. Trends are turning up on the daily charts. Canola was a little lower. There were reports of good growing conditions in Argentina. Current forecasts call for generally improved growing conditions in Brazil this week.
Overnight News:
Chart Analysis: Trends in Canola are mixed. Support is at 630.00, 616.00, and 610.00 May, with resistance at 645.00, 652.00, and 657.00 May. Trends in Palm Oil are up with objectives of 4460 and 4650 June. Support is at 4270, 4200, and 4130 May, with resistance at 4440, 4460, and 4490 May.
Midwest Weather Forecast Showers and storms. Temperatures should average below normal.
Read Full Story »»»
DiscoverGold
Control Freak Out. The Energy Report
By: Phil Flynn | April 9, 2024
Oil is on the rise as the headlines blast that the oil market is going to get extremely tight in the second half of the year and that OPEC has regained control of the oil market. These headlines are correct, and it is something we predicted would happen oh so long ago. These are predictions by Citadel and are being echoed by other people in the market who must face up to the fact that global demand is exceeding daily production and could by a wide margin by the end of the year. Vitol is predicting oil averages between $80 and $100 a barrel because of what they call a restrained market. The CEO of Vital, Russell Hardy, says that oil demand growth is expected to be at 1.9 mbpd this year. Also, Reuters is reporting that Mexico is cutting oil exports by at least 330,000 barrels per day in May.
Oil prices are surging after Hamas predictably rejected the terms of the ceasefire and Israeli Prime Minister Benjamin Netanyahu on Monday said Israel will be moving forward with a planned attack on the city of Rafah in the Gaza Strip. This comes as the Iranian foreign minister continues to blame the United States for approving Israel’s attack on its consulate in Syria. The attack that killed 2 Iranian generals may be a reason why Iran may still respond. Yet Iran has failed to do so, so far. Perhaps they are worried about sparking a direct conflict with Iran or the United States.
Global demand is exceeding supply as China’s manufacturing sector surges. Their domestic demand hit the highest level since pre-COVID. S&P Global reported overnight that China’s independent refineries ramped up feedstock imports by 13.3% on the month to a seven-month high of 17.4 million mt (127.54 million barrels) in March, the highest since August when it was at 18.23 million mt, S&P Global Commodity Insights data showed April 9.
The supply squeeze is on and the bearish arguments that we would not consume as much oil because we were heading into a recession or that Chinese demand was near record high would peak were incorrect.
They also said that US energy producers would continue to find ways to increase output to meet global demand would continue to happen even with the most hostile fossil fuel administration in the nation’s history. Sadly, Americans pulling up to the pump are finding out that this was not the case.
JP Morgan is reporting that U.S. oil production is starting to fall to 12.32 million barrels a day over the past week that’s down from 12.71 million barrels the prior week. Industry insiders are now saying that because of increased regulatory burdens and the lack of capital, the US energy production is going to plateau. Sufficient reasons suggested that the cancellation of the Keystone XL pipeline and drilling moratoriums, and threats of more regulations would stymie US output and cede control of the global oil market back to OPEC over the US was bound to happen.
Now there is a Washington Post article, you know that paper where their mission is to let Democracy Die In Darkness that says, “The EPA Mulls Tougher Limits On New Gas Plants As 2024 Election Nears. “The Post says, “The reconsideration comes after the Biden administration has backpedaled on other proposed climate regulations.” Yes, the ridiculous proposals were based on data that showed it cost a lot of money but did absolutely nothing to help the environment. He had to back pedal because the truth made them look ridiculous. So now to try to save face with the environmental left they have to make a splash.
The Post reports that, “The Environmental Protection Agency is considering significantly strengthening proposed limits on planet-warming pollution from power plants — a crucial part of President Biden’s climate agenda — according to three people briefed on the matter, who spoke on the condition of anonymity because no final decisions have been made.
The discussions about toughening the standards, which are set to be released this month, have major implications for America’s fleet of power plants, which rank as the country’s second-largest contributor to climate change. They come as the administration weighs the political calculus of weakening or strengthening environmental regulations before the 2024 election. The Post says, “The change could affect most new gas plants built in the United States, and it could have a significant climate impact. According to the EPA’s modeling, it could prevent up to 10.6 million metric tons of carbon emissions per year — equivalent to taking 2.5 million cars off the nation’s roads for a year.” Of course, you better check their math on that.
One of the things that we want to keep an eye on is this weakness in the crack spreads. The weakness in the crack spreads and the moves higher suggests that maybe demand could be challenged by these prices. On the flip side of that though, the other reason why we’re seeing some reluctance to move higher is concerns that the economy is too strong, and the Fed will have to cool things down. Don’t you love it when the market is confused as to whether it should be happy, the economy is strong, or it should be bearish because the economy is strong?
Oil prices are overbought but bounced back after key support test. The risk to oil is still around the upside but we have to be on guard for some corrections and some volatility.
Natural gas is starting to rebound even as we expect to see an injection this week into supply. With more talk of falling production, it is giving the natural gas market a boost.
Read Full Story »»»
DiscoverGold
Commodities Daily Market Movers (% Price Change)
By: Marty Armstrong | April 9, 2024
• Top Movers
AU - Queensland Base-Load Electricity Futures 5.72 %
Oats (Minneapolis) 5.37 %
AU - Victoria Base-Load Electricity Futures 5.34 %
NSW Baseload Electricity Continuous 4.81 %
NY Palladium Futures 4.28 %
• Bottom Movers
London IPE Gas Oil Futures 2.24 %
Soybean Oil CBT Futures 2.02 %
Palm Kernel Oil 1.91 %
Sugar World (CSCE) Futures 1.82 %
NY Heating Oil Futures 1.48 %
*Close from the last completed Daily
DiscoverGold
Natural Gas Daily Bullish Reversal Signals End to Pullback
By: Bruce Powers | April 8, 2024
• Natural gas triggered a bullish reversal on the daily chart, signaling an end to the three-day correction.
Natural gas triggered a daily bullish reversal on Monday, pointing to the likely completion of a three-day correction. Following a new pullback low of 1.75 earlier in the session and test of support at the purple 8-Day MA, also at 1.75, natural gas turned higher and broke out above Friday’s high of 1.82. A daily close above that price level will confirm the reversal and set the stage for a continuation higher.
Back Above 50-Day Moving Average
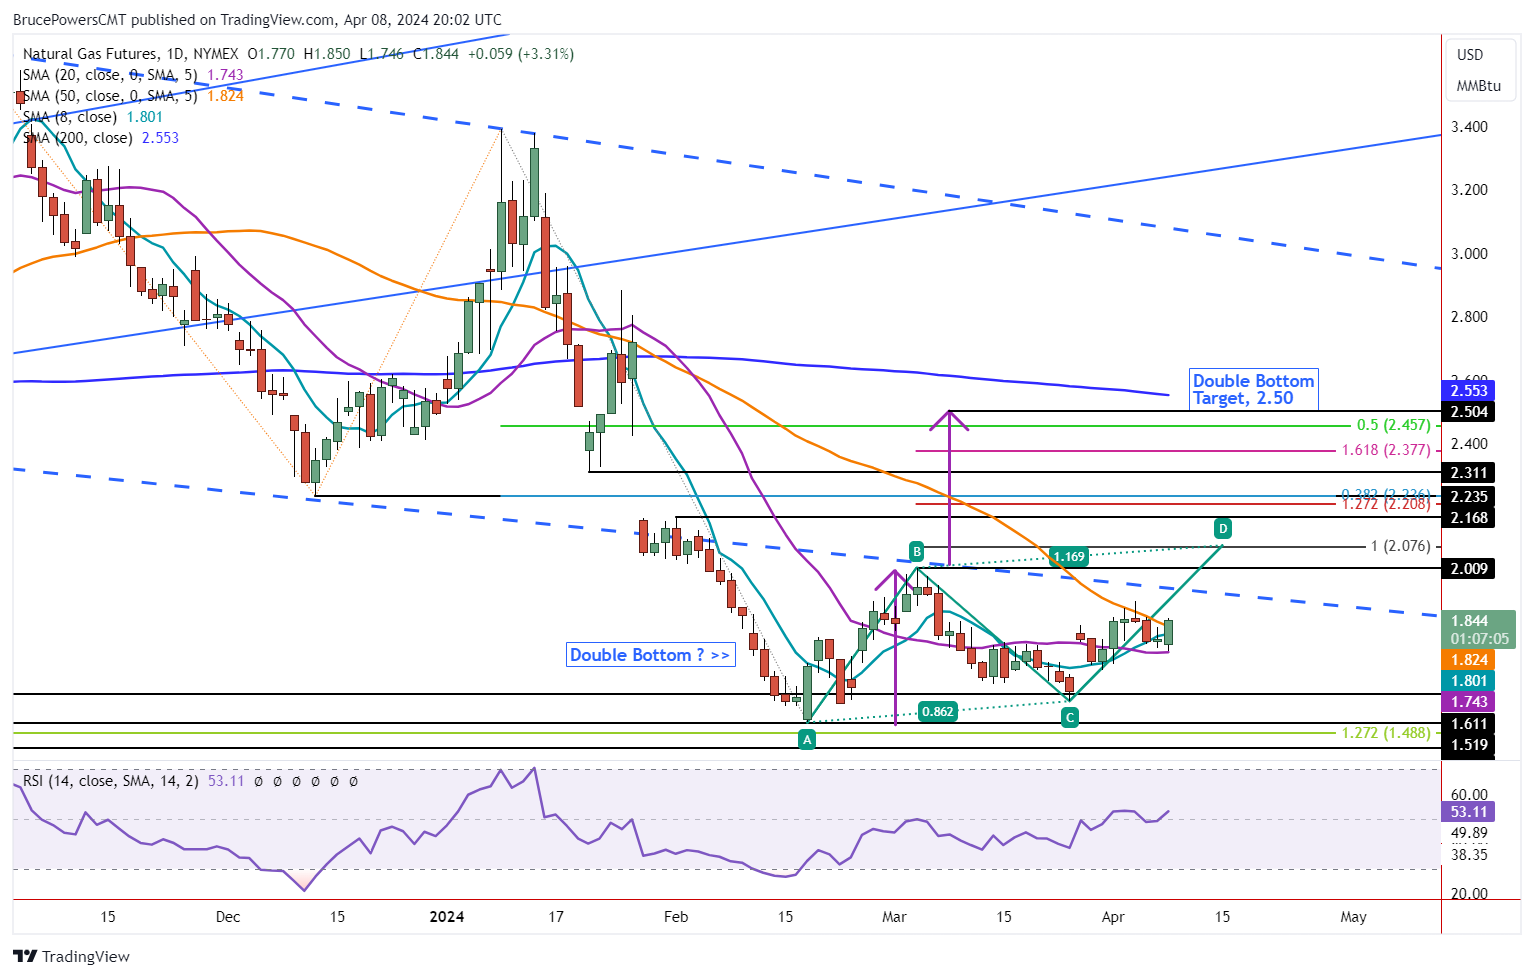
The orange 50-Day MA has marked dynamic resistance for the downtrend since mid-January. It currently stands around 1.8,2 and a daily close above it will provide a clear sign that demand for natural gas is improving. At the time of the writing, natural gas is trading above the 50-Day line. Moreover, the highest daily close since the March 25 bottom (C) was 1.85. An additional sign of strength will be indicated if natural gas can close above the 1.85 price level, which will be its highest daily close so far in the developing uptrend.
Weely Chart Shows Improvement
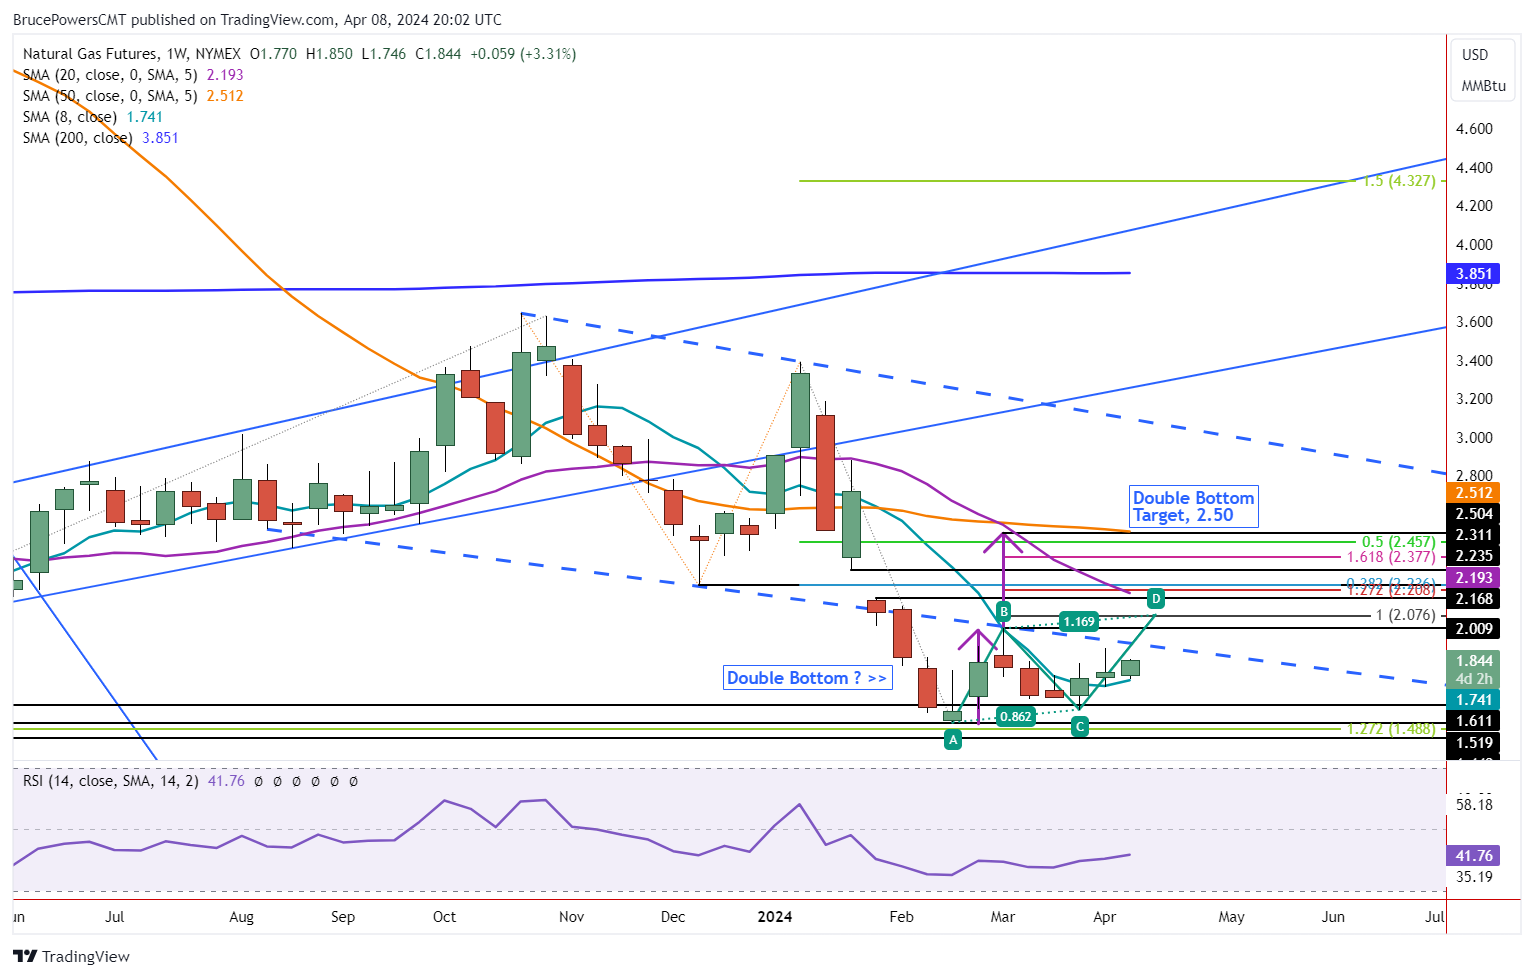
There are also bullish signs showing up on the weekly chart. A weekly bullish reversal triggered last week during a rally above the current three-week high of 1.83. It was confirmed on a daily close above the price level, but not yet on a weekly close as last week’s closing price was above the prior week’s high. Of significance, support on the weekly timeframe was seen at the 8-Week MA after the price of natural gas had traded below that line for approximately 10 weeks. Then again today, Monday, the low of the day successfully finds support around the 8-Week line.
Upside Higher Target of 2.50
If natural gas can close above the 50-Day line and continue to strengthen, it should exceed the recent minor swing high of 1.91 and trigger a continuation of the rising trend that began from the (C) point. That will put it on track to successfully engage the swing high of 2.01 at (B). A breakout above that high will trigger a bullish trend continuation of the developing trend as well as a double bottom pattern. The first upside target is then at 2.08, which will complete a rising ABCD pattern as marked on the chart. A minimum potential target from the double bottom bullish reversal pattern is up around 2.50.
Read Full Story »»»
DiscoverGold
The Pullback. The Energy Report
By: Phil Flynn | April 8, 2024
Oil is back after Israel pulled back some troops in Gaza and because Iran failed to follow through on threats to respond to Israel’s attack on its consulate in Lebanon. Yet to say the market is on edge is an understatement as supply tightness is clear as we continue to see ongoing threats to supply. Move Israel in oil prices are seeking to regroup it’s the market waits to see if there are any other shoes to drop.
There is also a lot of speculation in the market that the Energy Information Administration has been overestimating US oil production by almost 1 million barrels per day. As we know the Energy Information Administration has consistently had to adjust their production estimates from their weekly reports and now it’s very clear to many in the industry that the numbers that they have been reporting fall short. HFI Research points out that the EIA admitted that they didn’t survey oil production but used a model to come up with their equation the model has had run of overestimating production.
This overestimating production means that the supply situation based on current demand is much tighter than we had originally thought. If you look at the demand numbers from last week in the United States, they say hit an incredibly high 21,292 million barrels a day. So if the pattern of overestimating production continues and underestimating demand we could be in a very interesting situation.
So with the reduction of geopolitical risk, we’re back to focus on supply and demand which still looks exceedingly tight this week we expect to see crude oil supplies fall by 3,000,000 barrels. We also expect to see the same in products with a 3 million barrel drop in both gasoline and distillates refinery run should see an uptick of 0.5.
B technical pullback is happening because crude is overbought and because of the reduction of geopolitical risk in this type of situation is going to be important to see whether or not the market consolidates where we see some further downside are expectation is that we will consolidate at some point because the supply versus demand situation is too tight to ignore and it’s too dangerous to allow prices to fall because we’re going to need to squeeze out as much production as we can to meet demand.
Based on what we’re seeing in industrial metals and gold the markets as expected to see some industrial demand big strength in both aluminum and copper is giving the market some support in this one of the reasons why oil isn’t falling out of bed despite being very overbought.
Javier Blass at Bloomberg pointed out that Vitol, the world’s largest independent oil trading company, has made more money in the last 3 years than during the past 30 years combined.
Gasoline prices are still above year-ago levels. AAA reports that The National Average was $3.598 slightly above yesterday and a year ago and about 5.7 cents a gallon a week ago.
You don’t have to go to Nova Scotia to see the total eclipse of the Sun but it might be a day that is not good for solar panels, sort of like when it hails or snows. The EIA reports that On April 8, 2024, a full solar eclipse will briefly but fully obscure sunlight to utility-scale solar generation facilities from Texas through Maine with a combined 6.5 gigawatts (GW) of capacity. In addition, the eclipse will partially block sunlight to facilities with a combined 84.8 GW of capacity in an even larger swath of the United States around peak solar generating time.
Solar-powered generators centered in the path of totality—where the moon will completely obscure the sun—will be affected the most because the moon will block all direct sunlight for more than four minutes. The partial eclipse could limit the sunlight in the path of totality for more than two hours. Areas around the path of totality will have varying levels of diminished solar generation during the eclipse. Because we know about the eclipse ahead of time, utilities have prepared and planned for the lost solar energy. Several grid authorities have released plans for how they plan to deal with the change in solar generation during the eclipse according to EIA. So, we have that going for us.
Natural gas rigs have fallen to the lowest level since January. Production of natural gas is starting to fall. Power burns for natural gas have been exceedingly high as low prices have encouraged demand we’re expecting to see an increase in supplies of about 15 BCF this week in the weekly report and it feels like the market is trying to put in the bottom. Still, the fundamentals in the glut is real so it’s probably best to be hedged with options.
Read Full Story »»»
DiscoverGold
Arabica Coffee ("The Good Stuff") jumps to 18-month highs
By: Barchart | April 5, 2024
• Arabica Coffee ("The Good Stuff") jumps to 18-month highs.

Read Full Story »»»
DiscoverGold
Natural Gas Price Forecast: Bullish Reversal on Rally Above Today’s High
By: Bruce Powers | April 5, 2024
• Natural gas sees further weakness before finding support at 1.755. An intraday bounce suggests potential for a completion to the current pullback, but further confirmation is needed.
Further weakness in natural gas leads to support at 1.755 and an intraday bounce. The decline earlier in Friday’s session completed a 61.8% Fibonacci retracement before buyers took control. Natural gas is on track to close in the green if the close is above the open, as it is at the time of this writing.
The prior pullback triggered a bullish reversal after two days and the same may happen in this current pullback. If today’s low continues to hold as support, it will mark a successful test of support at the purple 20-Day MA and is a sign of improving short-term strength.

Rally Above Today’s High Signals Further Upside
Heading into next week, a bullish signal will be generated on a rally above today’s high of 1.82. That should mark the completion of the current pullback and set the stage for moving higher. Nevertheless, a rally above yesterday’s high of 1.85 provides greater confidence that demand is improving as it would also mark an advance back above the 50-Day MA, now at 1.84.
That should prepare natural gas for a rally above the most recent swing high of 1.91. It will trigger a continuation of the advancing CD leg of a rising ABCD pattern with an initial target at 2.08. A daily close above the 50-Day line would provide a key signal confirming an improving uptrend as the natural gas has traded below the 50-Day line since mid-January.
Weekly Bullish Reversal Intact
A bullish reversal triggered this week on the weekly chart and the week will end with a higher weekly high and higher weekly low, a sign of a developing uptrend. Support on the weekly chart was seen this week at the 8-Week MA. It is a sign of improving strength in the weekly time frame. However, the week is on track to close relatively weak, in the lower half of the week’s range and below last week’s high of 1.83. What it tells us is that the longer-time frame pattern has become more bullish. And the larger time frames impact price behavior in the shorter time frames. A variety of possible upside targets are marked on the chart. The first is at the completion of the ABCD pattern.
Read Full Story »»»
DiscoverGold
The Corn & Ethanol Report. Economy-Markets & Positioning For Reality
By: Daniel Flynn | April 5, 2024
We kickoff the day with Unemployment, Non-Farm Payrolls, Average Hourly Earnings MoM & YoY, Fed Collins Speech, Participation Rate, Average Weekly Hours, Government Payrolls, Manufacturing Payrolls, Nonfarm Payrolls Private, and U-6 Employment Rate at 7:30 A.M., Fed Barkin Speech at 8:15 A.M, Fed Bowman Speech at 11:15 A.M., Baker Hughes Oil & Total Rig Count at 12:00 P.M., and Consumer Credit Change, Dairy Products, and Used Cars MoM & YoY at 2:00 P.M.
The volatile day in commodities markets yesterday as we started out sailing until gloom & doom overtook took over as a reminder of how bad of shape the economy is overall is very poor, and extremely bad news is ahead if the government doesn’t change it’s ways of spending money like a drunken sailor. No matter how you crunch the numbers the data we receive on a given report will only have negative revisions in the next report. The US trade deficit widened to $68.( billion in February, a $1.3 billion or 2% increase from January. It was also the widest trade gap in 10-months (Apr 2023). The trade deficit widened and exports rose 2.3%to a record high of $263 billion, led by civilian aircraft, crude oil, soybeans, and nonmonetary metals. However, imports increased 2.2% to $331.9 billion, the highest since October 2022. Imports were lifted by increases for cell phones and other household goods, pharmaceutical preparations, cars, parts, and other foods. The trade deficit with China narrowed to a 3-month low of $21.9 billion, while the deficit with Mexico widened to a record. Large $15.3 billion. The numbers are very disturbing.
South American weather watch has Brazilian rain expanding into the driest areas of Mato Grosso do Sul in a 6-10 day period, hints on monsoon exit beyond April 13th . Heavy showers will persist for another 10 days, with needed rainfall of 1-2” to reach into the driest areas of Center-West Brazil in the 6-10 day period. Soil moisture is the concern. Next week’s expansion of Brazil rain is welcomed, but ARC is noting the 11-15 day guidance features a rapid and significant retreat in Brazilian precipitation, with totals of 1+” isolated to far Northern Mato Grosso. Confirmation that monsoonal rains end in mid-April is most worrisome for southern safrinha corn belt-which experiences needed precipitation next week but need much more to maximize safrinha yield potential. Brazilian weather still needs watching as pollination spans from mid-April to early May. Record safrinha corn production a year ago was driven in part by soaking rain in the second half of April and regional showers in Mato Grosso into the first week of May.
The US forecast uncertain over Midwest rain the next 10 days while temps lean to warm/hot beyond the weekend. The EU & GFS models are at odds over the placement of rainfall in the E Midwest April 11-12.The GFS keeps meaningful rain confined to the Delta & East Coast. The EU also allows the Delta to get soaked but the projects rainfall of 1-3” in IL, IN, and OH. Fieldwork gets delayed into the E Midwest is correct, but concern today centers on net soil moisture loss across the Plains and flooding in South/Southeast. Both models agree on this. A lengthy period of dryness occurs west of the Miss River. There is no indication of meaningful rain across the Plains/W Midwest into April 20th . A much warmer temp profile develops on the weekend and continues throughout the 6-15 day period. Maximum highs in TX,OK,KS, and NE reach into the upper 70’s/low 80;s . Temps in the 60’s blanket the primary Corn Belt after April 8th . Regional plantings begins in the second half of April. As we look at the economy with the cost of groceries to feed your family skyrocketing in this horrendous economy we should be wary as wee add to the list of further costs and fear factor of beef, pork, poultry, eggs, and further animal slaughter do the Texas Panhandle fires and the bird-flu disease will only add to price headaches and possible food shortages. The CBOT futures are higher this morning, with the wheat markets globally pacing the advance. Strength in the EU & US market is due to the Russian government’s expanding control of the market there as well as the ongoing numerous weather issues. Traders will also be eyeing the Commitment of Traders data.
Read Full Story »»»
DiscoverGold
Called Out. The Energy Report
By: Phil Flynn | April 5, 2024
Crude oil prices tried to retreat but rebounded after Peter Doocy at Fox News called out the Biden administration for reversing its “unwavering support for Israel” and asking about reports of a possible warning to Israel of a planned Iranian attack on Israeli soil. This was in response to a statement by US Secretary of State Anthony Blinken that said that U.S. policy will change if Israel doesn’t change course and its war against Hamas. Mr. Doocy asked, “Did the CIA warn Israel or did President Biden warn Netanyahu today about an Iranian plan to attack inside Israel within 48 hours?” John Kirby: said “I’m not going to talk about intelligence matters, Peter. I think you can understand. Um, but, um, they didn’t talk.
Reports swirling about a possible attack by Iran on Israeli soil would be a definite escalation of the proxy war between Iran and Israel. That put the market in risk aversion mode causing stocks to sell off, oil to rally as people prepared for what could be a major price spike if this confrontation happens. The risk to oil flows, especially coming out of Iran, would be put at risk. Also reports that the UAE would announce a suspension of all diplomatic ties with Israel. It’s another blow to the Mideast peace process that showed so much hope under Donald Trump when they signed the Abraham Accords.
The US Congress is continuing to call out the International Energy Agency (IEA) and sent them another letter demanding more information as to why the IEA has abandoned its historical commitment to nonpartisan and objective analysis for climate policy advocacy. And while they were at it, they may want to call out our own Department of Energy for being blasted about the misleading way that they try to justify Biden’s electric car push when data is, at the very least, downright misleading, if not intentionally written in a way to hide the truth.
The Hill reports that Biden’s EPA can justify his new EV rules only by cooking the books. They write that, “Before federal regulations are implemented, they must be justified with an extensive analysis of costs and effects. The new Environmental Protection Agency rule forcing a massive shift toward electric vehicles is no exception. Weighing in at 1,181 pages, it is accompanied by an additional 884 pages of “regulatory impact analysis.” The EPA analysis justifying this rule is not unique in its length, but it is unique in its dishonesty. In a must read they wrote, “EPA claims that the rule will reduce total greenhouse gas emissions over 2027-2055 by 7.2 billion metric tons. But despite a long and disingenuous discussion of the purported adverse effects of greenhouse gas emissions, EPA admits that it “did not…specifically quantify changes in climate impacts resulting from this rule in terms of avoided temperature change or sea-level rise.” The reason for that failure is obvious: The answer would be embarrassing. If we apply EPA’s own climate model, with assumptions that exaggerate the climate effects of reductions in GHG emissions, the rule would reduce global temperatures in 2100 by 0.0068 degrees Celsius — an effect far too small to be detectable.
Yet somehow, the EPA claims that the rule will yield “climate benefits” of $1.6 trillion. How is that possible for a near-zero effect on temperatures? As with the entire Biden climate regulatory regime across all agencies, EPA multiplies asserted reductions in greenhouse gas emissions by the “social cost of carbon,” a fictitious number that supposedly measures damage caused by the emissions.
The Daily Caller reported that, “A government watchdog group has filed a complaint with the Biden administration over its use of a dataset frequently used to push its climate agenda. They wrote, “Protect the Public’s Trust (PPT) filed the complaint with the Commerce Department over the National Oceanic and Atmospheric Administration’s (NOAA) “Billions Project” dataset, which purports to keep track of natural [and climate] disasters that have caused at least $1 billion in damages going back to 1980. The billion-dollar disasters (BDD) data — cited frequently by the Biden administration to insinuate that climate change is intensifying and justify sweeping green policies — is based on opaque data derived from questionable accounting practices, PPT alleges in the complaint.
This is just some misinformation and geopolitical risk factors creating the potential for a major oil price spike that the Biden administration may be hard-pressed to stop. So far it looks like their plans are to try to cool prices or to try to look like they’re going to be tough on Russia, Venezuela and Iran while at the same time allowing those countries to export their oil or at the very least, their oil products.
The cancellation of the buyback for the Strategic Petroleum Reserve this week shows that the Biden administration must be very concerned about the global oil supply deficit. Supply deficit that was in part created by the government manipulating the market with releases from the strategic petroleum reserve before they were needed. Biden’s misuse of the strategic petroleum reserve angered OPEC and other oil producers and that is a reason that OPEC and Russia have continued to be very cohesive in reducing global oil output. By artificially lowering prices, it did not help with a demand response or a production response to the real market conditions. And while the Biden administration may have benefited from the short-term price drop, it’s becoming more apparent with the looming global supply deficit that the misinformation provided by the reporting agencies and the SPR left the market short of supply.
Javia Blass says that all this turmoil will lead the Biden administration into a predictable pattern of damage control. First, they stopped further purchases for the SPR, then they announced there would be no reimposition of Venezuelan oil sanctions. Blass expects what will follow is to put pressure on OPEC to raise production. When that fails and it most likely will, they will start putting pressure on U.S. oil companies again probably calling them price gougers or war profiteers.” Lastly, they’ll go back to the bullpen and start releasing oil from the SPR even though it’s been depleted to the lowest level in over 40 years. Now there are also reports that the Biden administration is talking about lifting its terror designation on the rebels if they just promise to stop attacking ships in the Red Sea. I am assuming that the Biden administration is saying please on that one.
Russia is also talking about limiting gasoline exports. This could be in response to the attacks on the refineries by Ukrainian drones. Russian refineries will not be back to full operation until June according to Russia and it’s possible that the attacks on Russian refineries have not stopped.
In other words, it seems like the oil markets are getting shot out of their complacency. The reason why I continued to keep a bullish outlook, even when the prices looked over bought, was because I could see that beneath all the noise and the rhetoric, the supply versus demand fundamentals were much tighter than the market was giving it credit for. The reason why we suggested to keep hedged was exactly the situation that has been developing over the past few months. Despite all the doom and gloom about the economy and the potential for peak oil demand, we could see pretty clearly based on global daily demand versus daily global production as well as global inventories, that supplies are tighter than they’ve ever been or at least in a generation. And while the market seems to think this happened overnight, it’s been a long time since it’s been developing. The sad part about this is that a lot of this could have been avoided.
Natural gas got a bearish report. But the market is holding on to hopes of more production cuts. Working gas in storage was 2,259 Bcf as of Friday, March 29, 2024, according to EIA estimates. This represents a net decrease of 37 Bcf from the previous week. Stocks were 422 Bcf higher than last year at this time and 633 Bcf above the five-year average of 1,626 Bcf. At 2,259 Bcf, total working gas is above the five-year historical range.
Read Full Story »»»
DiscoverGold
Coffee is absolutely exploding higher (daily chart):
https://finviz.com/futures_charts.ashx?t=KC&p=d
Natural Gas Pulls Back After Failed Breakout Attempt
By: Bruce Powers | April 4, 2024
• Natural gas retreats, testing key support near 8-Day MA at 1.77, following bearish candlestick pattern.
Following Wednesday’s bearish shooting star candlestick pattern, natural gas pulls back to test support around the 8-Day MA (1.77). It has fallen back below the long-term downtrend line and continues to trade near the lows of the day, at the time of this writing. The current low for the day is 1.77. If the retracement continues next watch for possible support around the 20-Day MA, currently at 1.74. This is just the first day of a pullback, so another one or two days of weakness would not be surprising.
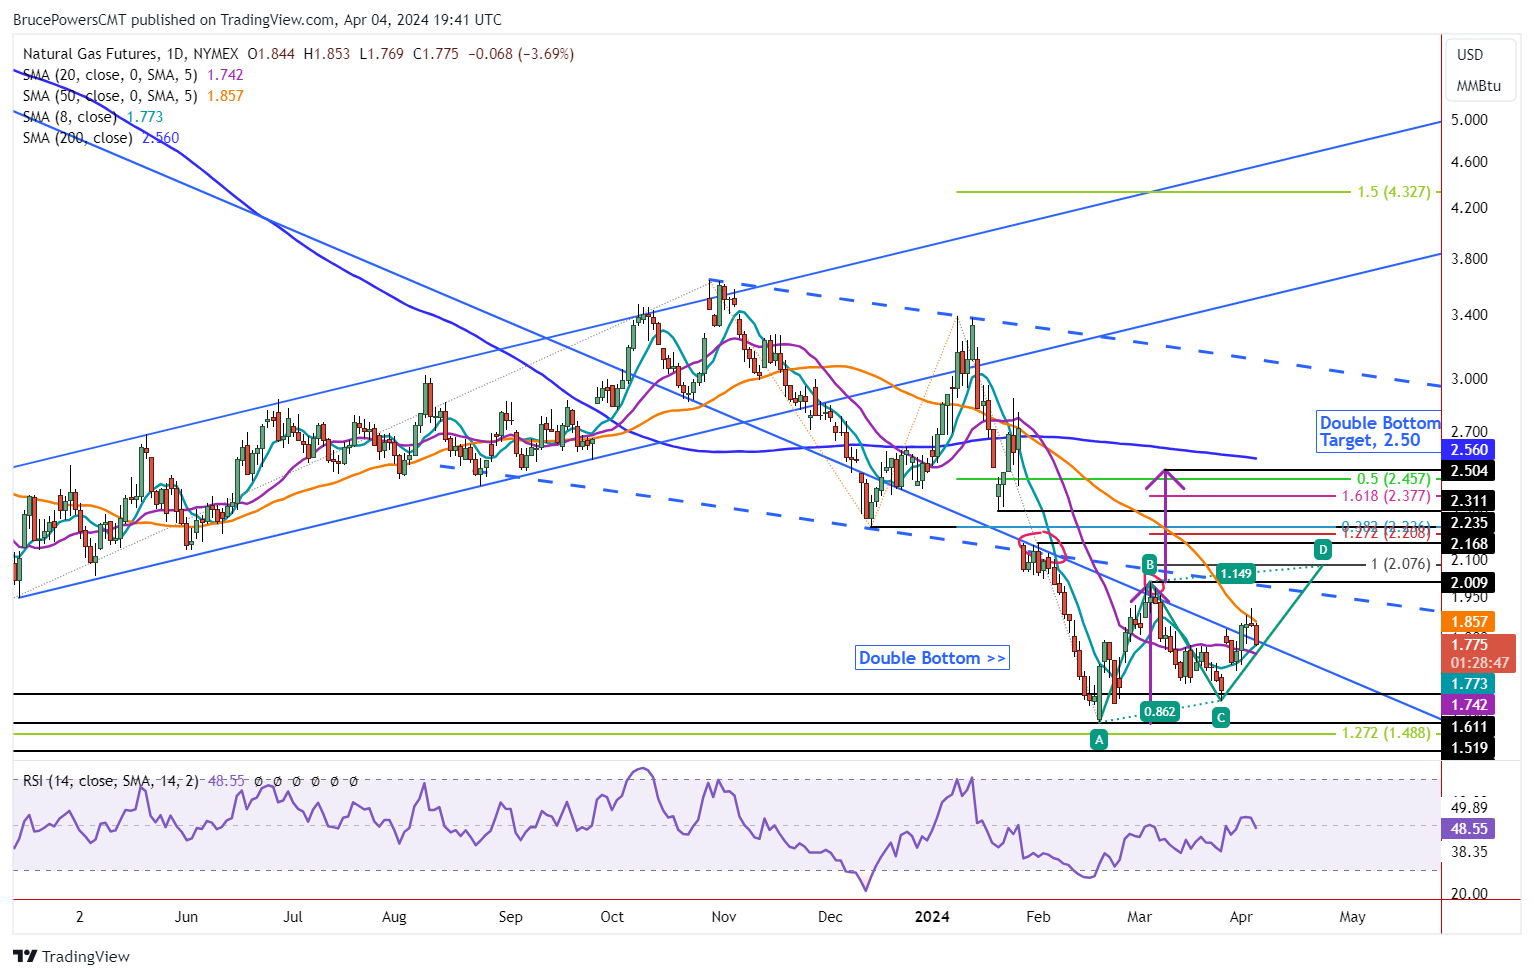
Failed Breakout Above 50-Day Moving Average
Natural gas turned lower yesterday following a failed attempt to break out above the 50-Day MA. That was the first time it was approached since late last year. It is not unusual for price to be rejected the first time a common moving average is approached after being away from it for a while. Currently, it is at 1.86 and was tested as resistance earlier in today’s session and rejected to the downside.

Weekly Chart Shows Demand Increasing
When looking at the 8-Week MA on the weekly chart the situation with natural gas gains some clarity. Notice that this week’s low successfully tested support at the 8-Week line with a low of 1.71. Last week, the 1.75 closing price was above the 8-Week MA for the first time since the week of January 22. This shows momentum beginning to switch from bearish to bullish as a potential bottom further develops. There is only one more day to the week with the current weekly pattern reflecting some uncertainty about a bottom.
Weekly Bullish Reversal Triggered
Nonetheless, this week’s advance triggered a bullish reversal on the weekly chart. A close this week above last week’s high of 1.83 would be a stronger close than one below that price level. Currently, natural gas is trading below it. The weekly chart also shows a higher weekly low and higher high, to go along with the recent higher swing low. Each is a bullish sign.
So far upward momentum has been muted, but that can change quickly once the 50-Day MA is exceeded for a second time. A double bottom pattern remains a possibility, while the first higher target is at 2.08, which completes a rising ABCD pattern.
Read Full Story »»»
DiscoverGold
Quietly, gold, silver, copper, oil, gasoline & coffee are on a rampage.
Index Funds & Economy. The Corn & Ethanol Report
By: Daniel Flynn | April 2, 2024
We kickoff the day with Redbook YoY at 7:55 A.M., Jolt’s Job Openings, Factory Orders MoM, Factory Orders ex Transportation, and Jolt’s Job Quits at 9:00 A.M., Fed Bowman Speech at 9:10 A.M., 42-Day Bill Auction at 10:30 A.M., Fed Williams Speech at 11:00 A.M., Fed Mester Speech at 11:05 A.M., Fed Daly Speech at 12:30 P.M., API Energy Stocks at 3:30 P.M., LMI Logistics Managers Index and Total Vehicle sales.
The Institute for Supply Management monthly Manufacturing Manager’s Index rose to an 18-month high of 50.3 in March. This was up from 47.8 in February and above the average trade estimate of 48.4. The index was up 5% from February, marking the strongest monthly increase since October 2020, and it was up 8% from a year ago marking the strongest year-over-year increase since August 2021. Businesses reported upticks in new orders, reflecting improving demand while also reporting that backlog’s had declined. However, employment numbers also remained in retreat while prices continued to move higher due to rising raw material prices.
The South American latest weather pattern update has El Nino reaching its zenith and is quickly collapsing in the equatorial Pacific. The encircled areas reflect where cooling is occurring with the current demise of the 2023/24 El Nino most like that of 1982/83 The analog and models forecasts that La Nina be in place by August and impact global weather patterns in the last quarter of 2024. All of the models forecast strengthening La Nina into 2025. The most adverse crop impact will again centered on Argentina. The impact on Central US weather this summer will be closely followed, but it’s the speed that La Nina develops and whether a Trough of Low Pressure holds across the Gulf of Alaska which would send the jet stream into the Western US with a high pressure Ridge forming across the South Central US this summer, but the location of most extreme heat has yet to be determined. Spring rainfall totals and soil moisture will determine the Ridges position.
Now that the quarterly stocks and Prospective Plantings behind us the CBOT markets came in mixed and some traders are stunned as we have not formed a low and waiting for a follow through rally. Traders will be watching weather and the Commitment of Traders more closely. Record gold prices and rising energy prices energy values could be the pressure that is starting to underpin the grain complex. WTI crude traded above $85 a barrel for the first time since October on rising Mideast tensions and strong world demand. Nearby crude prices are trading at strong premiums to back months, a sign of stout nearby refinery demand. A further rise in WTI would break another downtrend line that extends back to the 2022 high. Investment flows into the energy and metals markets is based on strengthening world economic outlook.
Monday’s CBOT open interest expanded with soybean oil up 8,507 contracts, soybean meal up 4,378 contracts, and soybeans up 3,511 contracts. Wheat open interest gained 6,761 contracts while corn was down 2,391 contracts. It appears managed money is putting a larger net short positions in soybeans, wheat and soybean meal. The CFTC data shows that index funds are returning to raw material markets as world interest rates decline.
Read Full Story »»»
DiscoverGold
Grains Report: Wheat, Rice, Corn and Oats, Soybeans, Canola and Palm Oil
By: Jack Scoville | April 2, 2024
• WHEAT
General Comments: Wheat was lower yesterday in anticipation of much improved crop condition ratings in the USDA reports that were released yesterday afternoon. There was also news that some shipments of Wheat sold by RiF were released by the Russian government. The USDA reports released Friday were considered friendly for Wheat prices, but futures closed mostly lower anyway and were led lower by Minneapolis. USDA said that All Wheat plantings would be about 47.5 million acres, with the big reductions seen in Winter Wheat. In contrast, Spring Wheat plantings were above the trade guesses at 11.335 million acres. Inventories were just above the average trade guess and 1.083 billion bushels. The problems with Russian Wheat exporter RiF continue. The dispute has held up shipments of at least 400,000 tons of grain so far although a few shipments were released by the government over the weekend. The reports indicate that the government is seeking more control of the exports and has made life very difficult for the private exporters in an effort to extract more sales and powers to the government. Russia is the world’s largest exporter and sets the world price and prices remain low. Big world supplies and low world prices are still around. Export sales remain weak on competition from Rusia, Ukraine, and the EU as those countries look to export a lot of Wheat in the coming period. Black Sea offers are still plentiful.
Overnight News: The southern Great Plains should get Scattered showers. Temperatures should be below normal. Northern areas should see scattered showers. Temperatures will average below normal. The Canadian Prairies should see scattered showers. Temperatures should average below normal.
Chart Analysis: Trends in Chicago are mixed. Support is at 539, 537, and 527 May, with resistance at 568, 572, and 580 May. Trends in Kansas City are mixed. Support is at 572, 567, and 564 May, with resistance at 594, 602, and 605 May. Trends in Minneapolis are mixed to down with objectives of 620 and 597 May. Support is at 629, 622, and 616 May, and resistance is at 647, 660, and 669 May.
• RICE
General Comments: Rice closed lower again yesterday and at new lows for the move. Trends are down in this market. Good demand for exports continues. The overseas markets feature less production in Brazil and India, and it appears that the lack of offer from these markets is supporting increased demand for US Rice and prices here in the US. It turned wetter and colder in the US last week and fieldwork will be much reduced.
Overnight News:
Chart Analysis: Trends are down with no objectives. Support is at 1624, 1612, and 1600 May and resistance is at 1678, 1744, and 1751 May.
• CORN AND OATS
General Comments: Corn and Oats closed lower yesterday. USDA issued its first crop progress report for Corn yesterday. The USDA reports released on Friday showed inventories and planting ideas below trade expectations. USDA said that plantings should be just 90 million acres and that inventories are estimated at 8.347 billion bushels. The plantings intentions report was especially bullish for Corn prices. Demand for Corn has been strong at lower prices. Big supplies and reports of limited demand are still around, but futures have been very oversold. Futures are much lower than just a few months ago and a short covering rally is increasingly expected and might start next week. Funds remain very large shorts in the market. Basis levels have firmed a little bit in the US as processors look for supplies amid tight farmer holding patterns. The weather forecasts for Argentina are improving with drier weather expected this week after some big rains last week. More rain is forecast for central and northern Brazil, but dry weather is forecast for southern Brazil The planting progress reports to date indicate rapid progress and reports from Brazil indicate that the Winter crop has been mostly planted now.
Overnight News:
Chart Analysis: Trends in Corn are mixed. Support is at 432, 426, and 422 May, and resistance is at 448, 459, and 463 May. Trends in Oats are mixed. Support is at 353, 349, and 344 May, and resistance is at 362, 369, and 374 May.
• SOYBEANS
General Comments: Soybeans and Soybean Meal closed lower yesterday in reaction to the USDA reports that showed slightly higher quarterly stocks and planting intentions when compared to expectations and on ideas of increased farm selling. USDA said that the stocks were 1.845 billion bushels and that farmers would plant 86.5 million acres of Soybeans. Brazil producers had been taking advantage on higher futures in the US and higher basis levels in Brazil, but the basis has fallen sharply in Brazil this week and sales have been less. Reports of great export demand in Brazil provide some support. Reports indicate that China has been a very active buyer of Brazil Soybeans this season. Ideas that South American production is taking demand from the US have pressured futures lower. Funds remain large shorts in the market. Basis levels in the US are reported to be firming as processors look for supplies and farmers remain tight holders.
Overnight News:
Chart Analysis: Trends in Soybeans are mixed. Support is at 1181, 1175, and 1165 May, and resistance is at 1217, 1227, and 1233 May. Trends in Soybean Meal are mixed. Support is at 326.00, 320.00, and 317.00 May, and resistance is at 340.00, 348.00, and 352.00 May. Trends in Soybean Oil are mixed. Support is at 4820, 4730, and 4690 May, with resistance at 4910, 4980, and 5000 May.
• CANOLA AND PALM OIL
General Comments: Palm Oil was lower last week on ideas of increasing world supplies of vegetable oils. Prices moved higher today on strong export data for the month from private sources. The export pace is expected to continue to really improve but this is part of the price already. The Southern Peninsula Palm Oil Millers Association expects Malaysia’s palm oil production for March 1-20 to have risen 22%. Domestic biofuels demand is likely to improve. Ideas of weaker production ideas against good demand still support the market overall. The fundamentals of average demand against a weaker supply outlook are still around to keep prices supported. Trends are turning down on the daily charts. Canola was higher yesterday. There were reports of big rains in Argentina, but forecasts for drier conditions now and improving weather in Brazil. Current forecasts call for generally improved growing conditions in Brazil this week.
Overnight News:
Chart Analysis: Trends in Canola are mixed to down with objectives of 617.00 and 596.00 May. Support is at 616.00, 610.00, and 602.00 May, with resistance at 652.00, 657.00, and 660.00 May. Trends in Palm Oil are mixed to down with objectives of 4070 and 3920 June. Support is at 4200, 4130, and 40\50 May, with resistance at 4280, 4310, and 4330 May.
Midwest Weather Forecast Showers and storms. Temperatures should average below normal.
Read Full Story »»»
DiscoverGold
Softs Report: Cotton, OJ, Coffee, Sugar, Cocoa
By: Jack Scoville | April 2, 2024
• COTTON
General Comments: Cotton was higher yesterday, but trends are still trying to turn down on concerns about the planting intentions report released Friday morning and despite improving ideas of demand potential from China. USDA said that 10.7 million acres might get planted this year, from 10.2 million last year. It is too early to plant in Texas but the heat and dry weather raises concerns about production potential later in the growing season and blackened soils might not permit much planting, anyway. The demand news has been solid but reduced from previous levels in this market for the last several weeks. The US economic data has been positive, but the Chinese economic data has not been real positive and demand concerns are still around. However, Chinese consumer demand has held together well, leading some to think that demand for Cotton in world markets will increase over time.
Overnight News: The Delta will get showers and rains and near normal temperatures. The Southeast will see showers and near normal temperatures. Texas will have mostly dry conditions and near to below normal temperatures. The USDA average price is now 85.86 ct/lb.
Chart Trends: Trends in Cotton are mixed. Support is at 90.50, 88.10, and 86.20 May, with resistance of 94.30, 96.20 and 97.70 May.
This Week Last Qeek Last Year Average
Cotton Planted 3 3 4
• FCOJ
General Comments: FCOJ closed sharply higher to limit up yesterday but remains in a trading range. Reports of tight supplies are around. Florida said that Oranges production will be low, but above a year ago. Futures still appear to have topped out even with no real downtrend showing yet, so a range trade has been seen. Prices had been moving lower on the increased production potential for Florida and the US and in Brazil but is now holding as current supplies remain very tight amid only incremental relief for supplies is forecast for the coming new crop season. There are no weather concerns to speak of for Florida or for Brazil right now. The weather has improved in Brazil with some moderation in temperatures and increased rainfall amid reports of short supplies in Florida and Brazil are around but will start to disappear as the weather improves and the new crop gets harvested.
Overnight News: Florida should get scattered showers or dry conditions. Temperatures will average near normal. Brazil should get scattered showers and above normal temperatures.
Chart Trends: Trends in FCOJ are mixed. Support is at 358.00, 347.00, and 353.00 May, with resistance at 378.00, 389.00, and 391.00 May.
• COFFEE
General Comments: New York closed higher yesterday with London closed. New York shows no direction right now in prices on the daily charts. The lack of Robusta Coffee in the market continues to support futures. Robusta offers from Vietnam remain difficult to find and the lack of offer of Robusta is a bullish force behind the London market action. Vietnamese producers are reported to have about a quarter of the crop left to sell or less and reports indicate that Brazil producers are reluctant sellers for now after selling a lot earlier in the year. The next Robusta harvest in Brazil will start next month. Brazil weather continues to improve for Coffee production and conditions are called good.
Overnight News: The ICO daily average price is now 191.28 ct/lb. Brazil will get mostly scattered showers with near normal temperatures. Central America will get mostly dry conditions. Vietnam will see scattered showers
Chart Trends: Trends in New York are mixed to up with objectives of 193.00 and 201.00 May. Support is at 188.00, 186.00, and 183.00 May, and resistance is at 194.00, 196.00 and 199.00 May. Trends in London are up with no objectives. Support is at 3460, 3420, and 3360 May, with resistance at 3600, 3630, and 3660 May.
• SUGAR
General Comments: New York and London closed higher yesterday, and London was closed for the holiday. Ideas of stronger demand have surfaced, and producers do not appear to be selling much. Indian production estimates are creeping higher but are still reduced from recent years. There are worries about the Thai and Indian production. Offers from Brazil are still active but other origins. are still not offering in large amounts except for Ukraine. Ukraine offers have suffered lately with the war. Demand reports from Europe have been strong.
Overnight News: Brazil will get rains in the south and scattered showers in the north. Temperatures should average above normal. India will get mostly dry conditions and below normal temperatures.
Chart Trends: Trends in New York are up with objectives of 2360, 2390, and 2400 May. Support is at 2210, 2170, and 2110 May and resistance is at 2290, 2320, and 2360 May. Trends in London are mixed to up with objectives of 676.00 and 698.00 May. Support is at 634.00, 629.00, and 619.00 May, with resistance at 667.00, 670.00, and 680.00 May.
• COCOA
General Comments: New York was sharply higher yesterday with London closed for a holiday. Production concerns in West Africa as well as demand from nontraditional sources along with traditional buyers keep supporting futures. Production in West Africa could be reduced this year due to the extreme weather which included Harmattan conditions. The availability of Cocoa from West Africa remains very restricted and projections for another production deficit against demand for the coming year are increasing. Ideas of tight supplies remain based on more reports of reduced arrivals in Ivory Coast and Ghana continue. Demand continues to be strong, especially from nontraditional buyers of Cocoa.
Overnight News: Isolated showers are forecast for West Africa. Temperatures will be near normal. Malaysia and Indonesia should see scattered showers. Temperatures should average near normal. Brazil will get isolated showers and above normal temperatures.
Chart Trends: Trends in New York are mixed to up with no objectives. Support is at 9630, 9000, and 8410 May, with resistance at 10320, 10440, and 10560 May. Trends in London are up with no objectives. Support is at 7860, 7500, and 6960 May, with resistance at 8660, 8720, and 8840 May.
Read Full Story »»»
DiscoverGold
Oil At $85.00. The Energy Report
By: Phil Flynn | April 2, 2024
Oil is surging to another yearly high as demand expectations rise, supply falls, geopolitical risks rise and OPEC March Oil output falls by 50,000 bpd from February to 26.42 million bpd according to the latest survey. Export cuts by Mexico to the tune of 600,000 barrels a day come on a day when manufacturing data and prices paid data in the US came in much stronger than expected. Then heightened geopolitical risks rose higher after a missile attack hit an Iranian diplomatic building in Damascus that killed a senior Iranian general. Iran said it was an Israeli attack that would demand an Iranian response. Iran is blaming Israel and the United States.
Iran’s Ali Khamenei is vowing to punish Israel after the deadly attacks while Iran reportedly is in backdoor conversations with the United States to try to ease tensions that could boil over into a confrontation that both Iran and the United States are trying to avoid. Iranian state media said the attack on Monday killed a senior leader in the elite Quds Force of Iran’s Islamic Revolutionary Guard Corps, which oversees Tehran’s network of militia allies throughout the region. The commander, Gen. Mohammad Reza Zahedi, managed Iranian paramilitary operations in Syria and Lebanon, according to Iranian state media and U.S. officials.
This came after a report that the Chinese manufacturing sector expanded stronger than anticipated. We also got a report from the ISM manufacturing here in the United States that showed that the US manufacturing sector is rebounding.
Bloomberg News reported that US factory activity unexpectedly expanded in March for the first time since September 2022 on a sharp rebound in production and stronger demand, while input costs climbed. The Institute for Supply Management’s manufacturing gauge rose 2.5 points to 50.3 last month, according to data released Monday. While barely above the level of 50 that separates expansion and contraction, it halted 16 straight months of shrinking activity. That report added to demand expectations for oil and products. And with the global well supply deficit already developing, the increased risk to supplies will keep the market on edge. Oil products like gasoline and diesel are starting to bounce back after being skeptical about the move but the inventories for products around the globe are below average and that should keep the market well supported on breaks. Bloomberg reported, “Mexico’s Pemex will ship less oil in a push to feed domestic refineries reducing Mexico’s exports by about 600,000 barrels a day of Maya crude oil.
There are more questions as to whether the US oil and gas industry can continue to overcome the hostile regulatory environment of the Biden administration. The American Petroleum Institute (API) is warning that the US will lose its energy advantage as the Biden administration continues to push short-sighted regulations on electric vehicles and new methane taxes that will severely curtail US oil and gas production and give our advisories a huge economic and military advantage.
In a release, the API and the Energy Workforce & Technology Council joined with 18 other associations representing all segments of the U.S. oil and gas industry operating across the country in calling on the U.S. Environmental Protection Agency (EPA) to revise its “misguided” methane fee on American energy. In comments submitted to the agency on the “waste emissions charge” proposed rulemaking, the associations argued that EPA’s proposed rule creates an incoherent regulatory regime, fails to meet the statutory requirements outlined by the Inflation Reduction Act, and disincentivizes emissions reduction efforts by the industry. “This tax on American energy is a serious misstep that could jeopardize our nation’s energy advantage and weaken our energy security,” said API Senior Vice President of Policy, Economics and Regulatory Affairs Dustin Meyer. “U.S. oil and natural gas is innovating throughout its operations to reduce methane emissions while meeting growing energy demand. Yet, this proposal creates an incoherent, confusing regulatory regime that will only stifle technology advancements and hamper energy development. With partners across the industry, we will consider all options to ensure a smart regulatory framework for continued American energy development.”
One way to reduce greenhouse gas emissions of course is going nuclear just don’t tell Jane Fonda. But the reality is that nuclear may play an even bigger part in the world’s quest to reduce greenhouse gas emissions than many may have imagined. Bloomberg News is reporting that, “US oil companies including Diamondback Energy are considering small nuclear reactors to power drilling operations in Texas’s Permian Basin. And for all those young people that are worried about climate change, wait till we tell them that we’re going to be using small nuclear reactors to power oil drilling. I don’t think they’ll ever leave their safe spaces again.
Natural gas seems to have everything against it but the charts look like they’re trying to turn positive. There is a strong seasonal tendency for the September natural gas to rally over the next month but it’s still facing some incredible hurdles when it comes to the supply side and the lack of winter. This late blast of winter is too little too late to have a meaningful impact but what could have an impact is continued production cuts at some point this comes as the Energy Information Administration touts the fact that the US is the biggest LNG exporter in the world which is a great thing if you want to replace coal around the world.
Read Full Story »»»
DiscoverGold
Commodities Daily Market Movers (% Price Change)
By: Marty Armstrong | April 2, 2024
• Top Movers
NY Natural Gas Futures 4.2 %
Tokyo Palladium Futures 3.96 %
Cocoa (NYCSCE) Futures 3.62 %
Orange Juice (NYCE) Futures 2.75 %
Cotton 2.27 %
• Bottom Movers
Live Cattle Futures (CME) 2.74 %
Platinum / Gold Ratio 2.44 %
Feeder Cattle (CME) Futures 2.42 %
NY Palladium Futures 1.71 %
Corn (CBOT) Futures 1.49 %
*Close from the last completed Daily
DiscoverGold
Natural Gas Bullish Weekly Reversal Points to Higher Prices
By: Bruce Powers | April 1, 2024
• Bullish momentum in natural gas confirmed, with potential for breakout to higher prices as technicals show signs of strength.
Natural gas triggered a bullish reversal on Monday in both the daily and weekly time frames, as it advanced above Friday’s high and then exceeded last week’s high of 1.83. It continues to trade near the highs of the day at the time of this writing and is well positioned to close strong, in the upper quarter of the day’s range. In addition, natural gas has a chance to end Monday’s session above last week’s high, which would further confirm strength. It is on track to close above both the 20-Day MA (purple) and long-term downtrend line. Each metric shows improving strength in demand. Natural gas has not been able to close above the downtrend line since January 26.

Second Bottom is Set for Potential Double Bottom
Today’s advance confirms the completion of a minor pullback and further confirms the higher swing low bottom from four days ago at 1.59 (C). A higher swing low is a sign of strength and is bullish. It begins the second leg up of a rising ABCD pattern. The initial target from the pattern completes where there is symmetry between the two swings, at 2.01. The secondary target, where the CD leg of the advance is extended by 127.2% of the AB leg, is at 2.21.
Eyeing Recapture of Downtrend Line
Once a daily close occurs above last week’s high, and above the downtrend line, the chance for a continuation higher improves. The next key encounter will be with the 50-Day MA (orange) at 1.90, as it represents dynamic resistance for the recent part of the downtrend. Natural gas has been trading below it since January 18. A daily close above the 50-Day line will show further signs of strengthening and again improves the possibility of the developing uptrend continuing to higher prices.
Higher Swing Low is Sign of Demand Improvement
The completion of the higher swing low at point (C) increases the chance for an eventual breakout of a double bottom pattern as the setup exists. However, as with all patterns, they need a trigger to confirm a breakout. That will happen on the double bottom pattern on a rise above the most recent swing high at 2.01. Subsequently, a daily close above that high will confirm the double bottom. It will also put natural gas in a position of having a higher swing high to follow the recent higher swing low.
Read Full Story »»»
DiscoverGold
No Fooling. The Energy Report
By: Phil Flynn | April 1, 2024
Oil and commodities are on fire with gold hitting a new all-time high and copper soaring after China’s manufacturing data hit a six-month high. China’s purchasing managers index rose to 50.8 from 49.1 in February beating expectations and Fed Chair Jerome Powell said that the February personal-consumption expenditures data was “pretty much in line with expectations,” and that he didn’t see elevated inflation risks. Oil trade should stay solid as Russia plans to cut its diesel exports by sea in April to a five-month low in the daily flows of exports from Russian ports are down 21%. Bloomberg is showing the impact of the diesel flows as Ukrainian drones hit Russian refineries. Russia has responded by attacking Ukraine’s energy infrastructure as well and we saw reports of power outages in Odessa and Kharkiv over the weekend. That, along with expectations that OPEC and Russia will follow through with their production cuts, is adding to the likelihood of an oil supply deficit as we head into the summer driving season.
Yet despite the turmoil around the globe, it seems that the Biden Administration wants to give China another big win at the expense of the US taxpayer as it drives deep into its fool-hardy obsession with electric vehicles. No fooling. China is getting a big boost of economic stimulus in part courtesy of the Biden administration as it believes they try to force electric cars down the throats of US businesses that don’t want them with no discernible help to the environment or have any impact on climate change. No fooling.
Yes, we are seeing oil prices start firm and a new record high in gold and a surge in copper prices as Chinese manufacturing hits a six-month high. So, it is head scratching time to see the Biden administration foolishly double down and its foolhardy attempt to try to electrify automobiles and the US truck fleet. A task that doesn’t make sense from a scientific standpoint but if you believe some of the economic pain it will cause and the advantage it gives to China, somehow atones for what they see as environmental injustices.
The Hill writes that, “An estimated 72 million Americans, often people of color or people with lower incomes, live near freight truck routes,” EPA Administrator Michael Regan said. “These communities are disproportionately exposed to the pollution from heavy-duty vehicles, resulting in higher rates of respiratory and cardiovascular illnesses and even premature death,” he added. “Reducing emissions from our heavy-duty vehicles means cleaner air and less pollution.” The Biden administration is fooled into believing that they are saving the planet but foolishly what they are doing is costing the US jobs and adding to inflation.
For the sake of optics, they foolishly enrich China which will benefit from this foolish policy while it may add to carbon emissions. While the EPA tries to tell us that this plan will “avoid” one billion metric tons in CO2 emissions from 2027 through 2055.
The Wall Street Journal points out that emissions from China and India rose last year alone. The Wall Street Journal points out that the, “EPA says its big-rig quotas are feasible because the Inflation Reduction Act and 2021 infrastructure law include hundreds of billions of dollars in subsidies for EVs. This includes a 30% tax credit for charging stations, a $40,000 tax credit for commercial EVs, and a tax credit for battery manufacturing that can offset more than a third of the cost. IRA tax credits for electric trucks aren’t conditioned on the source of battery material, so expect most to come from China. China’s BYD was California’s top-selling electric truck maker in 2022. Biden officials say Chinese green-technology manufacturers are flooding the U.S. market, but their mandates and subsidies are the reason.” They foolishly don’t even consider the real cost and it’s the real impact on inflation. They are foolish enough to believe that somehow, it’s OK to destroy the middle class by increasing their costs in the name of what they call environmental justice, which is kind of like a religion, to them I guess. Of course, these are the same people who foolishly believe that calling Easter, the most holy day in the Christian calendar, Transgender Day of Visibility would not be deeply offensive to Christians all over the world. This administration seems to offend anybody who gets in the way of their agenda and gets offended by the truth.
The Biden administration had harsh words for the US oil and gas industry as well as mom-and-pop gas station owners whom they accused of being price gougers and war profiteers. This is an administration that then turned a blind eye to Iranian oil sanctions and allowed Iran to make billions of dollars while they spread their errors throughout the world by supporting terror groups like Hamas, Hezbollah and the Houthi rebels. The Biden administration also is now not going to enforce sanctions on Venezuela mainly because they’re concerned about rising gasoline prices and imperiling Biden’s reelection chances.
We saw an uptick in gasoline demand as spring break and Easter travel gave us a bounce. AAA says that, “Gas prices are at 3.536 a gallon slightly more than yesterday and more than a week ago an about 14 cents a gallon more than a week ago. Prices are in overbought territory but we don’t see a big correction coming anytime soon. More than likely there will be a little bit of consolidation as we start to move higher. Inventory this week is expected to be relatively flat but we could see a drop in products like gasoline and diesel. OPEC and Russia are showing unity.
Natural gas prices continue to struggle even as Chesapeake Energy plans to put 80 new natural gas wells into suspended animation by the end of this year other firms like QG are shutting in wells we’ll see if it gives the market a bit of support.
Read Full Story »»»
DiscoverGold
Coffee Hits All-Time High
By: Barchart | March 28, 2024
• Robusta Coffee just hit an all-time high! First, they take OJ from us, then chocolate, and now coffee. This is too much, folks.

Read Full Story »»»
DiscoverGold
Natural Gas Eyes Bullish Reversal from Retracement Low
By: Bruce Powers | March 28, 2024
• Natural gas bounced from 1.69 low, eyes bullish reversal above 1.76 with potential to eventually breakout of double bottom pattern.
Natural gas falls to a new retracement low of 1.69 before finding support and bouncing intraday. It is possible that today completes a two-day retracement as a 61.8% Fibonacci level was just below today’s low at 1.68. Today’s high of 1.76 found resistance at the 20-Day MA (purple). Today’s candle sets up for a bullish reversal signal on a decisive rally above today’s high. Natural gas would then be heading for the recent swing high of 1.83 with the potential to breakout above that price level.

Rally Above 1.83 Confirms Strength
A rally above 1.83 would trigger a continuation of the rally begun from the recent swing low at 1.59 (C). That low is a second bottom that sets up a potential double bottom bullish reversal pattern. It triggers on a move above the March 5 swing high at 2.01. Until then it is a potential double bottom. The target derived from the pattern is approximately 2.50. If reached, it would put natural gas a little below the 200-Day MA, currently at 2.57.
Eyes Breakout Above Long-term Downtrend Line
If natural gas can close above the 1.83 swing high it will have broken back above the long-term downtrend line, which has represented dynamic resistance since the end of January. That would provide a clear sign that the price of natural gas is continuing to strengthen and that the current rally has the potential to reach higher targets. Subsequently, we will need to see further confirmation of strength to indicate that it can keep rising. The 50-Day MA is a target and it currently sits at 1.91. A daily close above it will indicate improving demand and improve that chance that natural gas keeps rising.
Rise Above 2.01 Needed for Sustainable Signs of Strength
Resistance was seen on the last advance at 2.01 (B). That is right around previous support seen at the prior trend lows in 2023. A daily close above that level would provide a sign that demand is continuing to strengthen on the way up. It triggers a breakout of the double bottom and confirms a continuation of the counter-trend rally. The next higher target would then be the February 1 swing high of 2.17.
Read Full Story »»»
DiscoverGold
The Corn & Ethanol Report
By: Daniel Flynn | March 28, 2024
We kickoff the day with Export Sales, GDP Growth Rate QoQ Final (Q4’23), Corporate Profits QoQ, GDP Price Index QoQ Final, Initial Jobless Claims, Continuing Jobless Claims, Core PCE Prices QoQ Final, GDP Sales QoQ Final, Jobless Claims 4-Week Average, PCE Prices QoQ Final, and Real Consumer Spending QoQ Final at 7:30 A.M., Chicago PMI at 8:45 A.M., Michigan Consumer Sentiment Final, Pending Home Sales MoM & YoY, Michigan 5-Year Inflation Expectations Final, Michigan Consumer Expectations Final, Michigan Current Conditions Final, and Michigan Inflation Expectations Final at 9:00 A.M., EIA Natural Gas Storage at 9:30 A.M., Kansas Fed Composite Index and Kansas Fed Manufacturing Index at 10:00 A.M., 4-Week & 8-Week Bill Auction at 10:30 A.M., Prospective Plantings, Quarterly Grain Stocks, 15-Year & 30-Year Mortgage rate at 11:00 A.M., Baker Hughes Oil & Total Rig Count at 12:00 P.M., and Hogs & Pigs at 2:00 P.M.
As we digest all the quarterly reports, and added reports we the long weekend in observance of Good Friday & Easter. We are here at the awaited Quarterly Grain Stocks and Prospective Plantings will finalize farmers early intentions with incoming revenue the most highest priority in these markets. New activity with funds leading to further speculation that the new index fund money is not just being bottom feeders but is shorting or adding to shorts in this heavy volatile bear stand. Bullish fundamentals and bearish technicals are leading further indecision in the grain complex.
The latest update on South American weather has a drier forecast across Southern Brazil while weather in Mato Grosso and Argentina remain favorable. The EU & GFS remain in agreement that Brazil’s monsoon continues to perform normally into the middle part of April across key areas of northern Brazil. Warmth/dryness pushes maturity and speeds harvest along in Argentina. The only area of concern at present is that of deepening drought across the southern third of Brazil’s safrinha Corn Belt. 10-day cumulative rainfall of 2-4” impacts Mato Grosso do Sul and Goias in Brazil. Moderate rain sneaks into northern Mato Grosso do Sul but does not reach major crop areas there – and a pattern of complete dryness is offered to Parana – which accounts for 15% of Brazilian safrinha production. Projected subsoil anomalies remain in place. Surplus moisture will be present in Mato Grosso do Sul and Parana. It remains the story of the haves and have nots. USDA will be forced to trim it’s Brazilian corn production estimate if rain fails to appear in the south by mid-April. This will add to volatility and price swings. Yesterday’s open interest reflect the doubt in the passion of bulls & bears minds as we seem to be oversold.
In yesterday’s trading session corn open interest fell 828 contracts and soybeans dropped 1,355 contracts, while wheat rose 2,175 contracts. Soybean meal lost 2,161 contracts while soybean oil dropped 1,635 contracts.
Read Full Story »»»
DiscoverGold
Biden Panic Buying. The Energy Report
By: Phil Flynn | March 28, 2024
What does it say that the Biden administration is starting to buy oil back for the Strategic Petroleum Reserve (SPR) above their stated $70.00 to $67.00 a barrel buying price, purchasing oil at $81.32 a barrel? Is it possible that the Biden administration is fearful that we’re going to get another spike in price? Or are they trying to fill it up in anticipation of something more ominous? Are they worried about the report from energy consultancy Wood Mackenzie that warns that more than one firth, or 21%, of global refining capacity is at risk of closure due in part because of what Saudi Aramco Chief Executive Amin Nasser said this week was a failed and flawed energy transition? Are they starting to worry that major reporting agencies like the International Energy Agency are starting to predict an oil deficit something The Energy Report of course has been warning about for over a year? Perhaps they are starting to worry about more predictions like that of Morgan Stanley about calls for a return to $100.00 a barrel of oil. Are they worried that heading into an election year, we’re seeing gasoline prices start to rise and the defense of their green energy policy is not going to play well on Main Street America?
Perhaps they are concerned that their political motivated use of our strategic reserves has left the country more vulnerable as the Biden foreign policy has failed to reduce risk to global energy supply and global supply chains. Biden’s presidency has seen the risk to global energy supply higher than it has been in at least a half of century. The easing up on Iran has allowed Iranian oil production to hit the highest level since 2018 and has put billions of dollars in their coffers so they can fund their friends in Hamas, Hezbollah, and the Houthi rebels. Perhaps there is worry that the country is not going to be able to respond to a major oil price disruption.
Of course it doesn’t help that the Biden administration has demonized the US oil and gas industry and created more regulations with heavy-handed tactics that are not based in real science and is discouraging investment in the US oil and gas space which is leading some people to predict that US energy production will peak and start to fall. It doesn’t help that the Biden administration killed the Keystone XL pipeline for purely political purposes. Government studies show that the Keystone Pipeline would not have added to greenhouse gas emissions so the decision to kill the Keystone XL pipeline was purely political. Now with the global supply of oil being exceedingly tight, especially that of heavy oil, the Keystone Pipeline could have moved oil much more efficiently and safely than it’s being moved today.
Regardless of the oil and oil products, the fundamental outlook must be putting major pressure on this administration that is trying to convince you that they have reduced inflation even as everyone knows that the opposite is true. Perhaps they are upping the purchases or the SPR regardless of price because of previous comments by Energy Secretary Granholm’s impossible promise to refill the reserve by the end of the year. She was quoted as saying, “By the end of this year, because of crude purchases, the reserve is expected to “be back to essentially where we would have been had we not sold during the invasion of Ukraine,” after accounting for the cancellation of 140 mn bl of congressional mandated crude sales that were scheduled through 2031. Or maybe it’s just a realization that they’re starting to panic because they used the Strategic Petroleum Reserve as a measure to lower gasoline prices before the war in Ukraine started and now the world is at risk of a major supply shortage and they might not have enough well in the bank to cover in the event of a global disruption.
The Biden administration misused the SPR by changing the definition of the reserve as a reserve to be used in the event of an emergency not in the event of a political crisis. It was never meant to be used as a price control mechanism.
What does it mean when a People’s Bank of China adviser admits that the Chinese past regulatory tightening has hurt the confidence of investment in China? No, US Treasury Secretary Janet Yellen has the nerve to call out China saying that they should never flood the world with cheap energy exports saying it would disrupt global markets and harm workers. Of course, that’s pretty funny because she supported Biden’s release from the Strategic Petroleum Reserve. Is she trying to say that Biden’s release from the Strategic Petroleum Reserve didn’t distort global markets and harm workers? Is she saying that the killing of the Keystone Pipeline didn’t harm workers? Is she saying that the drilling moratorium and regulatory environment didn’t hurt workers in the US oil and gas industry?
Well, the reality is that we’re starting to see oil prices start to react to the global situation. Crude oil prices are surging back to the high after they put into perspective yesterday’s Energy Information Administration report that wasn’t nearly as bearish as the American Petroleum Institute report. Gasoline supplies on the West Coast seem to be tightening significantly which means California is going to see another price spike in gasoline and leave the nation with higher prices.
The EIA said that U.S. commercial crude oil inventories (excluding those in the Strategic Petroleum Reserve) increased by 3.2 million barrels from the previous week. At 448.2 million barrels, U.S. crude oil inventories are about 2% below the five year average for this time of year. Total motor gasoline inventories increased by 1.3 million barrels from last week and are about 1% below the five-year average for this time of year. Finished gasoline inventories decreased while blending components inventories increased last week. Distillate fuel inventories decreased by 1.2 million barrels last week and are about 6% below the five-year average for this time of year. Total commercial petroleum inventories increased by 5.3 million barrels last week. Total products supplied over the last four-week period averaged 20.1 million barrels a day, up by 2.2% from the same period last year. Over the past four weeks, motor gasoline product supplied averaged 8.9 million barrels a day, up by 0.9% from the same period last year. Distillate fuel product supplied averaged 3.8 million barrels a day over the past four weeks, up by 2.2% from the same period last year. Jet fuel product supplied was up 0.4% compared with the same four-week period last year.
Berkeley, CA had to reverse its ban on natural gas. Hopefully the rest of the country will do the same, especially in New York where the natural gas ban and new building is going a have devastating effects on the New York economy. Of course the New York economy it’s a mess anyway. Natural gas traders are hoping for a resumption of the Freeport LNG terminal quickly so LNG exports can start to surge. Natural gas production is showing some signs of easing off.
Read Full Story »»»
DiscoverGold
Commodities Daily Market Movers (% Price Change)
By: Marty Armstrong | March 28, 2024
• Top Movers
Cocoa (NYCSCE) Futures 2.3 %
ICE Newcastle Coal Continuous 2.02 %
AU - Victoria Base-Load Electricity Futures 1.78 %
Coffee (NYCSCE) Futures 1.38 %
Wheat #2 0.92 %
• Bottom Movers
NY Natural Gas Futures 3.91 %
Cotton #2 (NYCE) Futures 2.83 %
Iron Ore 62% Fe CFR China (TSI) 2.68 %
Lumber (CME) Futures 2.42 %
Platinum / Gold Ratio 2.38 %
*Close from the last completed Daily
DiscoverGold
'Commodities are at a bullish turning point.'
By: Jesse Felder | March 27, 2024
• 'Commodities are at a bullish turning point.' https://entrylevel.topdowncharts.com/p/chart-of-the-week-bullish-commodities

Read Full Story »»»
DiscoverGold
Natural Gas Symmetry Pattern Points to Higher Targets
By: Bruce Powers | March 27, 2024
• Natural gas is testing support at the 8-Day MA and 1.70 level, with a bullish reversal indicated on the weekly chart.
Natural gas pulls back below Tuesday’s low to test support at the 8-Day MA. Support and the low of the day for Wednesday was at 1.70, at the time of this writing, and the 8-Day line is at 1.70. As of Monday’s 1.59, swing low (C), natural gas began the second leg up of a rising ABCD pattern. It remains valid unless there is a drop below 1.59.

Higher Swing Low Points to Improving Demand
Since there is now a higher swing low at 1.59, natural gas is showing improving underlying demand. It is still early but that is the situation currently. Therefore, the expectation is for the initial target from the ABCD pattern to be reached. It completes at 2.08, which is where there is price symmetry between the CD leg and the AB leg of the pattern. That target is then watched as any pivot level may be. Either resistance is seen or a breakout through the target zone follows and natural gas heads towards higher price levels.
Resistance Seen at Long-term Downtrend Line
Nevertheless, the next potential barrier that needs to be busted for further signs of strength is yesterday’s high of 1.83. Notice that resistance was seen right at the long-term downtrend line. That line was successfully tested as resistance twice previously (red circles). Therefore, it represents the next important barrier to be broken if the bulls are going to take back control. If it is exceeded to the upside, the next target zone would be around the 50-Day MA.
50-Day Line at 1.94 Also Upside Target
The 50-Day line is currently at 1.94 and is confirmed by the important prior trend low from April 2023. It was critical support at the same price in 2023 and now it is potentially significant resistance. That also means that a bust-up through that price level should see demand increase as it will mark a key improvement in the developing uptrend. Although, keep in mind that it is a counter-trend rally within a larger downtrend price structure.
Weekly Bullish Reversal Signaled
Currently, natural gas is showing a bullish reversal on the weekly chart, which is an outside week. A weekly close above last week’s high of 1.77 will provide a stronger sign of strength than a close below that level.
Read Full Story »»»
DiscoverGold
The Corn & Ethanol. New Money Bullish On Commodities?
By: Daniel Flynn | March 27, 2024
We kickoff the day with MBA 30-Year Mortgage Rate, MBA Mortgage Applications, MBA Mortgage Market Index, MBA Mortgage Refinance Index, and MBA Purchase Index at 6:00 A.M., EIA Energy Stocks at 9:30 A.M., 17-Week Bill Auction and 2-Year FRN Auction at 10:30 A.M., 7-Year Note Auction at 12:00 P.M., Dairy Products Sales at 2:00 P.M., and Fed Waller Speech at 5:00 P.M.
Traders are positioning ahead of tomorrow’s reaction after the USDA reports, and a busy data day, traders have the opportunity to mull over their positions before the fireworks start with the long weekend. The South American weather pattern remains favorable overall, but dry South Central Brazil to get drier. The Brazilian monsoon will continue normally for another two weeks in key safrinha corn producing states Mato Grosso & Goias, with subsoil moisture there now adequate following the dryness of early March. Mato Grosso & Goias account for 60% of total Brazilian safrinha production and avoiding yield issues there is important. Additional soaking rainfall of 2-6” is forecast in Mato Grosso into April 5th . However, developing drought in Mato Grosso do Sul and Parana will not benefit from soaking rainfall into April 5th . Heat returns to MGDS/Parana this weekend. The Brazilian corn growing season is A STORY OF HAVES AND HAVE NOTS. We are all to familiar with that reality of actual weather risk. Argentine corn & soybean harvests are moving more quickly with the absence of soaking rainfall and as temps there exist 4-8 degrees above normal. High temps in Argentina will reach into mid/upper 80’s during the remainder of this week. Crop maturation is being pushed with early harvested yield data being strong.
Were coming in lower on CBOT grains with risk aversion is in high gear, as the market adds up further losses with Bird Flu affecting dairy cattle in Texas and Kansas so far. Yesterday’s selloff was sheer panic, and when a market panic’s…. We saw what happened yesterday. New money is coming into the market and fundamentals should take hold. However, the May corn & May soybeans futures have fallen below their 50-day moving averages. Expect the energy and food sector to be bullish overall in the futures markets, as producers will be applying long and short hedges. The open interest watch had corn rising 2,573 contracts in yesterday’s trading session. Chicago wheat added 852 contracts and soybeans jumped 11,597 contracts. The big rise in soybean open interest is a surprise ahead of the USDA report. The down market and rise in soybean open interest suggests new sellers have emerged
Buckle Up Your Chinstrap- A Lot Of Pre-report positions going on!
Read Full Story »»»
DiscoverGold
API Surprise. The Energy Report
By: Phil Flynn | March 27, 2024
As the market prepares for the upcoming Easter holiday and with the oil market closed on Good Friday, a shocking build in crude supply might be a bit hard to shake off. The American Petroleum Institute (API) reported a massive 9.337-million-barrel increase in crude supply along with a much larger-than-expected 2.392-million-barrel increase in crude oil supply. The surge in crude supplies would be welcome news for refiners but it does have people questioning how we could have seen such a large increase in just one week. We do know that refinery maintenance issues helped increase supplies at Cushing, OK. We know that ongoing refinery maintenance issues could be partly to blame. Regardless, the increase in size was stunning just to say the least.
Oil exports and oil production are going to be monitored very closely if it weren’t for the fact that we saw a very large 4.437 million barrel drop in gasoline inventories, the market might have fallen apart on light volume that gets lighter as we get closer to the end of this shortened trading week. Distillates barely moved the needle, increasing by just 531,000 barrels. Today the market is going to analyze the Energy Information Administration report to see if this build is an aberration or if there’s something in the data that suggests a significant drop in demand.
We do know that consumer confidence, according to yesterday’s data, took a big hit. The consumer confidence board reported that the consumer confidence index fell to 104.7 this month from a revised 104.8 (originally106.7) in February and below market expectations. Consumers feeling the heat from inflation not only in rising gasoline prices but also at the grocery store are raising concerns that they may pull back when it comes to driving vacations and discretionary spending. Gasoline demand is going to be watched very carefully because if it drops, it means to consumers have hit a point where they need to pull back.
Even Russia’s commitment to cut production to 9 million barrels a day by June didn’t seem to have a lasting impact on prices. Still, the reduction in Russian oil production combined with reduced refining capacity should continue to keep the squeeze on supplies in Europe and globally. This comes as increased sanctions on Russia lead to payment delays. Reuters is reporting that, “Russian oil firms face delays of up to several months to be paid for crude and fuel as banks in China, Turkey and the United Arab Emirates (UAE) become more wary of U.S. secondary sanctions, eight sources familiar with the matter said. Payment delays reduce revenue to the Kremlin and make them erratic, allowing Washington to achieve its dual policy sanction goals – to disrupt money going to the Kremlin to punish it for the war in Ukraine while not interrupting global energy flows.”
Going into the Easter holiday we are seeing gasoline prices that are higher than they were yesterday, higher than they were a week ago, higher than they were a year ago. Today gasoline prices are clocking in at $3.53 .5 per gallon. That is up two cents from a week ago, 22 1/2 cents from a month ago and about a dime higher than they were a year ago. The trend of falling gasoline supplies needs to be reversed. It’s going to be interesting to see if there are any signs that that will happen in the Energy Information Administration report.
The market is trying to assess its supply chain issues when it comes to the tragic Francis Scott Key bridge collapse in the port of Baltimore. Close Point LNG said that their operations are going to continue as normal as their facilities were south of the bridge collapse therefore their exports will not be impacted. Car manufacturers, mainly Mazda, is going to have significant supply chain issues until the port is reopened. The port of Baltimore is the major import and export point for many automakers especially some of the higher end brands. It is a major hub for Domino sugar and some of their products also could be harder to find.
Fox News is reporting that safety investigators will probe whether dirty fuel contributed to Francis Scott Key Bridge collapse. They write that, “A safety investigation into the Francis Scott Key Bridge collapse in Baltimore, Maryland, will include whether contaminated fuel was a factor in a cargo ship losing power and crashing into the bridge. Investigators had not boarded the ship, a 948-foot-long container ship called the Dali, as of late Tuesday while it remained stuck on a pillar of the collapsed bridge, and the vessel could stay there for weeks. Rescue crews spent much of Tuesday searching for potential survivors, but officials announced that the search and rescue had been turned into a recovery operation.
Fox News said that, “blackouts at sea are uncommon, but they do happen and have long been viewed as a major accident risk for ships on the water. One cause of ship blackouts is contaminated fuel that can create problems with its main power generators, said Fotis Pagoulatos, a naval architect. He said a complete blackout could result in a ship losing propulsion and that smaller generators can kick in, but they are unable to carry all the functions of the main ones and take time to start.
The Wall Street Journal reports that “The owner of the Domino Sugar refinery at Baltimore’s port says the plant has six to eight weeks of raw sugar stockpiled at the facility and that it expects no short-term disruptions to its operations from the bridge collapse blocking the mouth of the harbor. The refinery, which boasts the last working smokestack on Baltimore’s increasingly residential waterfront, began operations in 1922. A spokeswoman for Domino owner ASR Group said a ship is currently unloading raw sugar at the refinery’s dock and another ship finished unloading on Monday.”
Natural gas continues to be one of the cheapest hydrocarbons on the planet. It’s good news for the industry that the Cove Point LNG export terminal is still operational because they really can’t afford to see anymore export terminals shutdown. The truth is that natural gas continues to be a bridge fuel for any energy transition and maybe that reality is starting to dawn on people. Even people in places like Berkeley CA..
The AP reports that, “The city of Berkeley, California, has agreed to halt enforcement of a ban on natural gas piping in new homes and buildings that was successfully opposed in court by the California Restaurant Association, the organization said. The settlement follows the 9th U.S. Circuit Court of Appeals’ refusal to reconsider a 2023 ruling that the ban violates federal law that gives the U.S. government the authority to set energy-efficiency standards for appliances, the association said in a statement last week. “While the Ninth Circuit’s ruling renders this particular ordinance unenforceable, Berkeley will continue to be a leader in climate action,” Berkeley City Attorney Farimah Faiz Brown said in an email to The Associated Press.
Read Full Story »»»
DiscoverGold
Natural Gas Bullish Weekly Reversal Signals Strong Potential for Higher Targets
By: Bruce Powers | March 26, 2024
• Natural gas shows bullish signs with a reversal above key levels, indicating potential for higher targets, first around 1.95 to 2.01.
A bullish reversal triggered today in natural gas as it got back above the 20-Day MA line (purple) and above the most recent interim swing high of 1.77. Further, a weekly bullish reversal was also triggered as last week’s high of 1.77 was exceeded to the upside. If natural gas can stay above the 20-Day line, currently at 1.77, it has a chance to test higher target levels.

Next Target Zone is 1.95 to 2.01
The next higher target zone looks to be around 1.95 to 2.01. That price zone includes the prior bottom of the downtrend at 1.95, please the 50-Day MA (orange), and the bottom of the descending trend channel (blue dash). In addition, the top of the range is from the most recent swing high on March 5. That high is now the neckline of a potential double bottom bullish reversal pattern. If Monday’s low of 1.59 continues to be the low of the most recent retracement, natural gas should continue to advance from that low.
Rising ABCD Pattern Symmetry at 2.08
A rising ABCD pattern hits its first target at 2.08 and identifies that price level as a key pivot. Either resistance is seen there, as it marks the point of symmetry between the two legs of the pattern, or buyers remain in control and there is a breakout through that price zone. If a breakout occurs, the next higher price zone is 2.17, the bottom boundary of a prior gap.
Of course, an advance above 2.17 puts the price of natural gas into the gap and increases the chance it might eventually fill. The second target from the ABCD pattern is at 2.21. It is derived by applying the 127.2% Fibonacci ratio to the AB leg of the pattern and then that new price distance is applied to the C point to identify a D target.
Potential Double Bottom
As noted above, a potential double bottom has now formed on the chart. A decisive rally above the mid-point at 2.01 triggers a pattern breakout. By taking the height of the pattern in price and adding it to the neckline, a target of 2.50 is calculated from the double bottom.
Read Full Story »»»
DiscoverGold
The Corn & Ethanol Report. Commodities Open Interest Rising
By: Daniel Flynn | March 26, 2024
We kickoff the day with Durable Goods Orders MoM, Durable Goods Orders ex Defense MoM, and Non Defense Goods Orders Ex air at 7:30 A.M., Redbook YoY at 7:55 A.M., S&P/Case-Shiller Home Price Index MoM & YoY, House Price Index, and House Price Index at 8:00 A.M., CB Consumer Confidence, Richmond Fed Manufacturing Index, Richmond Fed Manufacturing Shipments, and Richmond Fed Services Index at 9:00 A.M., Dallas Fed Services Index and Dallas Fed Services Revenues Index at 9:30 A.M., 42-Day Bill Auction at 10:30 A.M., 5-Year Note Auction at 12:00 P.M., and API Energy Stocks at 3:30 P.M.
Last week the National Association of Realtors reported that February existing home sales jumped by a stunning 9.5% from January. But compared to a year ago, sales were down 3%, marking the 31st consecutive month of year-over-tear declines. New Home Sales have been rising and helped offset some of the decrease in existing sales. The Census Bureau reported that new home sales in February eased by 0>3% from January but were 6 larger than a year ago to mark the 11th consecutive month of year-over-year gains. Combined existing and new home sales amounted to 5,042 million homes in February, and 8% increase from January but a 2% decline from 2023. Total home sales bottomed in November and have moved higher as mortgage rates neared 8% and improved as rates began to ease. Rates have eased below 7% in March, which is expected to improve homeowner demand.
In this holiday shortened week we will have a lot of quarterly reports and the key to spark the ignition to spark a fire in this complex. With Grain Stocks and Prospective Plantings on traders minds also going into the long weekend leaves the wildcard of South American exports and weather. We will keep you posted in any changes in the forecast. CBOT corn open interest rose 7,893 contracts, soybeans added 861 contracts, while wheat fell 2.957 contracts. The ongoing corn open interest rise is puzzling, but the weekly Commitment of Traders data shows that index funds have been expanding their net long position across a host of commodities as the US Central Bank prepares to lower rates. No major change in South America’s overall weather forecast, with estmations on Brazilian harvest is 70% complete and dry weather across Southern Brazil impacts winter corn.
Read Full Story »»»
DiscoverGold
Grains Report: Wheat, Rice, Corn and Oats, Soybeans, Canola and Palm Oil
By: Jack Scoville | March 26, 2024
• WHEAT
General Comments: Wheat was a little higher yesterday on news reports of a dispute between the Russian government and a private exporter named Rif. The dispute has held up shipments of at least 400,000 tons of grain so far. The reports indicate that the government is seeking more control of the exports and has made life very difficult on the private exporters in an effort to extract more sales and powers to the government. Russia is the worlds largest exporter and sets the world price. It looks like the current prices have accounted for most or all of the bad news to hit Wheat futures. USDA made no changes to its balance sheets last week. Big world supplies and low world prices are still around. Export sales remain weak on competition from Rusia, Ukraine, and the EU as those countries look to export a lot of Wheat in the coming period. Black Sea offers are still plentiful.
Overnight News: The southern Great Plains should get mostly dry conditions. Temperatures should be above normal. Northern areas should see mostly dry conditions. Temperatures will average near normal. The Canadian Prairies should see mostly dry conditions. Temperatures should average near normal.
Chart Analysis: Trends in Chicago are mixed. Support is at 537, 527, and 524 May, with resistance at 560, 567, and 572 May. Trends in Kansas City are mixed. Support is at 581, 567, and 561 May, with resistance at 602, 605, and 608 May. Trends in Minneapolis are mixed. Support is at 651, 645, and 641 May, and resistance is at 669, 677, and 681 May.
• RICE
General Comments: Rice closed lower yesterday, but recovered from its worst losses of the day in the second half of the session. Trends are down in this market. Good demand for export continues. The overseas markets feature less production in Brazil and India, and it appears that the lack of offer from these markets is supporting increased demand for US Rice and prices here in the US. It turned wetter and colder in the US last week and fieldwork will be much reduced.
Overnight News:
Chart Analysis: Trends are down with no objectives. Support is at 1685, 1672, and 1660 May and resistance is at 1744, 1751, and 1769 May.
• CORN AND OATS
General Comments: Corn was a little lower and Oats closed higher yesterday. Corn was weaker on ideas that the stocks report on Thursday will show ample supplies for this year and that the [planting intentions report will show that ample supplies will likely continue well into next year. Demand for Corn has been strong at lower prices. Big supplies and reports of limited demand are still around, but futures have been very oversold. Futures are much lower than just a few months ago and a short covering rally is increasingly expected and might be under way. Funds remain very large shorts in the market. Basis levels have started to firm in the US as processors look for supplies amid tight farmer holding patterns. The weather forecasts for Argentina are improving with drier weather expected this week after some big rains last week. More rain is forecast for central and northern Brazil, but dry weather is forecast for southern Brazil The planting progress reports to date indicate rapid progress and reports from Brazil indicate that the Winter crop has been mostly planted now.
Overnight News:
Chart Analysis: Trends in Corn are mixed. Support is at 432, 429, and 422 May, and resistance is at 446, 448, and 459 May. Trends in Oats are mixed to down with objectives of 350 May. Support is at 359, 353, and 349 May, and resistance is at 369, 374, and 376 May.
• SOYBEANS
General Comments: Soybeans and the products closed higher yesterday on what appeared to be fund short covering before the USDA reports are released on Thursday. Some buying was tied to forecasts for very dry weather in southern Brazil that could hurt developing crops. Brazil producers had been taking advantage on higher futures in the US and higher basis levels in Brazil, but the basis has fallen sharply in Brazil this week and sales have been less. Reports of great export demand in Brazil provide some support. Report indicate that China has been a very active buyer of Brazil Soybeans this season. Ideas that South American production is taking demand from the US have pressured futures lower. Funds remain very large shorts in the market. Basis levels in the US are reported to be firming as processors look for supplies and farmers remain tight holders. \Big rains were reported in Argentina last week but it should be drier there this week.
Overnight News:
Chart Analysis: Trends in Soybeans are mixed. Support is at 1181, 1175, and 1165 May, and resistance is at 1211, 1227, and 1233 May. Trends in Soybean Meal are mixed. Support is at 326.00, 320.00, and 317.00 May, and resistance is at 348.00, 352.00, and 357.00 May. Trends in Soybean Oil are mixed to down with objectives of 4630 and 4430 May. Support is at 4760, 4690, and 4620 May, with resistance at 4980, 6000, and 5030 May.
• CANOLA AND PALM OIL
General Comments: Palm Oil was lower yesterday on ideas of stronger production. The export pace is expected to continue to really improve but this is part of the price already. The Southern Peninsula Palm Oil Millers Association expects Malaysia’s palm oil production for March 1-20 to have risen 22%. Domestic biofuels demand is likely to improve. Ideas of weaker production ideas against good demand still support the market overall. The fundamentals of average demand against a weaker supply outlook are still around to keep prices supported. Trends are up on the daily charts. Canola was a little higher yesterday on a weaker Canadian Dollar. There were reports of big rains in Argentina, but forecasts for drier conditions now and improving weather in Brazil. Current forecasts call for generally improved growing conditions in Brazil this week.
Overnight News:
Chart Analysis: Trends in Canola are mixed to up with objectives of 653.00 and 662.00 May. Support is at 631.00, 619.00, and 610.00 May, with resistance at 652.00, 657.00, and 660.00 May. Trends in Palm Oil are mixed. Support is at 4240, 4130, and 4050 May, with resistance at 4310, 4340, and 4360 May.
Midwest Weather Forecast Mostly dry conditions. Temperatures should average near to above normal.
Read Full Story »»»
DiscoverGold
Softs Report: Cotton, OJ, Coffee, Sugar, Cocoa
By: Jack Scoville | March 26, 2024
• COTTON
General Comments: Cotton was a little higher yesterday as ideas of weaker export demand went against improving ideas of demand potential from China. It is too early to plant in Texas but the heat and dry weather raises concerns about production potential later in the growing season and blackened soils might not permit much planting, anyway. The demand news has been solid but reduced from previous levels in this market for the last several weeks. The US economic data has been positive, but the Chinese economic data has not been real positive and demand concerns are still around. However, Chinese consumer demand has held together well, leading some to think that demand for Cotton in world markets will increase over time.
Overnight News: The Delta will get showers and rains and near normal temperatures. The Southeast will see showers and near normal temperatures. Texas will have showers and rains and near to below normal temperatures. The USDA average price is now 85.86 ct/lb. ICE daily certified stocks are now 43,872 bales, from 41,756 bales yesterday.
Chart Trends: Trends in Cotton are mixed to down with objectives of 8520 and 7720 May. Support is at 90.80, 88.10, and 86.20 May, with resistance of 96.20, 97.70 and 98.40 May.
• FCOJ
General Comments: FCOJ closed a little lower last week despite reports of tight supplies. Florida said that Oranges production will be low, but above a year ago. Futures still appear to have topped out even with no real downtrend showing yet. Prices had been moving lower on the increased production potential for Florida and the US and in Brazil but is now holding as current supplies remain very tight amid only incremental relief for supplies is forecast for the coming new crop season. There are no weather concerns to speak of for Florida or for Brazil right now. The weather has improved in Brazil with some moderation in temperatures and increased rainfall amid reports of short supplies in Florida and Brazil are around but will start to disappear as the weather improves and the new crop gets harvested.
Overnight News: Florida should get scattered showers or dry conditions. Temperatures will average near normal. Brazil should get scattered showers and above normal temperatures.
Chart Trends: Trends in FCOJ are mixed to up with no objectives. Support is at 361.00, 347.00, and 353.00 May, with resistance at 378.00, 389.00, and 391.00 May.
• COFFEE
General Comments: Both markets closed higher yesterday and held to a trading range as the lack of Robusta Coffee in the market continues to support futures. Robusta offers from Vietnam remain difficult to find and the lack of offer of Robusta is a bullish force behind the London market action. Vietnamese producers are reported to have about a quarter of the crop left to sell or less and reports indicate that Brazil producers are reluctant sellers for now after selling a ot earlier in the year. Brazil weather continues to improve for Coffee production and conditions are called good. Rains continued to fall in parts of Brazil Coffee areas.
Overnight News: ICE certified stocks are higher today at 0.560 million bags. The ICO daily average price is now 188.12 ct/lb. Brazil will get mostly scattered showers with near normal temperatures. Central America will get mostly dry conditions. Vietnam will see scattered showers
Chart Trends: Trends in New York are mixed. Support is at 183.00, 179.00, and 178.00 May, and resistance is at 188.00, 190.00 and 194.00 May. Trends in London are mixed to up with objectives of 3420, 3520, and 3590 May. Support is at 3320, 3290, and 3220 May, with resistance at 3430, 3460, and 3490 May.
• SUGAR
General Comments: New York and London closed a little higher yesterday. Ideas of weaker demand are around the market and are causing some selling, but producers do not appear to be selling much. Indian production estimates are creeping higher but are still reduced from recent years. There are worries about the Thai and Indian production. Offers from Brazil are still active but other origins. are still not offering in large amounts except for Ukraine. Demand reports from Europe have been strong.
Overnight News: Brazil will get rains in the south and scattered showers in the north. Temperatures should average above normal. India will get mostly dry conditions and below normal temperatures.
Chart Trends: Trends in New York are mixed. Support is at 2110, 2030, and 1930 May and resistance is at 2230, 2260, and 2290 May. Trends in London are up with objectives of 654.00, 676.00, and 698.00 May. Support is at 619.00, 612.00, and 604.00 May, with resistance at 653.00, 663.00, and 670.00 May.
• COCOA
General Comments: Futures were higher again yesterday and kept the incredible rally going on production concerns in West Africa as well as demand from nontraditional sources along with traditional buyers. Production in West Africa could be reduced this year due to the extreme weather which included Harmattan conditions. The availability of Cocoa from West Africa remains very restricted and projections for another production deficit against demand for the coming year are increasing. Ideas of tight supplies remain based on more reports of reduced arrivals in Ivory Coast and Ghana continue. Demand continues to be strong, especially from nontraditional buyers of Cocoa.
Overnight News: Isolated showers are forecast for West Africa. Temperatures will be near normal. Malaysia and Indonesia should see scattered showers. Temperatures should average near normal. Brazil will get isolated showers and above normal temperatures. ICE certified stocks are higher today at 4.119 million bags.
Chart Trends: Trends in New York are up with objectives of 9200 and 9970 May. Support is at 8420, 7710, and 6980 May, with resistance at 9720, 9840, and 9960 May. Trends in London are up with no objectives. Support is at 6960, 6500, and 6040 May, with resistance at 8600, 8720, and 8840 May.
Read Full Story »»»
DiscoverGold
Commodities Daily Market Movers (% Price Change)
By: Marty Armstrong | March 26, 2024
• Top Movers
Eggs 10.65 %
Cocoa (NYCSCE) Futures 7.94 %
Palm Kernel Oil 3.21 %
Soybean Oil CBT Futures 2.9 %
Coconut Oil 2.65 %
• Bottom Movers
Tokyo Rubber Futures 3.75 %
AU - Victoria Base-Load Electricity Futures 2.89 %
London Nickel Spot 1.91 %
Rough Rice Futures (CBOT) 1.73 %
Oats (Minneapolis) 1.65 %
*Close from the last completed Daily
DiscoverGold
Year-to-date commodities and the Nikkei are leading traditional financial markets
By: Markets & Mayhem | March 26, 2024
• Year-to-date commodities and the Nikkei are leading traditional financial markets.

Read Full Story »»»
DiscoverGold
$LUMBER $WOOD #Commodities - 'Broadening' Plot
By: Sahara | March 26, 2024
• $LUMBER $WOOD #Commodities - 'Broadening' Plot.
Looking for a B/Out which would target $156. Mthly 20/MA (Blue) is considered spprt...

Read Full Story »»»
DiscoverGold
Roasted Chickens. The Energy Report
By: Phil Flynn | March 26, 2024
You all know that old saying that ‘the chickens come home to roost’ is sadly taking part in the global oil market and the scariest thing is there is not a lot of bearish news anywhere you look. Just a lot of chickens or roosters – whatever. The seasonal gas price rise along with declining global inventory and reduced refining capacity has AAA calling for gas prices to hit $4.00 a gallon this summer, the highest level since 2022.
This comes as Russia showed its commitment to OPEC production cuts as Vladimir Putin laid down the gauntlet to the Russian oil producers decreeing that they have to reduce oil output to 9 million barrels a day by the end of June. Knowing Putin, they better comply if they know what’s good for them. OPEC also announced that they would continue with their production levels and will confirm that at their April 3rd meeting.
This comes with reports about falling US oil output and conflicting predictions on whether the heavy-handed regulatory environment is going to cause a drop in future US oil production. Regardless, the Biden Team must be starting to worry as they are running out of options to cool off red-hot pump prices. Instead of dealing with reality, they doubled down on their job-killing and environmental electric car push based on political ideology and not on science.
So, Biden’s plan to refill the strategic reserve at $67.00 a barrel to $70.00 a barrel is starting to unwind and for strictly political purposes Biden may have to tap the reserve again to try to save his presidency. Under Biden, Iranian oil production has hit record highs and he’s turning a blind eye to Venezuelan oil sanctions that he lifted in return for what was supposed to be a free and fair election that never happened. Still this morning Bloomberg reports that India may cut purchases of Venezuelan oil ahead of the Biden waiver that expires on April 18th and is probably good news for Russia.
While the US energy industry has squeezed more blood out of every oil rig, there are more questions about whether the techniques that the producers have used in the shale patch are going to start giving us diminishing returns. Goldman Sachs came out with a report suggesting that U.S. oil production had declined by 400,000 barrels a day since December to 12.6 million barrels a day. This number doesn’t agree with the headline number from the Energy Information Administration (EIA) which they have already started to revise downward.
Yet Macquarie Group Ltd. is once again betting on the ingenuity of the US oil and gas industry to overcome obstacles. Macquarie is predicting that US energy production will hit 14.5 million barrels a day as falling costs and improved drilling efficiency overshadow subdued growth plans from publicly listed companies. That’s higher than EIA’s call for 13.2 million barrels a day. Macquarie stood out among analysts last year with its projection of increased US shale production and ultimately was proved correct. Its latest forecast comes as shale oil explorers are vowing to rein in production growth for a fourth straight year and consolidation in the industry presents headwinds to further growth. The US government expects production to edge up to 13.2 million barrels a day this year.
The devastating and heartbreaking news of the cargo ship hitting the Francis Scott key bridge in the port of Baltimore could have ramifications for a lot of commodities today. The Port of Baltimore is the second-largest port in the United States for coal exports, shipping about one-fifth of the country’s coal exports. In 2023, the port’s top export destinations were Australia, India, Belgium, Japan, and the Netherlands. Our prayers are for all of those involved in this horrific event.
What’s so much bullish news the market may need to take a breath. Inventories today in the Energy Information Administration aren’t expected to be overly bullish. We are looking for slight draws across the board. Some people think that the report has to make up for under-reporting drawdowns last week. We shall see but guesses are all over the board. The thing to remember is that even if we get builds in supply, we’re still below and behind the 8 ball heading into the summer driving season.
The attacks on Russian refineries caused the diesel crack to outperform gasoline but it’s going to be a cat and mouse game as refiners have to decide what type of product they’re going to need to meet demand. In the meantime, the possibility of a gasoline price spike continuing is very very high and while AAA is looking for $4.00 this summer, it could go higher if we see any supply disruptions around the globe. Hedge funds are starting to embrace the long side of the market after fighting this market every step of the way. We’re afraid that the prices are going to have some making up to do as it seemed to ignore bullish fundamentals in the past and now we will have to pay the price in the future for that lack of vision.
Yet now according to John Kemp, the oil market has seen a frenzy of hedge fund buying. He wrote that, “LONDON, March 25 (Reuters) – Investors have purchased oil at the fastest rate for more than four years, amid optimism that Saudi Arabia and its OPEC? allies will continue to restrict production while an improving economic outlook boosts consumption.
Ukraine’s drone attacks on oil refineries and export terminals in Russia, which threaten to disrupt production and exports of both crude and fuels, have turbocharged the shift in sentiment to more bullishness. Over the seven days ending on March 19, hedge funds and other money managers purchased the equivalent of 140 million barrels in the six most important futures and options contracts linked to petroleum prices.
The buying was the fastest since December 2019, and among the ten fastest weeks since records began in 2013, according to position reports filed with exchanges and regulators.
Another bad day for natural gas prices and US producers. The Freeport LNG export terminal being down for extended maintenance and other maintenance issues is going to increase the glut of natural gas. We still want to short on the front end. We expect to see more production cutbacks in the natural gas space. Do you think that there’s any chance that the Biden administration will provide a bailout for the US natural gas industry. I doubt it.
Read Full Story »»»
DiscoverGold
Natural Gas Bears Remain in Control as Retracement Continues
By: Bruce Powers | March 25, 2024
• Natural gas triggered a bearish trend signal below 1.64, hitting a low of 1.59 before an intraday bounce.
Natural gas triggered a bearish trend continuation signal on Monday on a drop below the recent interim swing low of 1.64 (B). A low of 1.59 was hit before support kicked in, leading to an intraday bounce. The decline took the price of natural gas to a five-week low, but just barely. Five weeks ago, support was seen that the week’s low of 1.594.
Downward momentum is increasing, which can be seen by looking at the relationship of recent daily highs to the 20-Day MA. Look at how today’s high did not get as close to the 20-Day line as the prior two days. In other words, natural gas is weakening, and that change can be seen relative to the 20-Day line.

Next Support Looks Like 1.58
The next lower potential support level is around the minor swing low of 1.58 from February 23. A more significant target is 1.55. That lower level comes from a declining ABCD pattern where the CD leg of the pattern uses is 61.8% (Fibonacci ratio) of the AB leg. The next lower target based on the ABCD pattern is taking 78.6% ratio of the AB leg when drawing the CD leg of the pattern. It comes in at 1.49. If reached, natural gas would have first triggered a bearish continuation of the long-term downtrend as the most recent trend low was 1.52 from February.
Potential for Double Bottom
Regardless of the bearish outlook the possibility exists for a second bottom with the current retracement. That could set up a potential double bottom pattern. It will depend on what happens next. If a sustainable bullish reversal is seen prior to breaking below the 1.52 trend low, then a potential double bottom pattern would be forming.
New Trend Low Target of 1.49
A second scenario might occur from the 1.49 target. If reached, natural gas would have dropped below the 1.52 trend low and triggered a bearish trend continuation. However, the 1.49 target as potential support is given added significance since that price is also the 127.2% Fibonacci extension of the full upswing from the prior trend low from April 2023. When two approaches identify the same or similar price level, it should be given added attention.
Read Full Story »»»
DiscoverGold
The Corn & Ethanol Report
By: Daniel Flynn | March 25, 2024
We kickoff the day with Building Permits Final and Building Permits MoM at 6:20 A.M., Fed Bostic Speech at 7:25 A.M., Chicago Fed National Activity Index at 7:30 A.M., New Home Sales and New Home Sales MoM at 9:00 A.M., Dallas Fed Manufacturing Index and Fed Cook Speech at 9:30 A.M., Export Inspections at 10:00 A.M., 3-Month & 6-Month Bill Auction at 12:00 P.M., and Cold Storage at 2:00 P.M.
The market is now keying on Thursday’s Prospective Plantings and Quarterly Grain Stocks. Also, the EIA will update US biodiesel operation capacity and feedstock on Friday. Position squaring and risk reduction will be featured with the Prospective Plantings, which historically produce more volatility. Katy Bar the Door and buckle up your chinstrap. US corn estimate’s 91.9 Mil Acres of corn seeding with stocks coming in at 8,427 Mil Bu. Soybean seedings are expected at 86.5 Mil acres with stocks at 1,828 Mil Bu. Wheat will be a wildcard as spring and winter wheat are still being tabulated. The one thing this report will solve any doubts on whether the US produced a record corn yield in 2023.
Read Full Story »»»
DiscoverGold
Bases Loaded. The Energy Report
By: Phil Flynn | March 25, 2024
Oil prices are building a base over $80 a barrel as global supplies tighten, the US rig count falls and geopolitical risk rises. The energy gloves are off as Russia retaliates from Ukraine’s attacks on their oil refineries by attacking Ukraine with hypersonic missiles on their energy infrastructure. Reports say as much as 25% of Russia’s refining capacity could be shut down at a time when global supplies of diesel and gasoline are below average for this time of year.
This comes after the horrific Friday terror attack on a concert hall near Moscow that Russia blames on Ukraine, but it appears it was an attack by a rejuvenated ISIS. Russia lashed out with aggressive attacks on Ukraine’s energy infrastructure. Russia attacked critical infrastructure in Ukraine’s western region of Lviv with missiles early on Sunday, Kyiv said, in a major air strike that saw one Russian cruise missile briefly fly into Polish airspace, according to Warsaw as reported by Reuters.
Reports say as much as 25% of Russia’s refining capacity could be shut down at a time when the global supplies of diesel and gasoline are below average for this time of year. Reuters reported that Russian oil refining capacity that was shut down in the first quarter due to Ukrainian drone attacks on at least seven refineries amounts to about 4.6 million tons (370,500 barrels per day), or some 7% of the total, Reuters calculations show, on top of maintenance related to other causes. The United States has urged Ukraine to halt drone strikes on Russian energy infrastructure, warning they risk provoking retaliation and driving up global oil prices, the Financial Times reported on Friday, citing people familiar with the matter. Russia’s oil refining production forecast for 2024 remains unchanged and close to last year’s level of around 5.5 million barrels per day, Energy Minister Nikolai Shulginov said on Wednesday.
While things heat up between Russia and Ukraine, the Red Sea attack risks are still high even as Israel reportedly gave a proposal to Hamas for a ceasefire that could allow for the release of 40 hostages held by Hamas. This comes as Israel attacks the hospital hideout of the Hamas terrorists who used hospitals as a shield.
Oil Price reported that the total number of active drilling rigs for oil and gas in the United States fell by 5 this week, according to new data that Baker Hughes published on Friday, bringing the total rigs gained this year to just 2. The total rig count fell by 5 to 624 this week, compared to 758 rigs this same time last year. The number of oil rigs fell by 1 this week after seeing a gain of 6 in the week prior. Oil rigs now stand at 509–down by 84 compared to this time last year. The number of gas rigs also fell this week, by 4 to 112, a loss of 50 active gas rigs from this time last year. Miscellaneous rigs stayed the same at 3.
Natural gas prices are trying to find a bottom and there is some criticism of natural gas producers that they didn’t react fast enough to the warm temperatures and the lack of demand thereby creating a glut. But maybe it’s possible that natural gas producers are going to get smarter in the future with the use of artificial intelligence. Last week reports said that EQT the country’s largest natural gas producer announced a deal to buy pipeline equations and streams according to Barrons. They wrote that artificial intelligence is the hottest theme in investing right now, and its growth could boost even the prospects of the latest major energy deal. EQT, the country’s largest natural gas producer, announced a deal on Monday to buy pipeline company Equitrans Midstream. The $35 billion merger will create a behemoth that controls nearly every step from getting natural gas out of the ground to delivering it to customers. Shares of EQT were down 8% on Monday, partly because it will be taking on billions of dollars in Equitrans’ debt. Equitrans shares were up 2.7%. EQT says it can pay down the debt quickly. Executives also highlighted the growth possibilities from the deal. EQT CEO Toby Rice said on a conference call after the acquisition was announced that the growth in demand from data centers used to run AI applications could boost the fortunes of the most important pipeline that EQT is buying.
Read Full Story »»»
DiscoverGold
$CRB #Commodities - 'Cup & Handle'...
By: Sahara | March 25, 2024
• $CRB #Commodities - 'Cup & Handle'...

Read Full Story »»»
DiscoverGold
Signs of Weakness Emerge on Natural Gas
By: Bruce Powers | March 22, 2024
• Natural gas prices show weakness, consolidating within a range. Resistance at 8-Day MA suggests a market shift. Key support at 1.64 holds for now, but a failure could trigger a downtrend.
Natural gas remains in a consolidation range that is starting to show further signs of weakness. Up until Wednesday natural gas was consistently running into resistance around the 20-Day MA. Then, on Thursday resistance was seen near the shorter 8-Day MA, which is more sensitive to price movements. This relationship reflects a weakening market.

Declining ABCD Pattern Points to 1.64
Nonetheless, the price of natural gas remains above the key near-term support level at 1.64. That price level is a swing low that is potentially part of the developing uptrend price structure of higher swing lows. If it fails to hold then natural gas would be moving into a declining ABCD pattern in the short-term (see chart). An early downside target of 1.55 is identified as it completes 61.8% of the price decline seen in the first AB leg down. Similarly, using the 78.6% Fibonacci ratio arrives at 1.49, which happens to match a second Fibonacci extension price. A 127.2% extension of the full advance up from the prior trend low hit in April 2023, is also 1.49. Both a short and long-term Fibonacci measurement points to the same price target.
Fibonacci Says 1.49
We could see an undercut and run strategy set up if the 1.49 level is reached. It is under the most recent trend low of 1.52 and above the historical low of 1.44. It would be a perfect spot to see a bullish reversal once stops get hit from the decline below 1.52. Two Fibonacci levels lining perfectly like that is the market telling us to pay attention. An undercut and run strategy first looks for a continuation of the dominant near-term trend, which takes out weak holders and triggers stops. If price quickly reverses (relative) and closes above the prior trend low, it gives a strong bullish signal. Keep in mind that this is an aggressive strategy.
Weekly Price Levels
In the near-term, if the 1.64 level is broken and the price of natural gas continues to decline. Note that such a drop would also trigger a bearish continuation on the weekly chart. The four-week low of 1.59 would then provide the next lower target in the weekly time frame.
Read Full Story »»»
DiscoverGold
More Food Inflation Is Coming
By: Tom McClellan | March 22, 2024

Inflation numbers of all sorts have calmed down since the wild days of Covid shutdowns messing up the supply chains. But inflation numbers for at least the food category are about to see another surge upward.
That is the message of this week's chart, which shows how the movements of gold prices tend to get echoed about a year later in the prices of wheat futures. This principle also works for corn prices (not shown). Because grains are an important input into lots of finished products for food, including meat, a rise in grain prices generally is going to lead to rising food prices.
Gold prices bottomed on a monthly basis in October 2022, and have been rising strongly since then. And wheat prices bottomed almost a year later, in September 2023, starting to rise on gold schedule. But just recently wheat prices have fallen just a little bit, taking them off of gold's script. I expect wheat prices generally to get back on track again and start rising for at least the next 12 months, following in gold's footsteps.
This relationship occasionally goes off track in a much bigger way, when a weird exogenous event puts a thumb on the scale. Covid is a great example. The 2008 commodities bubble is another, when all of Wall Street suddenly went mad for commodities indexing (because stocks no longer worked in 2008). Outside of conditions like that, this is a pretty durable relationship.
And the 12 month leading indication for food prices generally also works with gold, as seen in this next chart.

This shows the Consumer Price Index (CPI) subindex for food and beverage compared to gold prices, and with the same 12 month lag time employed. These CPI data are reported with their own lag, but reflect what was happening as of the month for which each datum is recorded. The overall correlation with gold is not as tight as it is for wheat, but the timing of the up and down movements still generally matches up.
Falling food prices (through Feb. 2024, the most recent available) reflect the drop in gold prices just over a year earlier. We are not yet seeing an upsurge in this measure of food inflation quite yet, in part because wheat and corn prices have fallen in the past 8 months. But another rise should be coming, assuming that this relationship continues to work as it has been working for the almost 50 years that gold has been freely traded in the U.S.
The latest FOMC meeting announcement, and Chairman Powell's comments afterward, indicate that the Fed officials think that they are getting inflation under control, and so their interest rate targets can presumably start falling sometime in 2024. They are soon going to find out that gold's message means more inflation generally is coming.
Tom McClellan
Editor, The McClellan Market Report
Read Full Story »»»
DiscoverGold
False Peaks. The Energy Report
By: Phil Flynn | March 22, 2024
Whether it’s peak oil production or peak oil demand, it appears the peak theories have once again come crashing back to the market-based realities. Twenty years ago or so, I used to give presentations explaining to a skeptical crowd that the world was not going to run out of oil in the near term or even the long term. The simple explanation was that high prices would cure high prices and when they got high enough, they would find plenty of oil. This so-called finite resource would eventually be found on land and sea in places yet undiscovered. Besides 71% of the earth’s surface is covered by water so there is still plenty of oil discoveries to be made when the price is just right. That’s on top of the 1.56 trillion barrels of proved crude oil reserves, excluding oil sands that we already know about.
Of course, in the last couple of years, the so-called peak freaks have reversed course in predicting that global demand has already peaked and that we would see demand for crude oil start to fall as the world moved to more unreliable forms of alternative energy and started to drive electric cars that would be powered by alternative clean energy source or perhaps fairy dust. Yet despite spending untold trillions of dollars to force us out of our internal combustion engines and try to force investment out of fossil fuels, oil demand will hit an all-time high next month.
Yesterday it was the Energy Information Administration (EIA) that had to increase its price projections for crude oil and petroleum products for the remainder of 2024. They also had to lower their forecast for world oil production in the second quarter of 2024 (2Q24) to 101.3 million barrels per day (b/d) in March. While the EIA blames the extension of the OPEC production cuts for the reason for the change, the reality is that it was clear to most market watchers that OPEC would stay the course and extend cuts even when their last report was released. The EIA also predicts a global supply versus demand deficit, which the Energy Report has been predicting all along. The EIA says that, “the draw on global oil stocks during 2024 will keep Brent crude oil prices elevated, averaging $88/b in 2Q24, $4/b higher than we had forecast in the February STEO. Prices will remain relatively flat for the rest of the year before falling to $82/b by the end of 2025 as OPEC+ supply cuts expire and production increases.”
Yet OPEC cuts or no OPEC cuts, what this report tells you is that the only spare oil production capacity of note in the world is in the OPEC cartel. What that means is that traders buffer against supply shocks in a world where global demand is going to be at record highs has to be at one of the lowest levels in history. That increases the possibility of sudden and violent price spikes if we see a major outage or disruption.
The EIA acknowledges the geopolitical risk factors as a wild card that could spike prices. They point out that, “No crude oil or product tankers have been lost because of the ongoing attacks on commercial shipping in the Red Sea, but many ships are rerouting to avoid the area. Rerouting lengthens the trip and increases costs. Attacks continue to threaten ships that transit the Red Sea, which could increase prices further.
They also warn that, “Stronger demand growth than our forecast would reduce global stocks and raise oil prices, just as less demand growth would increase global stocks and reduce prices.” Now if you look at the fact that both the EIA and the International Energy Agency have underestimated demand, this becomes a real market risk. That is especially true after the Fed seemed intent on its path to cutting interest rates.
The EIA also had to raise their gasoline price forecast as well by $0.20 a gallon for June, July and August from their last estimate as they forecast driving activity—measured by vehicle miles traveled (VMT)—will increase to all-time highs in the United States during 2024 and 2025.”
Yet at the same time, they seem to pin their hopes that Biden’s electric car push will keep gas prices under control. They say that, “Despite our forecast of more driving, increased fleetwide vehicle fuel efficiency will keep motor gasoline consumption relatively flat through 2025.” Good luck with that.
So now if you look at West TX intermediate oil, a few weeks ago it was a battle to get above $80 and now it’s a battle to stay above $80. Technically the market looks ripe for a correction. It also looks like it’s consolidating, potentially setting the stage for another major upside price move. It is possible that this is going to be a staging area for a move up towards $85 and eventually testing $90.00 a barrel. Some technical analysts are pointing to the golden cross formation. Blomberg reported that the WTI crude oil approaching a Golden Cross formation with a cross of the 50-day and 200-day moving average. The last Golden Cross signal saw oil soar to its highest prices since August/September 2022.
It’s getting harder to hide the looming global oil supply deficit. And while prices may be restrained on reports of a potential ceasefire deal between Israel and Hamas, the reality is that we’re going headlong into an oil shortage. You can’t blame OPEC completely because even if they pumped all out, the corresponding drop in price would lead to a demand surge that would push us to the brink without any spare capacity in the globe. In some ways, OPEC is showing the world a favor by keeping some barrels in reserve and keeping prices elevated because without that, we could see prices spike even higher. If you look back at it the major failure that has led us to the brink of a potential price spike has been the misguided policies of the ESG movement and the green energy movement. The government can inspire us to move in one direction or another but it has to be based on reality and market-based fundamentals.
While the diesel crack collapsed, the gasoline crack seemed to be heating up. And with the real possibility of a supply deficit building, that should keep refiners busy. The FT is reporting that the Biden Whitehouse is telling Ukraine to stop attack Russian oil facilities. The FT says that “The repeated warnings from Washington were delivered to senior officials at Ukraine’s state security service, the SBU, and its military intelligence directorate, known as the GUR, the people told the Financial Times. Both intelligence units have steadily expanded their own drone programs to strike Russian targets on land, sea and in the air since the start of the Kremlin’s full-scale invasion in February 2022.
One person said that the White House had grown increasingly frustrated by brazen Ukrainian drone attacks that have struck oil refineries, terminals, depots and storage facilities across western Russia, hurting its oil production capacity.” Must read
Natural gas prices really can’t get a break. Even with the late winter blast the possibility of another Freeport LNG outage is weighing on the concerns of natural gas producers as it could create another glut especially if it is an extended outage. EBW analytics reports that although Henry Hub spot prices have rebounded on increased heating demand early this week, last week’s extreme weakness may be an early warning sign for the April contract ahead of next week’s final settlement. The storage surplus vs. the five-year average, after adding 525 Bcf since late January, may finally peak this week as extreme blowtorch weather dissipates. Still, even with weather-driven demand edging higher this week and potential Bakken freeze-offs into late March, it may take several weeks to gradually erode a North American storage surplus that has ballooned to 900 Bcf. While the long-term fundamental outlook is strengthening, it will require a prolonged period of low natural gas prices this spring to maintain price-induced power sector demand and incentivize producers to keep supply off the market.
Read Full Story »»»
DiscoverGold
Agriculture Daily Market Movers (% Price Change)
By: Marty Armstrong | March 22, 2024
• Top Movers
Orange Juice (NYCE) Futures 3.03 %
Cocoa (NYCSCE) Futures 2.82 %
Coffee (NYCSCE) Futures 1.81 %
White Sugar ICE Futures 1.78 %
Sugar World (CSCE) Futures 1.33 %
• Bottom Movers
Cheese 4.14 %
Palm Kernel Oil 2.02 %
Lean Hogs (CME) Futures 1.31 %
Rough Rice Futures (CBOT) 1.02 %
Canola Futures 0.88 %
*Close from the last completed Daily
DiscoverGold
Natural Gas Downtrend is Clear but Rally Above This Week’s High is Bullish
By: Bruce Powers | March 21, 2024
• Despite recent weakness, natural gas shows potential for a bullish ABCD pattern, contingent on staying above 1.64.
Natural gas continued to weaken on Thursday, following a bearish day on Wednesday. It continues to respect the recent swing low support at 1.64 (C), however. If it continues to stay above that swing low there remains a chance for a rising ABCD pattern to follow through. It recently set up with that swing low but only if it continues to be a swing low. A drop below 1.64 would violate the pattern as point C would move to a new swing low, whenever that occurs. And only if the price of natural gas stays above the latest trend low at 1.52 (A).

Stuck in Consolidation Range from 1.64 to 1.77
The last five days of trading occurred within a consolidation range defined by the high and low levels seen on March 14 and 15. It shows a range from 1.64 to 1.77. Today would have been a perfect day for more serious selling to occur following Wednesday’s decline and break below the prior day’s low. if it was going to do so eventually, this would be the day. Instead, natural gas fell below yesterday’s low to 1.65, where it found support and rallied. It continues to advance towards the open at the time of this writing.
Today’s Range Provides Near Term Price Levels
Today’s high and low provide price levels to use to identify the next direction for natural gas. If the high of 1.77 is exceeded there is a chance it will continue to strengthen, at least towards the top of the range. The low today is 1.65. If that price level fails to maintain support the chance for a test and possible decline below the recent swing low of 1.64.
Recent Price Action Rallying into Resistance is Bearish Behavior
As discussed previously, natural gas is in a clear downtrend in all time frames. Since it failed to rally above resistance at 2.01 recently, the chance for a bearish continuation remains a real possibility. That price zone previously represented support. So, support becomes resistance, which is a sign that downtrend is showing signs of continuing. Further, the 20-Day MA failed to maintain support on March 12, and it has marked resistance on each of the past five days.
Advance Above 1.77 is Bullish
Sometimes when a pattern is very clear, the opposite of what is expected occurs. That may or may not happen in this case. The market is clearly showing bearish signs but that changes in the short term on a rally above this week’s high of 1.77, assuming that is the high for the week.
Read Full Story »»»
DiscoverGold
thanks for the info,i appreciate it and you!!
Republicans Call Out the IEAs. The Energy Report
By: Phil Flynn | March 21, 2024
For years in my daily Energy Report on many occasions, and the Fox Business Network, I have called out the International Energy Agency’s (IEA) questionable data that seemed not so much based on facts but trying to push its big green energy agenda. Now it appears that House Republicans are doing the same, mirroring almost the same words and thoughts from some of my previous Energy Reports. In a letter to the Executive director of the International Energy Agency Fatih Birol, Republicans said that they ‘are concerned that the IEA has strayed from its core mission-promoting energy security. Wow! They took the words right out of my mouth or from a previous Energy Report but no matter, they are right to call them out as this has become a major issue as their dereliction of duty has become a threat to world energy security as well as US national security.
Some readers thought that my criticism of the IEA was just sour grapes on my part because the misreporting of supply and demand would impact my commodity positions. Ok, while there might be some truth in that the real reason was that I believe this continual underreporting of demand and over-estimation of supply was a blatant attempt to discourage investment in fossil fuels that would lead the world into an energy crisis and threaten the global economy and security putting undo burdens on the poor and the middle class of the world. But not to be negative. I did assure you that the green energy elites would be ok. I also stated that this green energy agenda would lead to global instability and sadly that has already begun to happen.
House Republicans agreed. Their words that could have been taken from my report saying, “In recent years the IEA has been undermining energy security by discouraging sufficient investment in energy supplies specifically oil natural gas and coal. Moreover its energy modeling no longer provides policymakers with balanced assessments of energy and climate proposals. Instead, it has become an energy transition cheerleader.” House Republicans went on to say that, “until recently the IEA has served as a valuable source of reliable information on the security of oil markets and it has provided A mechanism whereby oil-consuming countries can respond effectively to oil shortages. The IEA also provides global energy forecasts as part of its mission. They said, “As you have noted IEA forecasts have a tremendous influence on shaping how the world sees future energy needs consequently the IEA must conduct its energy security mission in an objective manner we believe that the IEA is failing to fulfill these responsibilities.”
House Republicans go on to say by its admission the IEA has placed greater emphasis on building net emission energy systems to comply with internationally agreed climate goals”. Yet I think it would be much better to tell the truth even if you think your massive big green energy donors and advocates can’t handle the truth because it destroys the hypocrisy and real dangers of its green energy agenda.
There is also a danger that gasoline prices will continue to go up as the surplus of gasoline supplies has disappeared according to the Energy Information Administration (EIA) weekly report. One of the problems with supplies being below normal if you have any hiccups in the system, it creates price increases and that is what we are seeing. Major refinery outages and demand that’s been better than expected have kept gasoline supplies tight. Even as gasoline demand slipped week over week causing the futures to pull back, the reality is that the supply surplus is gone. Now supplies have hit the lowest level of the year. That is the seventh straight week that gasoline supplies have fallen according to “Quantum Commodity Intelligence.” They pointed out the gasoline exports surged 21 million barrels a day for only the second time this year and said that Inventories fell by 3.3 million barrels or 1.4% to 230.7 million barrels in the week to 15 March, and their lowest since late December.
The pace of destocking slowed, however, and inventories inched back above their year-ago level but remained around 2% below their five-year average for the week. Stocks fell in every region, led by a 1.8 million barrel (-2.3%) draw in the US Gulf, where inventories slumped to a three-year low of 76.6 million barrels. That was followed by a 580,000 barrel draw in the Midwest, where BP has only just restarted its Whiting refinery after a six-week unplanned outage. Midwest refinery runs jumped 311,000 bpd on the week to 3.9 million bpd, their highest since the outage at the start of February. US-run rates inched 0.8% higher to 15.8 million bpd.
Also, the weak demand narrative for oil disappeared in yesterday’s Energy Information Administration report should demand robust. The EIA said that demand based on total products supplied over the last four-week period averaged 20.1 million barrels a day, up by 2.2% from the same period last year. Over the past four weeks, motor gasoline product supplied averaged 8.8 million barrels a day, up by 0.3% from the same period last year. Distillate fuel product supplied averaged 3.7 million barrels a day over the past four weeks, down by 1.9% from the same period last year. Jet fuel product supplied was down 0.2% compared with the same four-week period last year.
It seemed like oil prices were less excited yesterday about the Federal Reserve’s more dovish take on inflation and interest rates. Other markets like copper, platinum, platinum and silver exploded after the Fed’s outlook but oil struggled partly because in recent weeks we have seen these others metals fall in anticipation that the Fed was going to be more hawkish. Well it is still near the highs. Petroleum products were also overbought while the others were oversold. We’re looking for oil and products to consolidate for another leg higher so try to position yourselves on pullbacks from longer-term positions in the short term we expect to see some pretty good swings so day traders should start to have a lot of fun.
It seems like natural gas just can’t get a break after getting a little bit of a boost with winter returning. Now it has to face the fact that the Freeport LNG export facility is having more problems as we all remember the shutdown of the Freeport LNG export terminal caused natural gas to plummet from $11.00 when it’s shut down. Hart Energy reports that, “Freeport LNG on March 20 said its Train 2 liquefaction unit at the Texas plant has been shut down, while Train 1 will be taken down imminently as it expects inspections and any subsequent repairs at both the units to be completed by May. “It was during the January freeze that damage occurred in one of the Train 3 motors. Once we understood the cause of the damage, we knew it would be prudent to take proactive steps to inspect our other two trains,” a company spokesperson told Reuters in an email. Freeport said its Train 3 was now online and producing LNG. Each liquefaction train at Freeport can turn about 0.7 Bcf/d of gas into LNG. Earlier in the day, the company said that after maintenance work, Freeport LNG’s production capacity will increase by 10% from 15 million metric tons (MMmt) a year to just over 16.5 MMmt a year roughly by June. Additionally, the company’s Train 4, which has received all regulatory approvals, will add another 25% of LNG production capacity when it becomes operational, it said. Outages at Freeport LNG, the third-biggest LNG export plant in the United States.
Read Full Story »»»
DiscoverGold
Agriculture Daily Market Movers (% Price Change)
By: Marty Armstrong | March 21, 2024
• Top Movers
Cocoa (NYCSCE) Futures 3.7 %
Soybean Meal CBT Futures 2.58 %
Canola Futures 2.22 %
Soybeans Futures (CBOT) 2.02 %
Soybean Oil CBT Futures 1.79 %
• Bottom Movers
Orange Juice (NYCE) Futures 2.79 %
Wheat #2 1.47 %
Wheat CBT Futures 1.34 %
Cotton #2 (NYCE) Futures 1.24 %
Cotton 1.11 %
*Close from the last completed Daily
DiscoverGold
Natural Gas Critical Resistance at 20-Day MA Leads to Selloff
By: Bruce Powers | March 20, 2024
• Natural gas faces resistance at 20-Day MA after five days of failed rallies, indicating a possible shift to bearish momentum.
There have been five consecutive days of rallies into resistance around the 20-Day MA and each time price has been rejected to the downside. Today is the fifth but with one important difference relative to the previous three days. Trading has occurred below yesterday’s low, and natural gas is on track to close below that low, which was 1.70. This would indicate greater weakness than what was seen in the past couple of days when the lows were above the prior day’s low and the close was green, above the open.

Sellers Back in Control
Today’s drop indicates that the sellers are back in control. After five days of failing to break through the 20-Day line supply became more aggressive, driving prices lower. That is a change in character from recent days. If it can’t go up, then down or sideways are the two choices. It has been going sideways but today indicates maybe a further decline may be forthcoming. The 8-Day MA crossed below the 20-Day three days ago and it continues to be pointing down.
Depending on what happens next, as today is only one day, if the selling pressure continues the recent 1.64 low may be at risk of being busted. If it does fail to hold as support, the 78.6% Fibonacci retracement level is at 1.63. Weekly support could be seen around 1.64, which was last week’s low.
Increasing Chance of Bearish Continuation
All the signs are there for a possible bearish continuation of the trend. There is a clear downtrend in both the near and long-term price structure and natural gas is below all its moving averages from the 12-Day and up. However, it is sitting at a long-term support zone that includes the lowest traded prices in 28 years. The lowest price of the range is 1.44. It therefore becomes likely that support and a bullish reversal would be seen above that low price.
Recent price action may end up being part of a bottoming process given the significance of the support zone. If that turns out to be the case, the first thing that should happen is a rally above the six-day high of 1.77, followed by a daily close above it. After that the price of natural gas may head higher.
Read Full Story »»»
DiscoverGold
|
Followers
|
89
|
Posters
|
|
|
Posts (Today)
|
0
|
Posts (Total)
|
8799
|
|
Created
|
05/01/07
|
Type
|
Free
|
| Moderators DiscoverGold Pro-Life | |||
- The Commodity Bull is Running... Inflation is Running... Harder Living (i.e. FOOD, CLOTHING, SHELTER) is Dead Ahead... -
- Commodity Futures Trading -
http://finviz.com/futures_performance.ashx
Beneficial Educational Resources on Futures TradingThe futures market is volatile, and it cuts both ways. Leverage that makes it profitable can also ruin reckless, undisciplined traders overnight. Most brokers have paper trading available on their platforms, so those who are new to futures should take advantage and learn with these tools before going live with real money. Mitigate risk with stop loss orders at all times, and cut losses quickly instead of adding contracts and attempting to flip your way out of a losing position. Also, use mini instruments when available, with lower margin requirements, until you have sufficient capital to buy and sell more expensive contracts. Even though the potential is there, don't try to make too many profits at once. If things aren't going well, often times quitting for the day and collecting one's thoughts is the best decision. New opportunities come along daily. Markets are open nearly 24 hours, so set a schedule and stick to it. Avoid trading while tired or distracted, and please don't listen to the advice of others. Do research on fundamentals affecting markets as well as paying attention to TA. Watch key indices, and listen to accurate, real-time news during the session to stay aware of shifting trends. Trade smart, trade safely, and have fun.
Videos on Futureshttps://www.youtube.com/playlist?list=PL9A5C5A93D243CA44 Continuous Improvement in Progress |
Commodity Futures Trading
https://www.tdameritrade.com/investment-products/futures-trading.page
| Volume | |
| Day Range: | |
| Bid Price | |
| Ask Price | |
| Last Trade Time: |


