Natural Gas Faces Breakdown Risk Amid Symmetrical Triangle Pattern By: Bruce Powers | April 24, 2024
• Natural gas price faces a critical juncture as it tests support within a symmetrical triangle pattern, with implications for a potential breakdown. The current price action highlights the challenges of relying on patterns within consolidation.
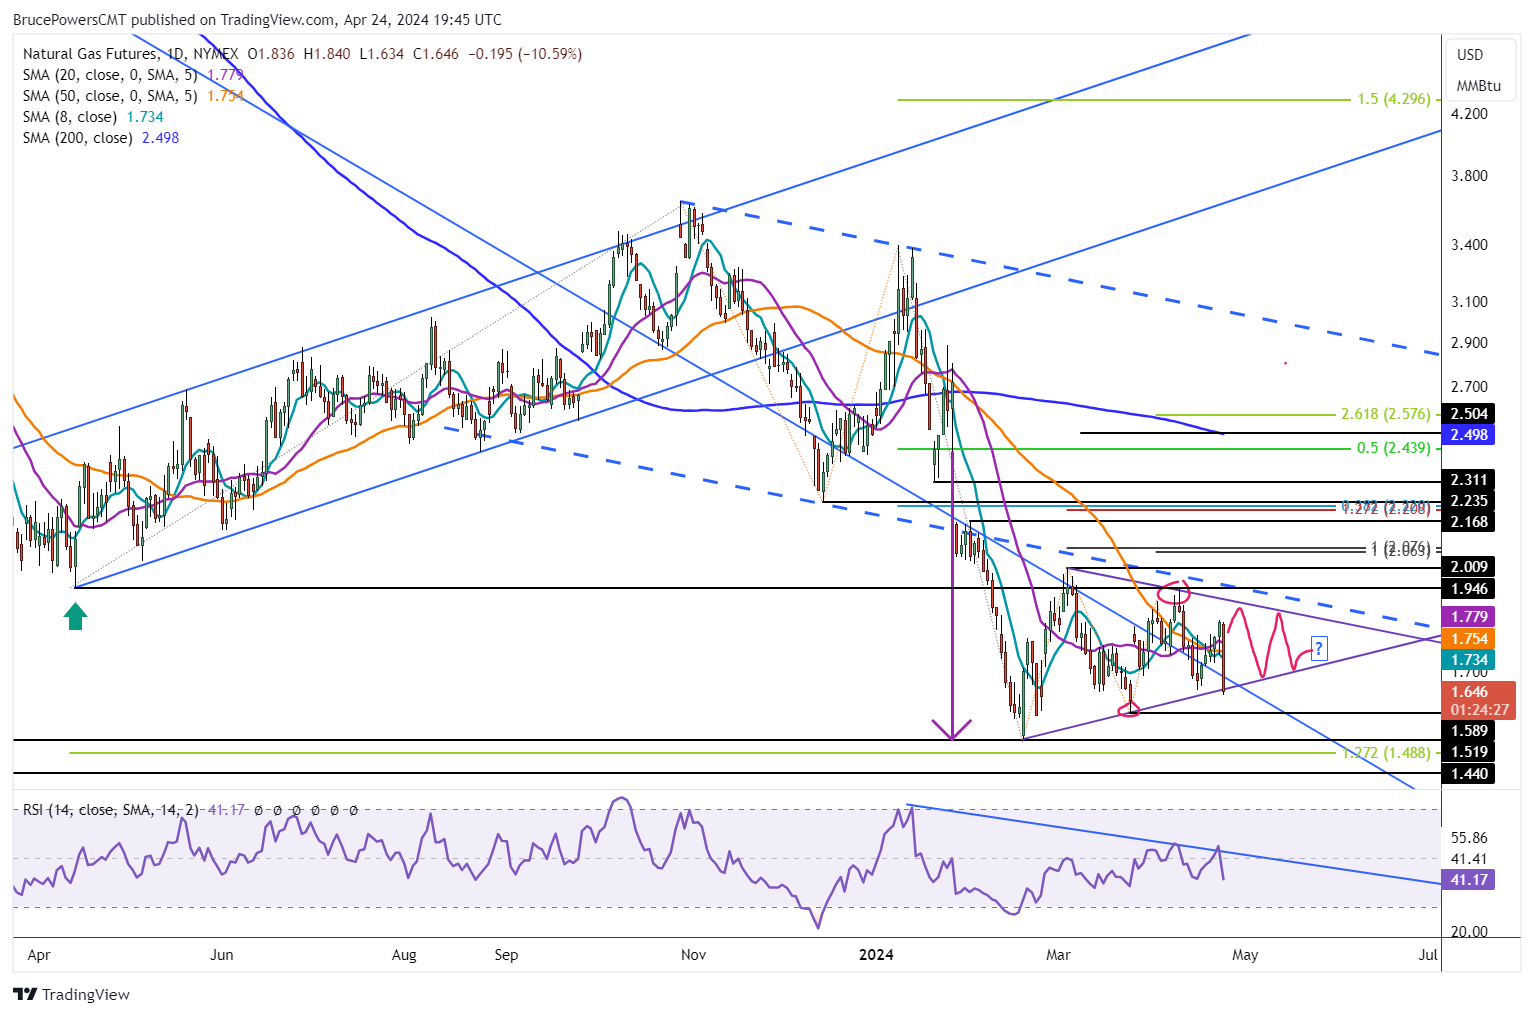
Natural gas turns down and drops to a five-day low as heads towards a test of support at the lower boundary line of a symmetrical triangle. At this time of this writing the low for the day was 1.63, and trading continues near the lows. Today’s bearish reversal is occurring within a symmetrical triangle consolidation pattern, so the implications are less than if today’s bearish action occurred in a different part of the trend. However, that will change if a breakdown triggers a decisive decline below the lower boundary line. The prior swing low of 1.65 from last week has already failed to provide support.
Weekly Support Fails
This puts the weekly bullish reversal of a hammer candlestick pattern that triggered on Wednesday at risk of failure. If the 1.63 price level is the lowest for the day, a drop below it will trigger a breakdown of the triangle pattern. Clearer bearish confirmation is indicated on a decline below the 1.59 swing low from March 25. The next lower target would then be the trend low of 1.52. That is the second lowest support level seen in natural gas in about 29 years. The lowest was 1.44 seen intraday, but the price quickly recovered, and the day ended back above the 1.52 level. In other words, 1.52 is a significant support area.
Support Seen at Bottom of Triangle
Today’s bearish price action is an example of why patterns within consolidation are less reliable to follow through. That is what is happening today following five days of positive performance and a strong close yesterday. It looks like today’s test of support at the lower boundary line may be the lowest price for the day thereby providing a third touch of the line. If it continues to act as support a bullish reversal may yet take natural gas back up towards the top line of the triangle.
Reaction Following Test of Support to Provide Clues
Thursday’s closing price will provide a clue. If natural gas can end the day above last week’s low of 1.65 it will be a slightly stronger close than being below last week’s low. But what happens next should provide further clarity. Either natural gas bounces off today’s low or breaks through it triggering a breakdown of the triangle.
Information posted to this board is not meant to suggest any specific action, but to point out the technical signs that can help our readers make their own specific decisions. Caveat emptor! • DiscoverGold
Register for free to join our community of investors and share your ideas. You will also get access to streaming quotes, interactive charts, trades, portfolio, live options flow and more tools.


 News
News  Market Data
  Discover