Natural Gas Bullish Weekly Setup on Deck By: Bruce Powers | April 22, 2024
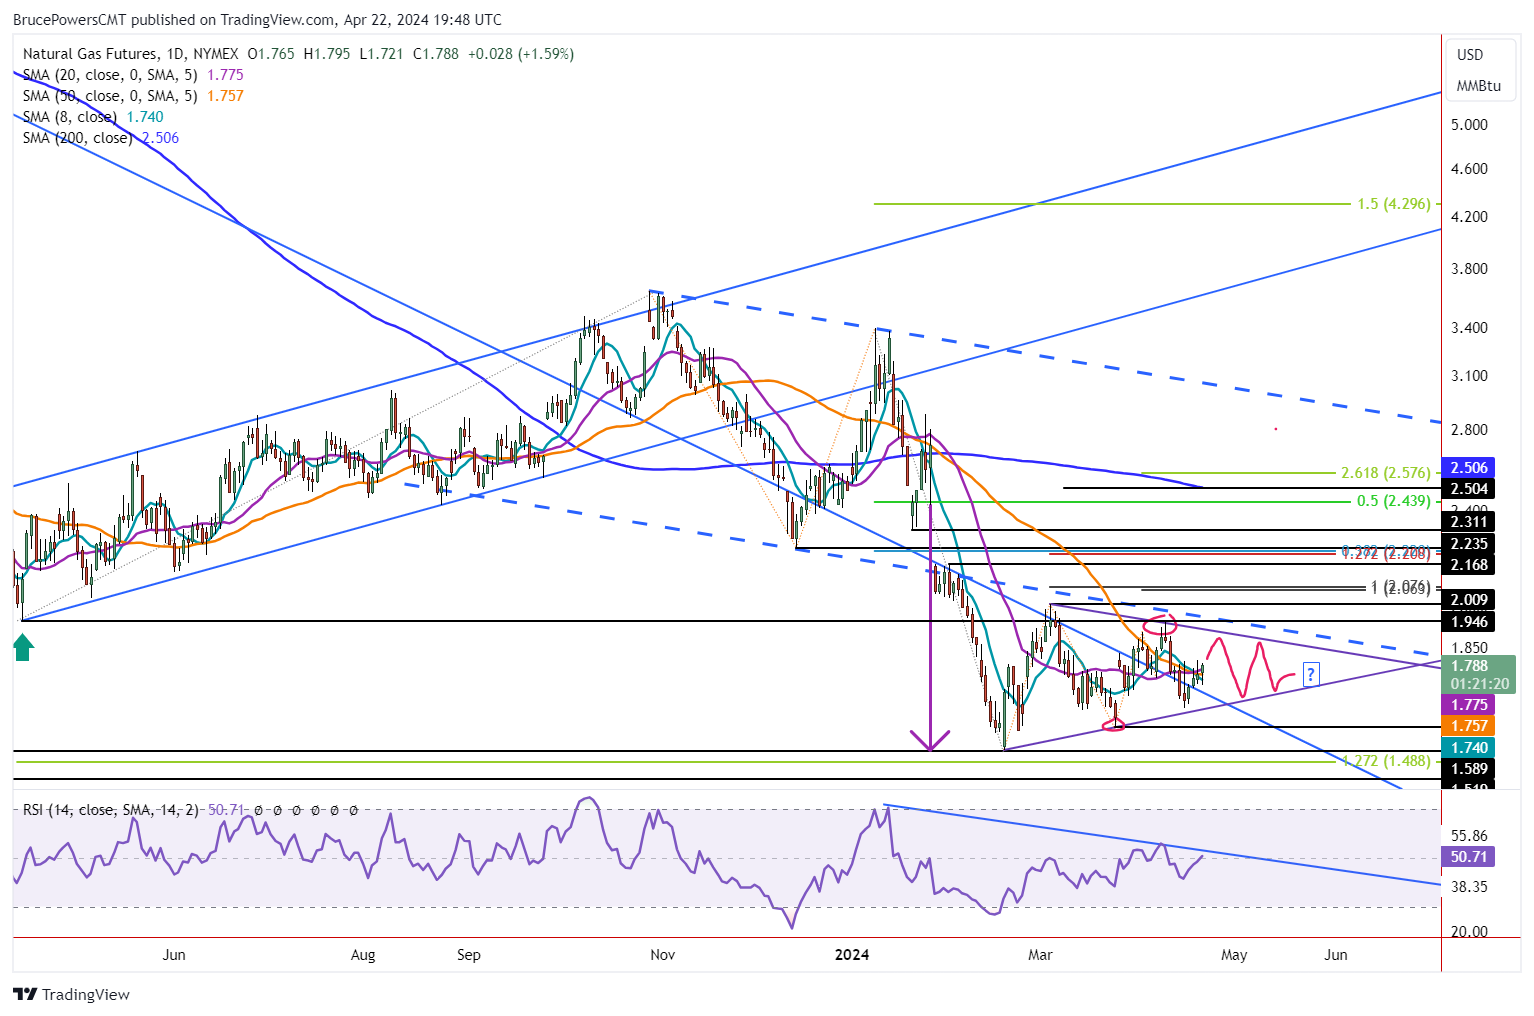
• Natural gas continues to trade within last Tuesday's range, hinting at a potential breakout of last week’s hammer candlestick pattern on a rally above 1.81.
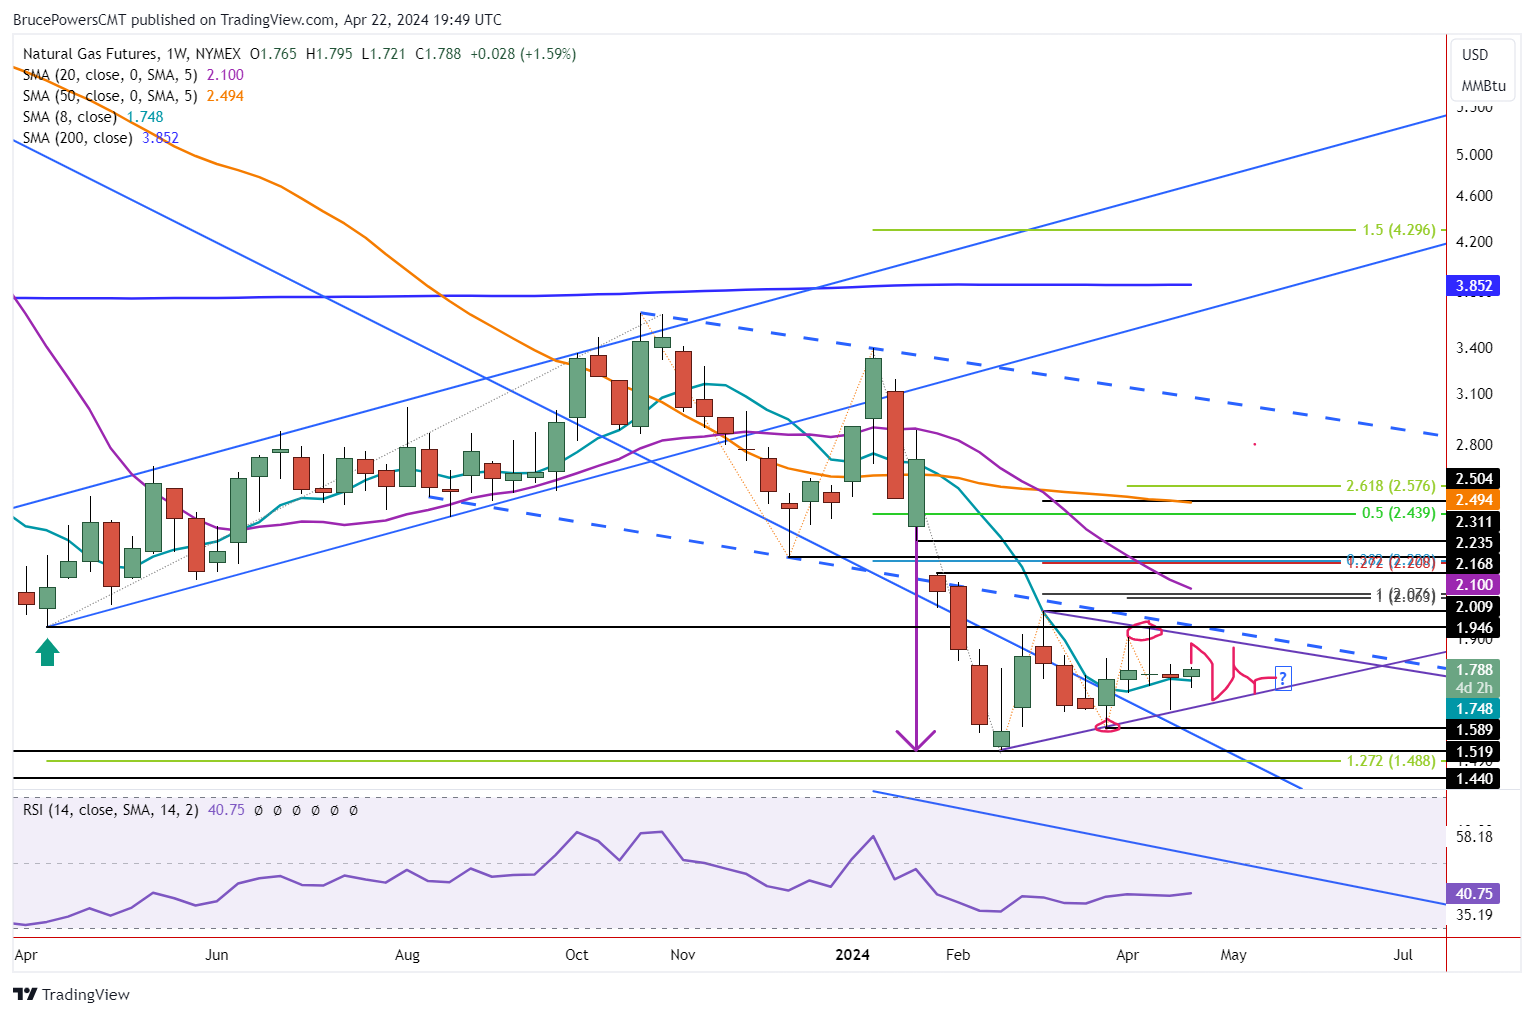
Natural gas rises on Monday but continues to trade within the price range from last Tuesday with momentum and volatility muted. Tuesday’s high was 1.80 and it was briefly exceeded to the upside on Friday, with a high of 1.81. It looks like natural gas is eventually heading towards the top line of the symmetrical triangle consolidation pattern to test resistance.
If it were hit today the line would represent approximately 1.92. However, given the lack of enthusiasm in the advance so far, further consolidation may come first. The long-term downtrend line is an area to watch for support during short-term pullbacks.
Weekly Bullish Hammer Candle Setup
A key price level for natural gas is last week’s high of 1.81. If exceeded, the upper range of the triangle becomes the next target zone. Also, last week ended with a bullish hammer candlestick pattern. Therefore, a bullish breakout above 1.81 will trigger that candlestick pattern. Interestingly, the prior week ended with a bearish shooting star candlestick pattern, and it was triggered to the downside last Monday.
This provides a potential setup on the long side that could lead to a pickup in momentum. What we have is the potential for a bullish reversal in the weekly time frame, following a bearish reversal that was triggered the previous week. This type of “whipsaw” is what can sometimes begin sharp moves.
Next Opportunity for Breakout is with the Current Advance
Once a breakout of the triangle triggers, the price of natural gas should see a clear increase in momentum. The triangle pattern is well defined with five touches of the boundary lines so far. Given the clear establishment of the pattern a breakout, either up or down, can follow.
However, given that natural gas has been rising following the most recent swing low of 1.65, the next potential breakout would likely be to the upside. Either the current advance breaks through the top line and then rises above the most recent swing high of 1.94, or resistance is seen near the top line that leads to a turn lower. If the turn lower is brief, another attempt at an upside breakout could follow.
Information posted to this board is not meant to suggest any specific action, but to point out the technical signs that can help our readers make their own specific decisions. Caveat emptor! • DiscoverGold
Register for free to join our community of investors and share your ideas. You will also get access to streaming quotes, interactive charts, trades, portfolio, live options flow and more tools.


 News
News  Market Data
  Discover