Natural Gas Testing Support Amidst Low Volatility By: Bruce Powers | April 12, 2024
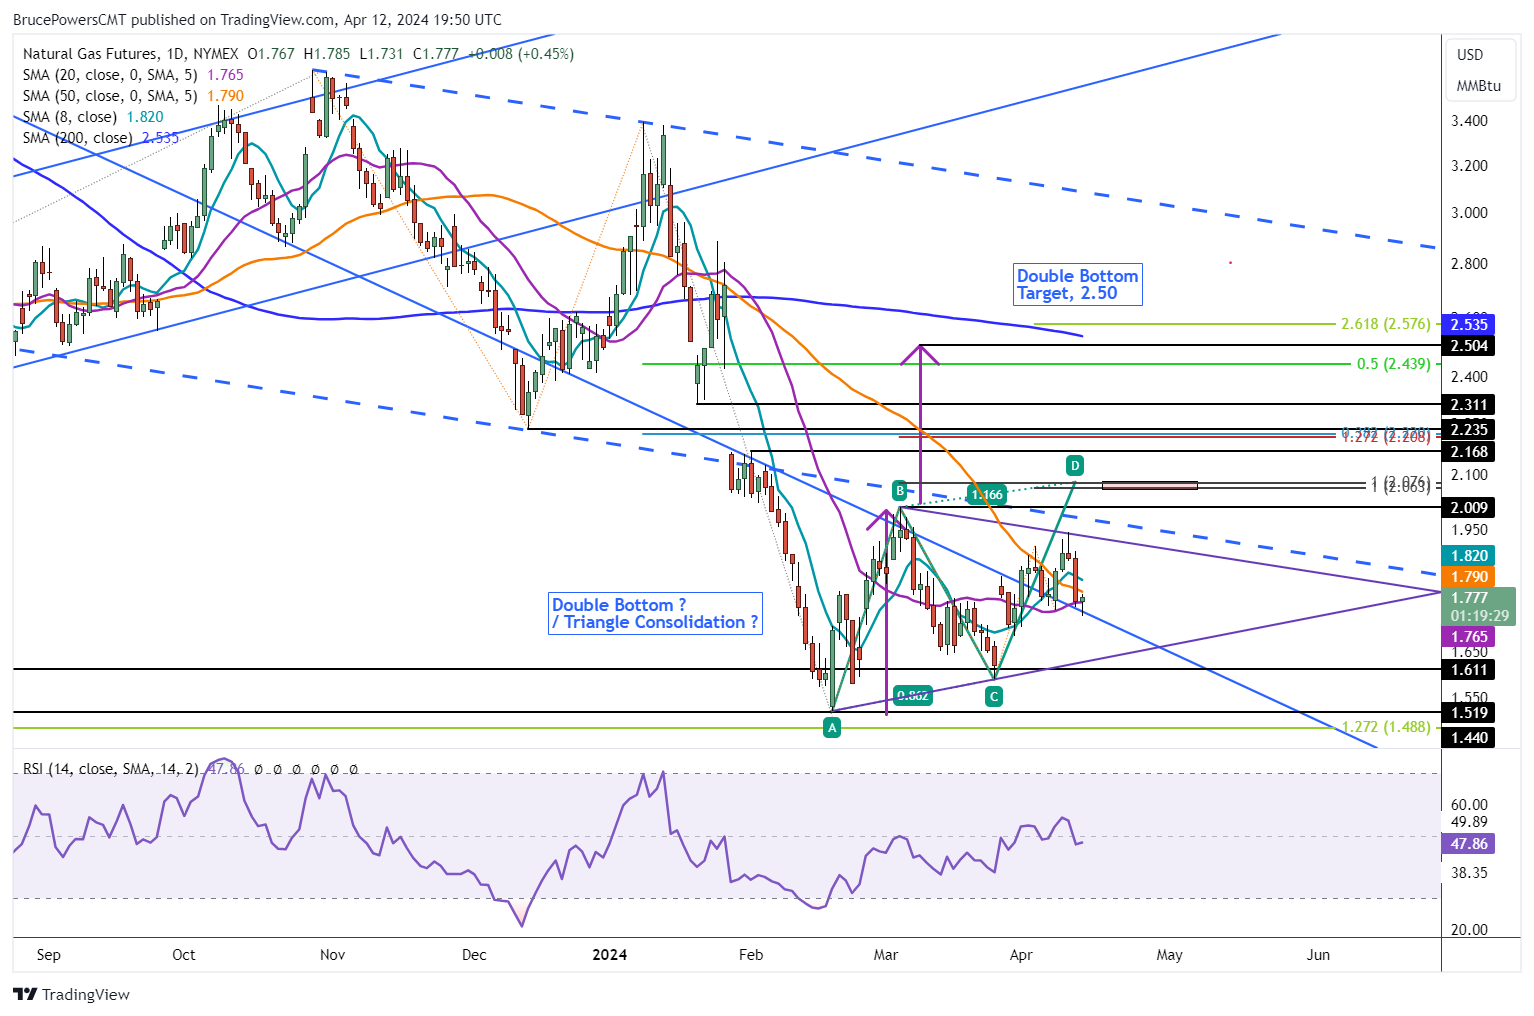
• Natural gas is testing support around the downtrend line and 20-Day MA. Signs of strength are crucial if the rally off trend lows has a chance to continue.
Natural gas dipped briefly below the minor 1.75 swing low from Monday before finding support at 1.73 and stalling the descent. Volatility diminished as it is on track to complete a narrow range day while further testing support around the long-term downtrend line and 20-Day MA, now at 1.76. If natural gas can advance above today’s high of 1.785 heading into next it has a chance to progress the near-term uptrend that starts from the higher swing low and potential second bottom (C).
Drop Below Today’s Low Points to Lower Triangle Line
However, a drop below today’s low without a quick recovery increases the chance that natural gas will further trace out a developing symmetrical triangle (purple). A drop below today’s low increases the chance of a test of support at the lower boundary line of the triangle. Recent minor signs of strength seen recently as natural gas recaptured both the 20-Day and 50-Day MAs would then be negated.
Rally Above 1.785 Would Be First Sign of Strengthening
Nevertheless, if natural gas can continue to find support around the downtrend line and 20-Day MA, followed by signs of strength, it will likely have completed a minor pullback. The chance for an eventual bull trend continuation will then become more likely. A rally above today’s high of 1.785 will provide an initial signal, but upside follow through will be key as to whether it can keep rising from there.
Weekly Chart Analysis
On a weekly basis, natural gas is on track to close weak, in the lower third of the week’s range and possibly with a doji. The weekly candle will be bearish unless natural gas can rise before today’s close. Last week also ended relatively weak. This week will be the second in a row where natural gas is closing in the lower area of the week’s range. In both cases support for the week was seen in the 8-Week MA.
Natural gas has been mostly below the 8-Week line since early-January. So, a successful test of support at the 8-Week line is one sign of strength. Regardless, the weekly performance did not confirm strength since this week and last week ended (likely) in the lower part of the range. Therefore, a drop below today’s low would also give a weekly bearish signal relative to this week’s low and the 8-Week MA.
Information posted to this board is not meant to suggest any specific action, but to point out the technical signs that can help our readers make their own specific decisions. Caveat emptor! • DiscoverGold
Register for free to join our community of investors and share your ideas. You will also get access to streaming quotes, interactive charts, trades, portfolio, live options flow and more tools.


 News
News  Market Data
  Discover