 News
News  Market Data
  Discover
Support: 888-992-3836
Copyright © 2023 InvestorsHub Inc.


Register for free to join our community of investors and share your ideas. You will also get access to streaming quotes, interactive charts, trades, portfolio, live options flow and more tools.
Phil Flynn: The Energy Report
By: Phil Flynn | July 26, 2024
If I had a hammer, I’d hammer in the morning. I’d Hammer in the evening and after oil got hammered it might be time to buy.
Oil prices got caught up in the tech wreck ignoring extremely bullish data. Yet as oil saw some stability in stocks, they put in a classic hammer candlestick formation that is viewed as a bullish. Reversal candlestick pattern that mainly occurs at the bottom of downtrends get those candlestick traders all excited.
Yet the fundamental traders also are seeing things that should be another reason the bears may start running for cover.
John Kemp and Reuters pointed out that, “U.S. crude oil inventories have depleted faster than normal over the last four weeks – squeezing hedge funds running short positions, keeping spot prices firm and the futures curve in a steep backwardation.” Kemp says that, “Commercial crude inventories across the United States depleted by 24 million barrels between June 21 and July 19, according to the Energy Information Administration (EIA). He says that the drawdown in crude stocks this year has been more than twice as fast as the average over the previous ten years.” Kemp points out that, “crude inventories were 8 million barrels (-2% or -0.15 standard deviations) below the seasonal average on July 19. He says that the recent draws more than eliminated a surplus of 6 million barrels (+1% or +0.12 standard deviations) four weeks earlier.
The draws were not a surprise to us, but we did think the draws would have started even sooner. We believe that even with a Chinese slow down, oil demand growth has exceeded production growth, helped along by OPEC plus product restraints.
Yet sometimes demand takes a back seat to macroeconomic concerns. Big pullbacks in the Nasdaq and industrial metals raised concerns about the possibility of a potential recession. Yet the stronger than expected reading on advanced GDP reduced those fears even after a much softer report on durable goods. Barrons reported that, “The U.S. economy powered through the second quarter, growing more than expected even as inflation resumed its path back to the Federal Reserve’s 2% target.
Inflation-adjusted gross domestic product grew at an annualized rate of 2.8% in the second quarter, according to an initial estimate the Bureau of Economic Analysis released Thursday. That was not only a significant rebound from the 1.4% pace logged in the first three months of the year, but it surpassed the 1.9% growth forecast by economists surveyed by FactSet.
MarketWatch reported that Durable-goods orders plummeted in June — but one sector was largely to blame. “The numbers: Orders for durable goods fell 6.6% in June, the Commerce Department said Thursday. It is the sharpest drop since the pandemic. Economists had forecast a 0.3% rise in orders for durable goods in June — products made to last at least three years. It is the first decline in durable goods after four straight gains and was driven by a 20.5% drop in transportation orders.
Nondefense orders plummeted 127%. Excluding the volatile transportation sector, orders were up 0.5%. Core capital goods orders, which exclude volatile sectors like transportation and defense, rose 1% last month after a 0.9% fall in May. And shipments of core capex orders went up 0.1% in June. In the Big picture: Business investment is struggling. Year-over-year, durable orders are down 10.3%. That’s the largest drop since June 2020.
Regardless, we still believe that the market has upside risks. We have been warning about this and the hedge funds are starting to get on board with our market outlook. John Kemp wrote that, “The depletion of crude stocks has been accompanied by an influx of investment money into futures contracts based on U.S. crude prices anticipating a further increase in prices.
Hedge funds and other money managers purchased the equivalent of 79 million barrels of futures and options in the NYMEX and ICE WTI contracts over the four weeks ending on July 16. Purchases were faster than for Brent, where fund managers bought the equivalent of 44 million barrels, according to records filed with regulators and exchanges. In consequence, fund managers had amassed a combined position of 239 million barrels (48th percentile for all weeks since 2013) in WTI compared with only 184 million (33rd percentile) in Brent.
The answer my friend, is not blowing in the wind or sun. Another sad story about the old energy transition. Bloomberg reports that, “French electricity grid limitations will constrain power exports from Monday for more than two months, threatening higher prices in neighboring countries. The curbs that run until October will impact exports to Belgium, Germany, Switzerland and Italy. Similar limitations this spring led to record spreads between France’s day-ahead power price and its neighbors.
France’s fleet of nuclear plants is the backbone of Europe’s power system, often supplying cheap electricity to other nations when renewable assets aren’t generating. Without French exports, they have to fall back on more expensive gas-fired generators.
Italy, which is already struggling as summer heat boosts cooling demand, will be the most exposed to upward price moves. French grid operator RTE said limitations will increase when exports toward its eastern borders exceed 8 gigawatts. There’s a chance that curbs will be needed even before that threshold — which will be updated on Sept. 8 — is reached. Italy is the most vulnerable, then Switzerland, followed by Germany and Belgium, RTE said.
Raising concerns that the golden age of high refining margins is over. Regardless refining merchants are still decent enough to make a pretty good profit the gasoline crack spreads are trying to bottom, and diesel spreads should pick up we have some strong seasonal tendencies for bull spreads in heating oil that kick into gear into the month of August.
High temperatures in August could turn around the natural gas market as well. Yet yesterday’s somewhat bearish weekly natural gas report didn’t really inspire a lot of new buying. Even though the increases were less than the 10-year average, it was higher than expected. The Energy Information Admintation reported that working gas in storage was 3,231 Bcf as of Friday, July 19, 2024, according to EIA estimates. This represents a net increase of 22 Bcf from the previous week. Stocks were 249 Bcf higher than last year at this time and 456 Bcf above the five-year average of 2,775 Bcf. At 3,231 Bcf, total working gas is above the five-year historical range.
Read Full Story »»»
 DiscoverGold
The Corn & Ethanol Report
By: Daniel Flynn | July 25, 2024
We kickoff the day with Durable Goods Orders MoM, GDP Growth Rate QoQ Adv, Durable Goods Orders Ex Transportation MoM, GDP Price Index QoQ Adv, Initial Jobless Claims, Continuing Jobless Claims, Core PCE Prices QoQ Adv, Durable Goods Orders ex Defense MoM, GDP Sales QoQ Adv, Jobless Claims 4-Week Average, Non Defense Goods Orders Ex Air, PCE Prices QoQ Adv, and Real Consumer Spending QoQ Adv at 7:30 A.M., EIA Natural Gas Stocks at 9:30 A.M., Kansas Fed Composite Index and Kansas Fed Manufacturing Index at 10:00 A.M., 4-Week & 8-Week Bill Auction at 10:30 A.M., 15-Year & 30-Year Mortgage Rate at 11:00 A.M., 7-Year Note Auction at 12:00 P.M., Cold Storage at 2:00 P.M., and Fed Balance Sheets at 3:30 P.M.
Existing Home Sales in June, reported on Tuesday by the National Association of Realtors, were down 5.4% from May and 5.4% below a year ago. June sales were the lowest since December, and the June sales volume was the smallest since 1995! However, unsold housing inventory rose 3.1% from the previous month to 1.32 Mil homes, the largest since October 2020. Months of supply jumped 11% from May to 4.1 months, the most since May 2020, Inventory is starting to build, which should soon start to be realized in prices and volume. New Home Sales in June, reported on Wednesday by the Census Bureau, showed that sales volume fell 1% after falling 15% in May. Compared to a year ago, new home sales were down 7%. Total new and existing home sales in the first half of 2024 were down 3% from last year and 25% less than 2022, a 13-year low of 28.7 Mill homes.
CBOT Corn Market ends Mixed on wetter GFS model; US Weather Critical Next 30 Days in Determining Global Feed Supply: Corn futures were mixed with European values down on profit taking, while CBOT futures ended slightly higher and Brazil’s market unchanged. Of note is that Ukrainian premiums have added another $.15/Bu. Nothing is quoted there for new crop delivery amid drought/production concern. Whether heat/dryness across the Plains/ W Midwest will persist during August is paramount in determining fair value and whether global stocks can hold steady with last year at 310 MMT’s. Ag Resources (ARC) maintains that bearish input hinges on the hope for record 2024 US yield of 181 BPA plus. USDA projects world less China corn stocks in 24/25 at 99 MMT’s, vs. 98 in 23/24 and vs. 2016’s peak of 128 MMT’s. As such the importance of August weather can’t be overstated. Along with deepening drought in Ukraine, a sub-180 BPA US yields drop world less China stocks in 24/25. ARC’s message is that the recent year build in world stocks has been unremarkable. Price pressure will only be felt if Central US August weather is favorable. Otherwise, world feed grain prices are scoring an early seasonal low. Also, early this morning, the Peoples Bank of China lowered the rate on its one-year medium-term lending facility to 2.3% from 2.5%. China’s central bank surprised markets again by cutting another key policy rate, continuing a wave of monetary easy as it looks to support the country’s ailing economy.
Consensus Forecast Stays Hot/Dry in Plains/W Midwest; Normal Rainfall Forecast in East: Yesterday, the midday GFS trended a bit cooler in the Midwest, but odds remain high a lengthy period of heat & dryness lies ahead. Ride-riding storms will favor the Great Lakes/E Midwest but elsewhere rapid soil moisture loss is anticipated. The EU ensemble model’s two-week precipitation forecast has moisture will keep record yield potential intact in IL, IN, OH, and MI but uncertainty is present elsewhere. High temps July 29-Aug 6 are projected in a range of 95-103 degrees. Extreme heat favors TX, OK, KS and parts of NE and western MO. Unfortunately the mean position of the new jet stream is projected to stay aloft Southern Canada, which limits any change of relief from Plains heat/dryness in the medium term, Concern rises if this pattern is extended beyond mid-August. A tropical system is needed to dislodge the Intermountain High Pressure Ridge with the jet stream holding across Southern Canada.
Wednesday CBOT open interest data shows wheat bfell 5,722 contracts while corn was up 4,661 contracts and soybeans were up 1,935 contracts. CBOT corn open interest data has yet to show a large net short liquidation. Manage money remains short a record amount of CBOT corn/soybean futures on a combined basis.
Ethanol stocks jumped to 23.7 mil. Barrels at the end of high expectations and above 23.2 mb from a year ago. As margins remain strong I lean toward a 25 mil/bu increase in corn usage in the August WASDE. Implied gasoline demand surged 7.7% last week to 9.456 mbd, the highest in 8 months and up 6% YoY. Ukraine’s 24/25 grain exports thru July 24th at 2.78 mmt are up 67% from last year. Corn exports account for 1.39 mmt of the total.
Read Full Story »»»
DiscoverGold
Copper now headed for an 8th consecutive red day, its longest losing streak since January 2020
By: Barchart | July 24, 2024
• Copper now headed for an 8th consecutive red day, its longest losing streak since January 2020. What is copper telling us right now?

Read Full Story »»»
DiscoverGold
Natural Gas Potential Bullish Breakout for Natural Gas Above $2.17
By: Bruce Powers | July 24, 2024
• A bullish breakout for natural gas is likely if it rises above $2.17, with targets including the 20-Day MA at $2.33 and higher levels.
Natural gas weakened on Wednesday as it fell below Tuesday’s low yet remained within the trading range from Monday. Monday’s low was 2.09 and today’s low was 2.10. If it closes above 2.09 then a potential bullish setup will be established. There was one day of strong bullish momentum following Monday’s breakout above the internal downtrend line.
A wide range green candlestick with a strong close near the highs of the day’s range completed the day. The subsequent two-day pullback slowed the ascent as profit taking took hold, but natural gas retains a short-term bullish posture and is working on reversing the bearish retracement.

Breakout Above 2.17
A bullish breakout will be triggered on a decisive rise above today’s high of 2.17 and confirmed on a daily close above that price level. Natural gas should then be ready to test this week’s high of 2.27 and higher prices. The first area where resistance might be seen is around the 20-Day MA at 2.33. Notice that the 20-Day line is close to the higher downtrend line, which also marks dynamic resistance for the recent decline.
200-Day MA is a Target at 2.43
If natural gas can eventually rise above the downtrend line and stay above it, there it has a chance of reaching higher targets. The 200-Day MA would be next on the agenda, at 2.43 currently, while the 38.2% Fibonacci retracement is nearby at 2.45. Further, there is prior support and now potential resistance at 2.47. If those price levels can be exceeded to the upside, natural gas will likely test resistance around the 50-Day MA at 2.56 and the 50% retracement at 2.59.
Weekly Bullish Breakout Above 2.285
Last week’s high of 2.285 should also be watched as a rise above it will signal a bullish reversal in the weekly time frame. It would be the first time since the June peak of 3.16 that a prior week’s high had been exceeded and would be a key sign that strength is returning. A bullish weekly reversal would be confirmed on a daily close above last week’s high.
Also, this week’s price action is contained within last week’s price range. Since the week is more than half over there is a chance that it may end the week in the same position. If so, heading into next week, a bullish signal will be generated on a rally above this week’s high of 2.27.
Read Full Story »»»
DiscoverGold
Daniel Flynn: The Corn & Ethanol Report
By: Daniel Flynn | July 23, 2024
We kickoff the day with MBA 30-Year Mortgage Rate, MBA Mortgage Applications, MBA Mortgage Market Index, MBA Mortgage Refinance Index, and MBA Purchase Index at 6:00 A.M., Goods Trades Balance Adv, Retail Inventories Ex Autos MoM Adv, and Wholesale Inventories MoM Adv. At 7:30 A.M., S&P Global Composite PMI Flash and S&P Global Manufacturing Manufacturing PMI Flash, and S&P Global Services PMI Flash at 8:45 A.M., New Home Sales and New Home Sales MoM at 9:00 A.M., EIA Energy Stocks at 9:30 A.M., 17-Week Bill Auction and 2-Year FRN Auction at 10:30 A.M., 5-Year Note Auction at 12:00 P.M., Dairy Products Sales at 2:00 P.M., Fed Bowman Speech, Building Permits Final, and Building Permits MoM Final at 3:05 P.M.
The Federal Reserve reported that the US M2 money supply in June swelled to a 16-month high of $21,025, Billion. This marked the 4th consecutive month that M2 growth and the 3rd consecutive month that M2 was above a year ago. In March the last year economists and traders have fretted about year-over-year declines in the money supply of 3-4%, which had been the largest since the Great Depression. While December 2022-March 2024 was the longest period of year-over-year contraction, those declines minuscule compared to the 10-25% increases that occurred for 24 consecutive months from 2020-2022. The June M2 figure was 16% higher than June 2020 and was 36% larger than February 2020, just ahead of the pandemic. The M2 increase will make the fight against inflation more difficult ahead 2025. Just another dismal policy from an administration that cover’s up how bad buying groceries and living day-to-day. Just another failure in every faze of the game.
Central US Weather Pattern Discussion- Extreme Heat Blankets Plains Next Week; Central US Precipitation Lacking into Aug 7: The GFS is overdone with its call for max temps of 108-113 in OK,KS, NE, SD, IA, and MO next July 31-Aug 76, but there is an agreement that much warmer pattern impacts the Central US beyond the coming weekend. The EU model’s high temp outlook on July 31, has temps existing in the upper 90’s/low 100’s across the Southern & Central Plains and southwestern Corn Belt throughout next week, and likely into Aug 5-6. Some 14-15 Mil acres of corn and 10-12 Mil/acre of soybeans will be exposed to rapid soil moisture evaporation. The coming expansion of Midwest high pressure Ridging will hold in place a pattern of complete dryness outside the Southeast US into July 29th . Ridge-riding storms are hinted across the Great Lakes/ E Midwest in early August is possible.
July to August Yield Changes
The August USDA crop report takes on greater significance as the job of forecasting crop yield/production is handed off from WASDE analysts to NASS statisticians. The National yield in the May-July WASDE reports is based on modeling from historical yields, planting dates, and climate variables. The NASS estimates in August are based on farmer surveys for soybean/corn yields, with field surveys conducted for the September report. Looking back at the long-term history of NASS August soybean yields, there has been a slight bias for NASS to lower yields from the July WASDE. Since 1974, the NASS yield has declined in 25 years, or 50% of the time, by an average of 1.4% BPA. In 21 years (42%), the yield has been higher by an average of 1.3 BPA and the remaining 4 years the August soybean yield has been unchanged. The largest yield decline came in 2012 when the NASS yield 4.4% BPA below the July WASDE. There have been five years that the August yield increased by more than 2 BPA and eight years the yield declined more than 2 BPA.
Read Full Story »»»
DiscoverGold
Sugar is now on a 6-day losing streak and has fallen to its lowest levels since Halloween 2022
By: Barchart | July 23, 2024
• Sugar is now on a 6-day losing streak and has fallen to its lowest levels since Halloween 2022.

Read Full Story »»»
DiscoverGold
Commodities Daily Market Movers (% Price Change)
By: Marty Armstrong | July 24, 2024
• Top Movers
Cheese 3.21 %
NY Palladium Futures 2.05 %
Lean Hogs (CME) Futures 1.51 %
Palm Kernel Oil 1.07 %
Feeder Cattle (CME) Futures 0.92 %
• Bottom Movers
AU - Victoria Base-Load Electricity Futures 7.62 %
NSW Baseload Electricity Continuous 4 %
Iron Ore 62% Fe CFR China (TSI) 3.44 %
AU - Queensland Base-Load Electricity Futures 3.16 %
Cotton 3.08 %
*Close from the last completed Daily
DiscoverGold
Grains Report: Wheat, Rice, Corn and Oats, Soybeans, Canola and Palm Oil
By: Jack Scoville | July 23, 2024
• WHEAT
General Comments: Wheat was higher in all three markets on fund short covering and as there has been some positive demand news amid production problems in Russia and Europe. The weekly export sales report was good and there were a lot of sales into North Africa last week from Russia and Europe. US harvest progress and ideas of good yields and crops went against reports of hot and dry weather in eastern Europe and Russia and too wet weather in France and Germany are still heard and the weather there affecting world production estimates. There were more reports of hot temperatures coming this week to Russian growing areas. It has also been very dry there. Eastern Europe is also hot and dry. Western Europe has seen too much rain.
Overnight News:
Chart Analysis: Trends in Chicago are mixed. Support is at 526, 520, and 514 September, with resistance at 557, 581, and 592 September. Trends in Kansas City are mixed. Support is at 546, 540, and 534 September, with resistance at 590, 601, and 618 September. Trends in Minneapolis are mixed. Support is at 600, 586, and 574 September, and resistance is at 628, 636, and 646 September.
• RICE
General Comments: Rice closed higher yesterday on speculative buying from oversold conditions. Futures continued to reflect mostly good growing conditions and increased planted area. Hurricane Beryl has brought beneficial rains to Arkansas and other parts of the Delta but damaged crops in Texas. The US weather has been an issue much of the growing season with too much rain early in the year. Supply tightness is expected to give way to increased production this year and greatly increased supplies this Fall. However, prices appear oversold right now and a rally is possible at any time.
Overnight News:
Chart Analysis: Trends are down with objectives of 1382 September. Support is at 1412, 1400, and 1388 September and resistance is at 1486, 1489, and 1502 September
• CORN AND OATS
General Comments: Corn and Oats closed higher yesterday on what appeared to be speculative short covering. The weekly export sales report showed moderate sales. Selling was based based on ideas that futures reflected big yield potential amid good growing conditions seen in the Midwest. Current forecasts call for cooler and drier weather for the Midwest this week but hot weather could return next week. Northern areas such as southern Minnesota that have had way too much rain and flooding is still reported. Some selling came from reduced demand ideas. Corn did not move to new lows last week and it is possible that the current down trend is near its end.
Overnight News: Unknown destinations bought 200,000 tons of US Corn,.
Chart Analysis: Trends in Corn are down with no objectives. Support is at 388, 385, and 382 September, and resistance is at 403, 412, and 426 September. Trends in Oats are mixed. Support is at 327, 321, and 311 September, and resistance is at 350, 364, and 383 September
• SOYBEAN
General Comments: Soybeans and the products closed higher yesterday on apparent speculative short covering. Demand news was strong for both Soybeans and Soybean Meal last week with big sales announced on the daily system. The weekly export sales report showed new sales to China and this was positive as well. There was more beneficial precipitation in much of the Midwest over the last week. This week should be dry and temperatures should turn warmer amid dry weather next week. Some selling came from reduced demand ideas. Reports indicate that China remains an active buyer of Soybeans in Brazil. Domestic demand has been strong in the US but has suffered as crushers were crushing for oil.
Overnight News:
Chart Analysis: Trends in Soybeans are mixed. Support is at 1096, 1068, and 1056 August, and resistance is at 1130, 1151, and 1170 August. Trends in Soybean Meal are mixed. Support is at 338.00, 331.00, and 329.00 August, and resistance is at 344.00, 351.00, and 355.00 August. Trends in Soybean Oil are up with objectives of 4660 and 4890 August. Support is at 3910, 3840, and 3790 August, with resistance at 3960, 4000, and 6050 August.
• CANOLA AND PALM OIL
General Comments: Palm Oil was lower today with ideas of expanding world oilseeds production. Reports indicate that production is rising as well. Export demand has been very strong in recent private reports but has been weaker in recent days. There is talk of increased supplies available to the market, and the trends are down on the daily charts. Canola was higher last week and trends started to turn up on the weekly charts as oilseed supplies look to be ample in the coming year and as demand ideas are down. The weather has called for dry conditions in the Prairies.
Overnight News:
Chart Analysis: Trends in Canola are up with objectives of 702.00 November. Support is at 636.00, 627.00, and 618.00 November, with resistance at 674.00, 680.00, and 686.00 November. Trends in Palm Oil are mixed. Support is at 3820, 3790, and 3770 October, with resistance at 4040, 4100, and 4140 October.
Midwest Weather Forecast Mostly dry early, scattered showers late. Temperatures should average near to below normal.
Read Full Story »»»
DiscoverGold
Cocoa soared by more than 9% yesterday, its biggest gain since May 7.
By: Barchart | July 23, 2024
• Cocoa soared by more than 9% yesterday, its biggest gain since May 7.

Read Full Story »»»
DiscoverGold
Copper on track for its 7th consecutive red day for the first time since January 2020
By: Barchart | July 23, 2024
• BREAKING: Dr. Copper
Copper on track for its 7th consecutive red day for the first time since January 2020

Read Full Story »»»
DiscoverGold
Agriculture Master Report
By: Bill Moore | July 23, 2024
SEPT BEANS
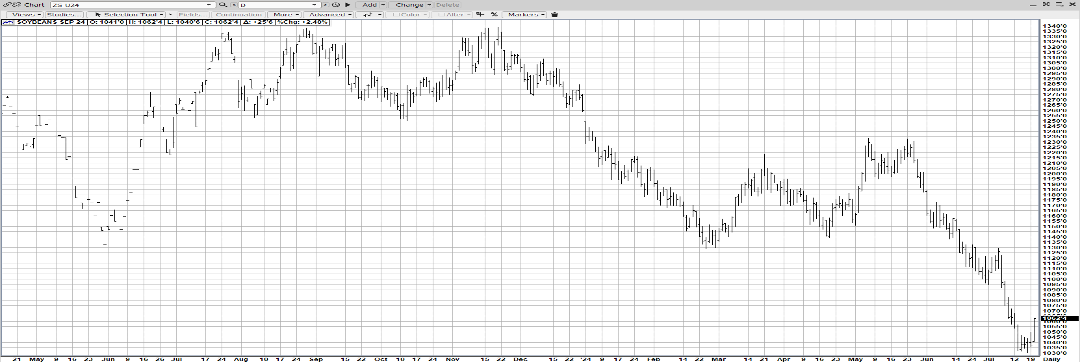
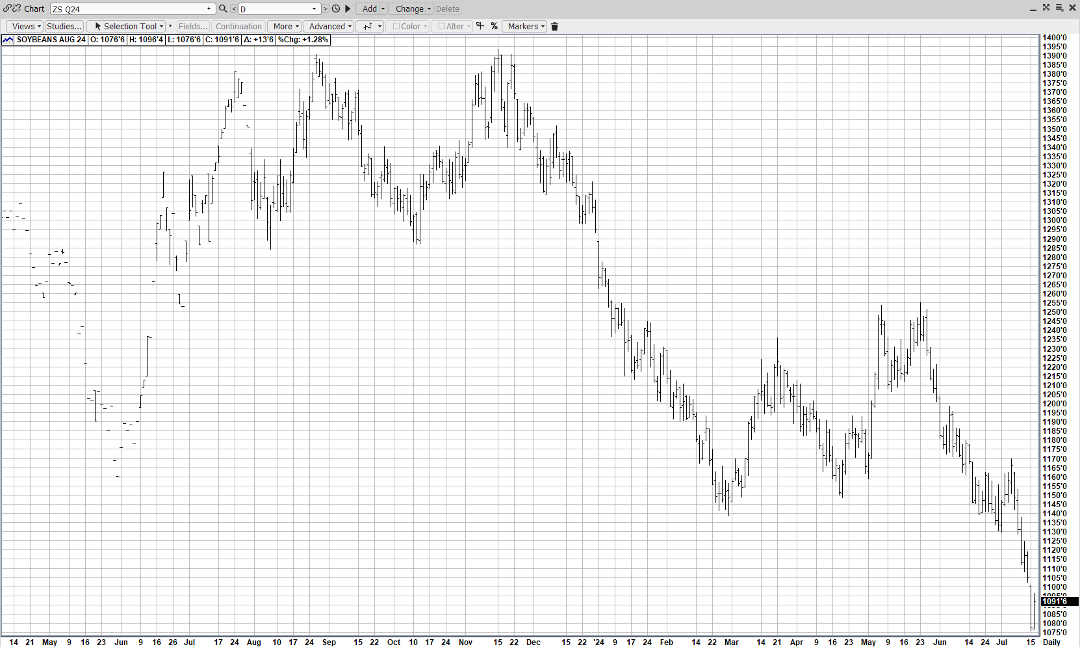
Eventually, LOW PRICES CURE LOW PRICES! Sept Beans have plummeted $3.00 since December (1330-1030) – and now a hot spell is due into early August – when beans are made! As well, 3 flash sales of beans & meal have been recorded last Thur & Fri! Finally, fears of a Trump Trade Embargo have subsided with the sudden withdrawal of Joe Biden from the presidential race! Funds are holding a record short position – which would fuel substantial buying should any positive fundamentals emerge! The flash sales indicate significant export interest at the current 3 yr low levels – and it appears a large crop & yield are already dialed in!
SEPT CORN
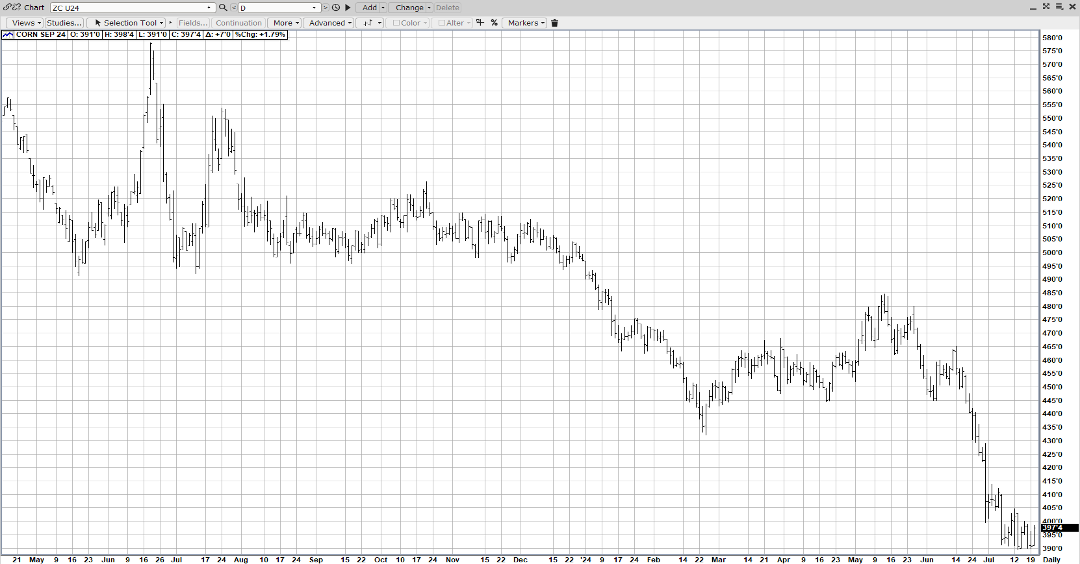
Hot & dry is entering the corn/bean belt into early August – igniting a short-covering rally today – helped by beans 25 cent up! Also, Mexico bought 133,000 mt of US Corn this morning! Finally, Biden exiting the Presidential Race eases concerns about potential a trade war by increasing the Dems chances! Net fund shorts are a record 343,845 contracts – & they will exit on any fundamental improving! The nearly $2.00 break since last Summer has factored in a 15.1BB crop & a 182-183 yield! Also, remember, the acres are 3 million under last year – should the yields not be as buoyant as expected! The US is very competitive on the export front with our prices under South America
SEPT WHT
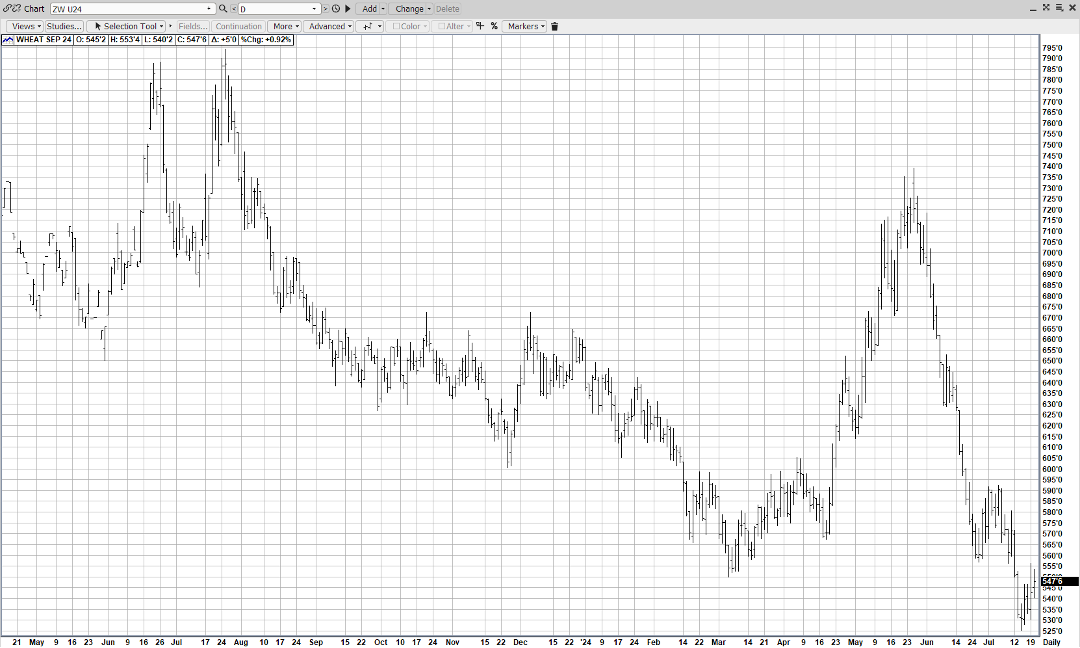
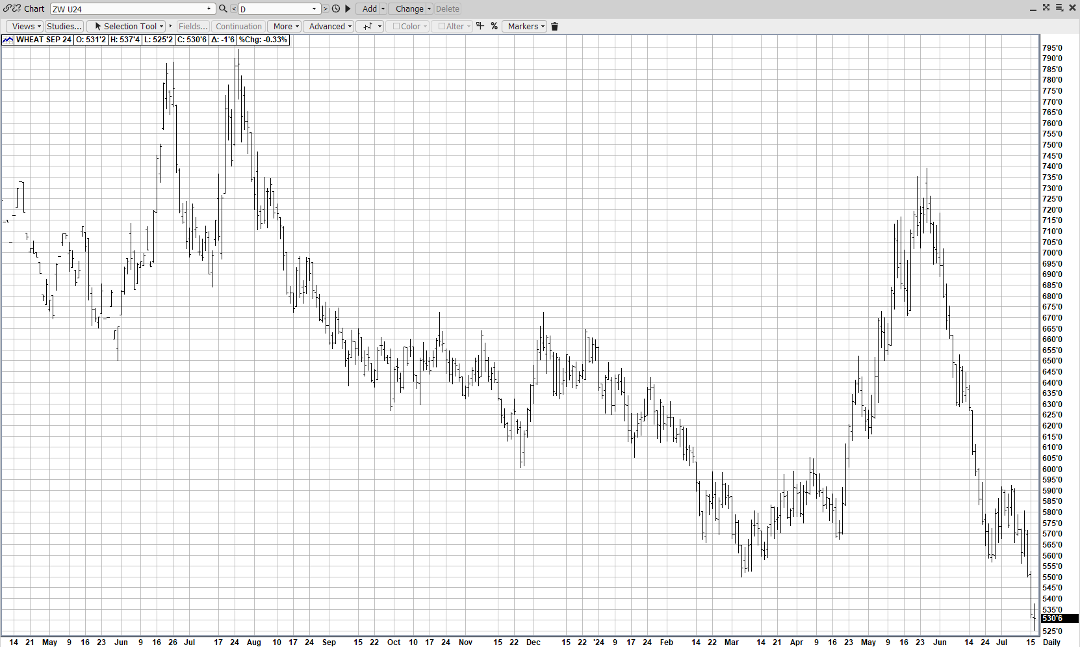
Quality issues with EU & Russia – coupled with crop stress in the Canadian Prairies have supported Sept Wht on breaks! Robust exports of late & spillover support from corn/beans today have both helped underpin! Wht futures are $2.50 cheaper than last Summer – which is encouraging foreign trade! Last week, Egypt bought over 700,000 MT of Russian Wht – the biggest purchase in 2 years! Recent escalation in the Red Sea area has increased shipping risks for wht!
AUG CAT
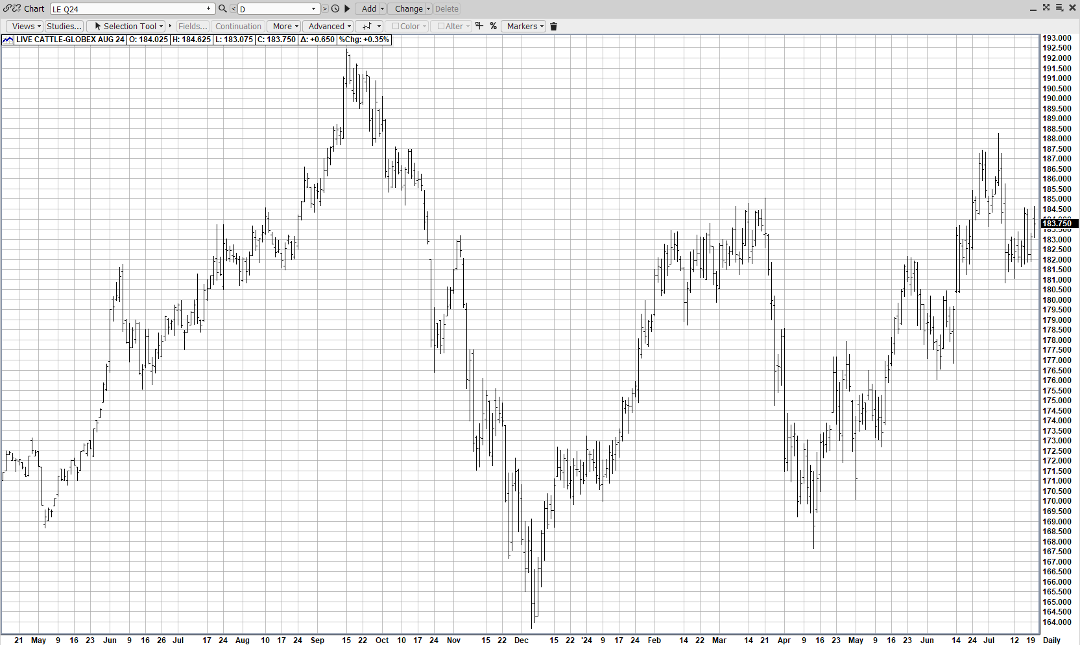
A friendly Cattle-on-Field Report issued Friday at 2pm reported placements at 93% (exp – 97) and this report plus elevated grilling season demand into the Labor Day W/E have rallied Aug Cat into the top of its recent trading range! Slaughter & beef production were under last year & helped underpin the mkt!
AUG HOGS
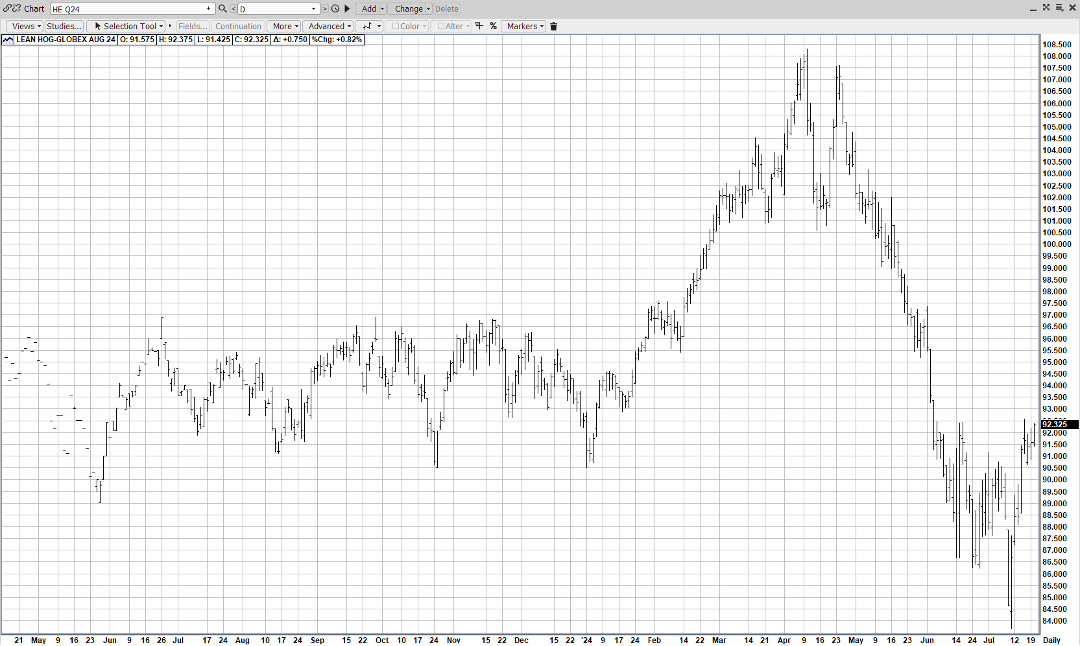
A stunning $8 upside reversal in Aug Hogs (84-92) has technically confirmed a low in the contract after a $25 plummet! Cash mkts have firmed seemingly validating the chart low & demand – helped by the glaring disparity between pork & beef in the grocery store – has consolidated the turn-around! And another 5 weeks of “grilling demand” is still ahead thru the Labor Day W/E!
Read Full Story »»»
DiscoverGold
Softs Report: Cotton, OJ, Coffee, Sugar, Cocoa
By: Jack Scoville | July 23, 2024
• COTTON
General Comments: Cotton was a little lower yesterday in choppy trading as some short covering was noted after an early test of the 7000 December area. It looks like futures are cheap enough for now but speculators see no reason to buy except to cover short positions. USDA showed a decrease in production conditions for the crops in its reports yesterday that were the result of some extreme weather seen recently in Texas and the Southeast. The Delta should have the best looking crops right now. Demand has been weaker so far this year but there are hopes for improved demand with the lower prices.
Overnight News:
Chart Trends: Trends in Cotton are mixed. Support is at 70.00, 68.80, and 67.60 December, with resistance of 73.70, 74.40 and 76.80 December.
This Week Last Qeek Last Year Average
Cotton Squaring 81 64 74 76
Cotton Setting Bolls 42 27 34 34
Very Poor Poor Fair Good Excellent
Cotton This Week 7 11 29 42 11
Cotton Last Week 11 12 32 37 8
Cotton Last Year 8 16 30 39 7
• FCOJ
General Comments: FCOJ closed higher yesterday as the hurricane watch continued but nothing appeared threatening in the forecasts. Traders also continued to react to the USDA production reports released on Friday that showed slight increases in production in Florida and California. A very active year is forecast and there have been some reports of flooding in the state even with no huge storms. The market remains well supported in the longer term based on forecasts for tight supplies and very hot weather in Florida. The reduced production also appears to be at the expense of the greening disease. There are no weather concerns to speak of for Florida or for Brazil right now.
Overnight News:
Chart Trends: Trends in FCOJ are mixed. Support is at 420.00, 410.00, and 403.00 September, with resistance at 443.00, 454.00, and 478.00 September.
• COFFEE
General Comments: New York and London closed higher to start the week despite reports of better rains in Vietnam and Brazil recently. There are still reports of short supplies that could be made worse by ideas of reduced offers of Robusta are still in the market. Offers from Vietnam are reported to be down significantly and the current crop in Brazil along with the next crop in Vietnam s reported to be smaller. The weather forecasters now say that conditions are good in Vietnam, but damage was done to crops earlier in the growing season. A little rain has been reported in Vietnam and in Brazil recently to help crops in both countries. There were also reports of poor Robusta yields in Brazil during the harvest due to small bean sizes. Arabica yields in Brazil and Colombia are reported to be less this year due to extreme weather in both countries.
Overnight News: The ICO daily average price is now 244.12 ct/lb. ICE NY said that 6 contracts were posted for delivery against July contracts and that total deliveries for the month are now 816 contracts.
Chart Trends: Trends in New York are mixed. Support is at 234.00, 228.00, and 222.00 September, and resistance is at 247.00, 250.00 and 258.00 September. Trends in London are mixed. Support is at 4380, 4300, and 4220 July, with resistance at 4680, 4730, and 4800 September.
• SUGAR
General Comments: New York and London closed lower again yesterday as harvest progress in Brazil was the important fundamental and as growing conditions improved in Brazil. The trading yesterday implied that futures have gone down enough for now. Harvest yields of Sugarcane in Brazil are improving. There are still ideas that the Brazil harvest can be strong for the next few weeks amid dry harvest weather. Harvest weather is called good in center-south Brazil.
Overnight News:
Chart Trends: Trends in New York are mixed to down with no objectives. Support is at 1800, 1770, and 1740 October and resistance is at 1880, 1910, and 1950 October. Trends in London are mixed to down with no objectives. Support is at 530.00, 526.00, and 523.00 October, with resistance at 538.00, 555.00, and 562.00 October.
• COCOA
General Comments: New York and London closed higher yesterday as tight supply conditions and reports of good demand are still around. Weather reports indicate it is raining in Ivory Coast and Ghana right now. The current rains can help production of the next crop but have also created disease concerns about the pods. Production concerns in West Africa as well as demand from nontraditional sources along with traditional buyers keep supporting futures, but this support is running its course and the market is searching for a new bullish fundamental. The North American and European grinds were stronger in data released last week, but the Asian grind was down a little. Production in West Africa could be reduced this year due to the extreme weather which included Harmattan conditions. The availability of Cocoa from West Africa remains very restricted.
Overnight News:
Chart Trends: Trends in New York are mixed to up with no objectives. Support is at 7600, 7520, and 6960 September, with resistance at 8670, 8960, and 9540 September. Trends in London are mixed to up with no objectives. Support is at 6250, 5920, and 5360 September, with resistance at 7100, 7420, and 7950 September.
Read Full Story »»»
DiscoverGold
The Corn & Ethanol Report. Critical Stage With Weather
By: Daniel Flynn | July 23, 2024
We kickoff the day with Redbook YoY at 7:55 A.M., Existing Home Sales, Existing Home Sales MoM, Richmond Fed Manufacturing Index, Richmond Fed Manufacturing Shipments Index, and Richmond Fed Services Indeex at 9:00 A.M.,42-Day Bill Auction at 10:30 A.M., 2-Year Note Auction and Money Supply at 12:00 P.M., Milk Production at 2:00 P.M., and API Energy Stocks at 3:30 P.M.
The US Dollar Index has held a range of 101-106 since the start of the year and in a slightly range of 99-107 since late 2022. While the US money supply remains at historic highs, the US government’s financing of record debt levels has created historic demand for the US dollar as foreign investors purchase that debt. Funds have been bullish on the dollar index since May and boosted their net long position significantly in late June. Last week’s CFTC data showed that large speculators were a net long 18,550 contracts, the most since last December. Central US Weather Pattern Discussion: Temps reach into 90’s/low 100’s across the eastern Midwest & mid-Southby Sun/Mon. Temps in the mid 90’swill be common this weekend and next Southern & Western Plains. Soil moisture loss across TX,OK,KS,CO,NE, and Western IA will be rapid. Additionally, there are hints that intense high pressure Ridging blankets the Central US Aug 23-6, which if realized keeps temps across the Plains/W Midwest in the 90’s/low 100’s, Rainfall will be lacking west of the Mississippi River. NOAA’s August climate probabilities confidence in details low, but NOAA places high odds on extension heat in Canada and the Western Plains, while keeping normal/above normal rainfall is isolated to the east/southeast. Weather remains important and no longer are favorable rainfall and mild temps guaranteed. Pollination is still ongoing across the Northern US Corn Belt. Soybeans of course arer a crop of August. Monday’s CBOT open interest data did not reflect the short covering that was expected. Corn open interest rose 4,101 contracts and Chicago wheat 1,745 contracts, while soybeans open interest fell 3,843 contracts. The sharp price rise and record speculative short position should have produced a sharper fall in open interest. The market message is the ownership profile is heavily skewed short, leaving the market vulnerable to future sharp rallies.
Read Full Story »»»
DiscoverGold
Phil Flynn: The Energy Report
By: Phil Flynn | July 23, 2024
China cuts rates to try to support the economy at a time when the physical oil market tightens. The People’s Bank of China on Monday cut the seven-day reverse repo rate to 1.7% from 1.8%, and minutes and lending rates were lowered by the same margin at the monthly fixing. Oil got a bounce but faded. Yet there is still support because even as China’s economic outlook is uncertain, the oil market is tightening anyway. We have discussed the tightening physical market, and it is starting to get more attention.
Bloomberg News and Zero Hedge reported that, “oil prices may have been confined to a tight range this month, but an array of signals from the physical market suggest the next move could be a break to the upside.” Bloomberg is pointing out the same thing we mentioned last week and that was the spreads in the markets that suggest a growing oil global oil supply deficit.
Last week U.S. commercial crude oil inventories (excluding those in the Strategic Petroleum Reserve) decreased by 4.9 million barrels from the previous week. At 440.2 million barrels, U.S. crude oil inventories are about 5% below the five-year average for this time of year. They write, “First of all, there are the time-spreads between monthly futures contracts, which have shown a strengthening premium on prompt deliveries over the past six weeks as US driving demand climbs toward its summertime peak. The so-called flat price of crude has lagged, pressured by concerns over the global economy, but sooner or later may need to catch up. They say “The entrenched premium on prompt supplies — known as backwardation — indicates that global oil inventories are depleting at the swift pace anticipated this quarter by forecasters like the International Energy Agency. This is substantiated by a hefty decline in US crude inventories, down by roughly 20 million barrels over the past three weeks.”
More than likely this week we will see those crude oil Inventories in United States fall even further. I expect to see at least a 3 million barrel draw on crude oil this week but there is some talk that the draw may be even larger. Last week U.S. commercial crude oil inventories (excluding those in the Strategic Petroleum Reserve) decreased by 4.9 million barrels from the previous week. At 440.2 million barrels, U.S. crude oil inventories are about 5% below the five-year average for this time of year.
Biden may be out but his spending on green energy craziness continues. Reuters reports that, “The Biden administration on Monday announced 25 projects pitched by 30 different state, local and tribal governments that applied for $4.3 billion in grants created by the president’s signature climate law. The grants, which will be distributed to winners by early autumn, will support deployment of clean energy technology across sectors ranging from housing to agriculture. The U.S. Environmental Protection Agency (EPA) said it has reviewed nearly 300 applications that requested over $30 billion. The administration has said the selected projects when combined would reduce greenhouse gas pollution by as much as 150 million metric tons of carbon dioxide equivalent (CO2e) by 2030, or roughly 2 percentage points. The U.S. has pledged to slash its CO2e emissions by 50%-52% by that year.”
Yet will it really. So far, the projections by the Biden administration have missed the mark as far as reducing greenhouse gas emissions and by the green energy jobs that they promised. They have missed the mark on global energy security as the risk to move oil and gas is higher than it has been in decades.
On Monday Reuters reported that, “Russian Foreign Ministry spokeswoman Maria Zakharova on Tuesday accused Ukraine of using the issue of energy transit via its territory as a “manipulation button”, the TASS state news agency reported. Slovakia and Hungary said earlier this month that they had stopped receiving oil from Russia’s Lukoil through the Druzhba pipeline after Ukraine imposed a ban last month on the transit of resources from Lukoil via Ukrainian territory. A senior Russian oil industry source said on Tuesday that oil transit had not resumed.
Crack spreads are trying to improve but have been relatively weak over time. Products are looking a little bit better technically and the focus will be on demand today.
Natural gas is rising in increased demand expectations due to power generation, but producers are still struggling with an era of historic low prices. The Energy Information Administration reported that, “U.S. wholesale natural gas spot prices fell to record lows in first half 2024. The average monthly wholesale spot natural gas price at the U.S. benchmark Henry Hub fell by 20% to $2.56 per million British thermal units (MMBtu) between January and June of this year, according to data from Refinitiv Eikon. In January, the Henry Hub price averaged $3.18/MMBtu, then dropped to $1.49/MMBtu in March, marking the lowest average monthly inflation-adjusted price since at least 1997. In addition, prices from February through April 2024 were the lowest ever recorded for these months.
Read Full Story »»»
DiscoverGold
Natural Gas Sharp Rally Targets Higher Resistance Zones
By: Bruce Powers | July 22, 2024
• Natural gas surged from its recent low, breaking an internal downtrend line and aiming for key resistance levels, indicating strong bullish momentum.
Natural gas accelerated an advance on Monday off the recent 2.015 swing low of 2.015. That low completed a 36.2% bearish correction. A five-day high of 2.27 was reached today before there were minor signs of resistance. Where natural gas closes Monday’s trading session will be telling. Slightly stronger demand will be indicated on a daily close above 2.19 rather than below that price level. Given the wide range green candle for today, natural gas looks like it will be testing higher potential resistance levels before this bounce is complete.

Bullish Momentum Points to Higher Targets Starting with 2.39
Today’s sharp rally triggered a breakout of the internal downtrend line, and the subsequent strong bullish reaction shows the market aware of the line. Once the internal downtrend line is broken, the higher trendline becomes a target. Since the purple 20-Day MA, currently at 2.39, recently converged with the higher downtrend line, it can be watched together with the trendline as a potential resistance zone. Moreover, the 20-Day line is quickly followed by a confluence of indicators showing potential resistance at a range from 2.44 to 2.48. It starts with the blue 200-Day MA at 2.44, and includes the 38.2% Fibonacci retracement at 2.45, then ends at an interim swing low of 2.475 from May 28.
The May 28 swing low had significance previously as it was part of the rising price structure of higher swing lows and higher swing highs. Once it was broken to the downside following the June 11 trend high, another bearish reversal signal was indicated. It happened to correlate with support around the 200-Day MA at the time.
Higher Target Zone Begins at 2.57
In case the 2.475 level is broken to the upside, the next higher price zone looks to be from 2.57 to 2.59. The first level is the orange 50-Day MA and the second is the 50% retracement zone at 2.59. Of course, if this higher price level is reached, natural gas will be back above the 200-Day line, 20-Day line and downtrend line, a sign of strength.
Weakness an Opportunity to Position for Upside Continuation
Given the above short-term bullish scenario pullbacks into today’s price range of 2.09 to 2.27 will likely be used by traders as an opportunity to position themselves for a continuation of today’s bounce. If last week’s low completed the retracement, then not only is the 20-Day MA an initial target, but today’s bullish momentum may be the beginning of an advance that eventually attempts another breakout of the top long-term downtrend line.
Read Full Story »»»
DiscoverGold
Let’s Get Physical. The Energy Report
By: Phil Flynn | July 18, 2024
As the polls turn on the Biden-Harris ticket, they may toast themselves and say “We’ll always have Paris” but a Trump-Vance ticket means the Paris Climate accord will have to go. I wonder if we can get our money back.
The Paris Climate accord is just one aspect of the failed Biden energy policy that is one of many reasons his popularity is plunging. Getting back into the accord was one of his sfirst executive orders Biden signed when coming into office effectively spending billions of dollars of taxpayer money before he moved into the White House.
Yet the accord’s failures are legendary and now is facing a global backlash from citizens in the countries where their leadership backs the accord. Despite the billions of dollars spent and the billions of dollars of lost opportunity, the accord has done almost nothing to make a real difference in global greenhouse gas emission that will hit a global all-time high this year.
This comes as EU News reported that, “12 EU countries are set to miss their national climate targets under the Effort Sharing Regulation (ESR), according to a study analyzing national climate plans. Another seven are at risk of not meeting their goals. If they don’t meet their required emissions reductions, they may have to pay financial penalties.
Which means the citizens of their countries will have to be taxed more for policies that have already made their lives miserable. The blowback from the failures of the Paris accord and its impact on global energy prices and its global energy security and the negative impact on people’s lives, is creating a popular global groundswell against these global elitist policies that enriches them and enslaves everyone else.
The Biden electric car mandate is also going up in smoke despite the billions of dollars wasted on a technology that is not equipped to replace the internal combustion engine. Not to mention the billions of dollars of losses that car makers suffered because the government tried to force them into building cars that no one wanted. Not to mention all the union jobs that will not be created because of Biden’s electric car fantasy.
Yet the Biden administration does not let failure or reality kill the dream! And he is willing to keep spending your money to try to make something happen that will not happen.
The Daily Caller wrote the Biden administration announced Thursday that it is spending billions of dollars more to help automakers mass-produce electric vehicles (EVs). The Department of Energy (DOE) is spending $1.7 billion to help manufacturers convert closed or struggling manufacturing facilities to produce EVs or EV components in eight states, including swing states like Pennsylvania and Georgia, as the American EV market struggles. The funding complements $12 billion the DOE unveiled in August 2023 to help major manufacturers retrofit plants for EV production, and the agency projects that the cash announced Thursday will allow for the retention of 15,000 union workers while creating nearly 3,000 jobs.
Of course, when has the Agency been right about any of their green job expectations. This latest taxpayer spending spree is just another desperate attempt to buy some green votes.
Those might be buying some more time after West TX intermediate futures failed to breakthrough $80.00 a barrel on the downside late in the day. The American Petroleum Institute reported that crude supplies fell by 4.44 million barrels which does suggest that the crude oil market in the United states is tightening and that is something that the market has been sensing. We have seen it in the spreads over the last couple weeks.
On the flip side of that, the report showed that distillate inventories rose by 4.92 million barrels. But let’s face it, the distillate worries, especially for heating fuels and winter-based fuels, are out of season. It’s important for the market to build those supplies because the United States is still well below average in distilling inventory.
The API did report an increase of 365,000 in gasoline supply. This comes as US Air travel remains near record highs. US air travel TSA total traveler throughput in million passengers – 7-day average 7.2% above 2019 level.
Russia is promising OPEC that they plan to make compensation cuts to make up for their previous cheating. They say they will make the cuts during the summer season when their domestic demand is weaker because they don’t have the Arctic chill to deal with, but it may be also because the Ukrainians keep hiding their energy infrastructure. Oil exports are now reportedly at the lowest level since January.
On the Internet, Houthi rebels are posting a tape of an attack on an oil tanker in the Red Sea. While nobody was seriously injured, it’s wrong that Houthi rebels can taunt the world with their lawlessness.
Natural gas is flat. This cones as Russia’s Novatek Slashes Gas Output at Sanctioned Arctic LNG 2. The Arctic LNG 2 project in Russia, which Western sanctions have hit in recent months, significantly reduced its production of natural gas in May as it hasn’t exported any LNG yet, a source with knowledge of output data told Reuters on Tuesday. Arctic LNG 2, in which Russian gas producer and LNG exporter Novatek has 60%, extracted 55 million cubic meters of natural gas in May, down from 215 million cubic meters in April, according to Reuters’s source. Located in the Gydan Peninsula in the Arctic, the Arctic LNG 2 project was considered key to Russia’s efforts to boost its global LNG market share from 8% to 20% by 2030-2035.
Read Full Story »»»
DiscoverGold
Commodities Daily Market Movers (% Price Change)
By: Marty Armstrong | July 18, 2024
• Top Movers
Oats (CBOT) Futures 3.58 %
Oats (Minneapolis) 3.27 %
Gold / Silver Ratio 3.22 %
Lumber (CME) Futures 2.78 %
NY Crude Oil Futures 2.59 %
• Bottom Movers
NY Natural Gas Futures 6.99 %
Orange Juice (NYCE) Futures 4.42 %
NY Silver COMEX Futures 3.44 %
AU - Victoria Base-Load Electricity Futures 2.56 %
Soybean Oil CBT Futures 2.11 %
*Close from the last completed Daily
DiscoverGold
Natural Gas Tests Key Support After Sharp Drop
By: Bruce Powers | July 17, 2024
• Despite a sharp selloff to 2.02, natural gas could find support at 2.00, signaling possible buyer interest and a potential rebound.
Natural gas fell to a new retracement low of 2.02 on Wednesday. That put it in a position to test support around the next target zone from 2.02 to 2.00. The first price is the completion of a falling ABCD pattern with the CD leg of the decline extended by 161.8% of the AB leg. As of today’s low, natural gas has dropped by 1.14 or 36.2% from the most recent 3.16 swing high. Downward pressure remains and at the time of this writing, natural gas continues to trade near the lows of the day.

Lower Support Starts Around 1.92
If the 2.02 support zone fails to hold, a drop below 2.00 will have the price of natural gas heading towards the 78.6% Fibonacci retracement at 1.92. That price is given further significance as it confirmed by the gap up support level from late-April at 1.91.
Natural gas fell hard on Wednesday as it was down by as much as 0.16 cents or 7.5% for the day. It has established a wide price range for the day with a full body red candle. And it is on track to close weak, in the lower third of the day’s trading range.
Current Support May Lead to a Bounce
Nonetheless, it is possible that the 2.00 price area holds as support and attracts buyers. Today’s sharp selloff has occurred further into the downtrend and therefore, nearer to the end of the decline than it had been previously. A sharp drop near the end of a trend can sometimes signal capitulation as holders can longer take the pain of loss and finally sell. That creates a vacuum that allows for a potential sharp bounce.
Breakout Above Trendline Give First Sign of Strength
Unfortunately, on a daily chart there is no sign of strength until natural gas rallies above today’s high of 2.21. Of course, that may change in the coming days as alternative price levels may become apparent. Be that as it may, more aggressive investors and traders may key off intraday price patterns as they watch for signs of a bullish reversal from a key support zone. As noted previously, a rally above the internal downtrend line will provide a sign of strength, but trendlines are typically not too reliable on their own. Breaks through trendlines are more useful when confirmed by additional signs of strength.
Read Full Story »»»
DiscoverGold
Grains Report: Wheat, Rice, Corn and Oats, Soybeans, Canola and Palm Oil
By: Jack Scoville | July 17, 2024
• WHEAT
General Comments: Wheat was lower in all three markets again yesterday with follow through selling seen due to increased Winter Wheat production estimates from USDA and on demand concerns. The production data helped push ending stocks estimates above trade expectations. The failed assassination attempt on Mr. Trump helped boost the stock markets but hurt agricultural goods as Trump is likely to greatly increase tariffs to cut income taxes. That hurt demand ideas for US agricultural goods. US harvest progress and ideas of good yields and crops went against reports of hot and dry weather in eastern Europe and Russia and too wet weather in France are still heard and the weather there affecting world production estimates. There were more reports of hot temperatures coming this week to Russian growing areas. It has also been very dry there. Eastern Europe is also hot and dry. Western Europe has seen too much rain.
Overnight News:
Chart Analysis: Trends in Chicago are down with objectives of 525 and 489 September. Support is at 526, 520, and 514 September, with resistance at 557, 581, and 592 September. Trends in Kansas City are down with objectives of 535 and 507 September. Support is at 546, 540, and 534 September, with resistance at 564, 590, and 601 September. Trends in Minneapolis are down with objectives of 575 and 541 September. Support is at 572, 566, and 560 September, and resistance is at 598, 603, and 61-0 September.
• RICE
General Comments: Rice closed lower as futures continued to move lower and reflect mostly good growing conditions and increased planted area. Hurricane Beryl has brought beneficial rains to Arkansas and other parts of the Delta. The US weather has been an issue much of the growing season with too much rain early in the year. Supply tightness is expected to give way to increased production this year and greatly increased supplies this Fall.
Overnight News:
Chart Analysis: Trends are down with objectives of 1419 and 1382 September. Support is at 1440, 1428, and 1416 September and resistance is at 1456, 1471, and 1489 September
• CORN AND OATS
General Comments: Corn closed higher and Oats closed lower. It was a short covering rally in Corn based on ideas that future reflected big yield potential and were cheap enough. USDA issued new crop condition ratings on Monday and they were unchanged from the previous week. Hurricane Beryl brought beneficial precipitation to the southern and eastern Midwest. Current forecasts call for cooler and drier weather for the Midwest this week. The US weather features moderate temperatures and increasing chances for rains. Northern areas such as southern Minnesota that have had way too much rain and flooding is still reported. Some selling came from reduced demand ideas. The failed assassination attempt on Mr Trump created ideas that his election was much more likely, and this helped boost the stock markets but hurt agricultural goods as Trump is likely to greatly increase tariffs to cut income taxes. That hurt demand ideas for US agricultural goods.
Overnight News:
Chart Analysis: Trends in Corn are down with no objectives. Support is at 388, 385, and 382 September, and resistance is at 403, 412, and 426 September. Trends in Oats are mixed. Support is at 301, 296, and 290 September, and resistance is at 324, 327, and 331 September
• SOYBEAN
General Comments: Soybeans and Soybean Meal closed higher yesterday as the weather improved and demand did not. Soybean Oil closed lower. There was more beneficial precipitation in much of the Midwest over the weekend and again yesterday. The NOPA crush report released on Monday showed less than expected demand at 177 million bushels for June. Some selling came from reduced demand ideas. The failed assassination attempt on Mr Trump created ideas that his election was much more likely, and this helped boost the stock markets but hurt agricultural goods as Trump is likely to greatly increase tariffs to cut income taxes. That hurt demand ideas for US agricultural goods. Reports indicate that China remains an active buyer of Soybeans in Brazil. Domestic demand has been strong in the US but has suffered as crushers were crushing for oil.
Overnight News:
Chart Analysis: Trends in Soybeans are down with no objectives. Support is at 1068, 1056, and 1044 August, and resistance is at 1102, 1130, and 1151 August. Trends in Soybean Meal are down with objectives of 318.00 August. Support is at 331.00, 329.00, and 326.00 August, and resistance is at 339.00, 344.00, and 351.00 August. Trends in Soybean Oil are up with objectives of 4660 and 4890 August. Support is at 3910, 3840, and 3790 August, with resistance at 3960, 4000, and 6050 August.
• CANOLA AND PALM OIL
General Comments: Palm Oil was higher today on apparent short covering and new speculative buying even with ideas of increasing supplies. Reports indicate that production is rising as well. Export demand has been very strong in recent private reports but has been weaker in recent days. There is talk of increased supplies available to the market, and the trends are down on the daily charts. Canola was a little higher yesterday as oilseed supplies look to be ample in the coming year and as demand ideas are down. The daily charts show that Canola trends are down.
Overnight News:
Chart Analysis: Trends in Canola are down with no objectives. Support is at 605.00, 599.00, and 591.00 November, with resistance at 632.00, 638.00, and 648.00 November. Trends in Palm Oil are mixed. Support is at 3830, 3790, and 3770 October, with resistance at 3910, 3960, and 4100 October.
Midwest Weather Forecast Showers and storms mostly south and east. Temperatures should average below normal.
Read Full Story »»»
DiscoverGold
Softs Report: Cotton, OJ, Coffee, Sugar, Cocoa
By: Jack Scoville | July 17, 2024
• COTTON
General Comments: Cotton was lower yesterday in Turnaround Tuesday trading and as ideas of weaker demand if Trump wins again finally hit the market. USDA on Friday increased production estimates by one million bales and left the demand side untouched for an increase in US ending stocks levels. World ending stocks levels were reduced slightly as world growing conditions are more suspect. The demand as reflected in the weekly USDA export sales report was poor. The Commitments of Traders report showed that large speculators increased short positions, but futures held 70 cents and rebounded from this level yesterday. It looks like futures are cheap enough for now. USDA showed a decrease in production conditions for the crops in its reports yesterday that were the result of some extreme weather seen recently in Texas and the Southeast. The Delta should have the best looking crops right now. Demand has been weaker so far this year but there are hopes for improved demand with the lower prices.
Overnight News:
Chart Trends: Trends in Cotton are mixed. Support is at 70.00, 68.80, and 67.60 December, with resistance of 73.70, 74.40 and 76.80 December.
• FCOJ
General Comments: FCOJ closed a little lower yesterday as the hurricane watch continued but nothing appeared threatening in the forecasts. Traders also continued to react to the USDA production reports released on Friday that showed slight increases in production in Florida and California. A very active year is forecast and there have been some reports of flooding in the state even with no huge storms. The market remains well supported in the longer term based on forecasts for tight supplies and very hot weather in Florida. The reduced production also appears to be at the expense of the greening disease. There are no weather concerns to speak of for Florida or for Brazil right now.
Overnight News: ICE said that 0 notices were posted for delivery against July futures and that total deliveries for the month are now 147 contracts.
Chart Trends: Trends in FCOJ are mixed. Support is at 433.00, 421.00, and 410.00 September, with resistance at 478.00, 484.00, and 490.00 September.
• COFFEE
General Comments: New York closed a little higher and London closed a little lower yesterday. There are still reports of short supplies that could be made worse by ideas of reduced offers of Robusta are still in the market. Offers from Vietnam are reported to be down significantly and the current crop in Brazil along with the next crop in Vietnam s reported to be smaller. These markets are up sharply one day and down sharply the next, but the rally days are bigger than the loss days. The weather forecasters now say that conditions are good in Vietnam, but damage was done to crops earlier in the growing season. A little rain has been reported in Vietnam recently to help crops there. There were also reports of poor Robusta yields in Brazil during the harvest due to small bean sizes.
Overnight News: The ICO daily average price is now 244.53 ct/lb. ICE NY said that 44 contracts were posted for delivery against July contracts and that total deliveries for the month are now 808 contracts.
Chart Trends: Trends in New York are mixed. Support is at 241.00, 239.00, and 232.00 September, and resistance is at 258.00, 264.00 and 270.00 September. Trends in London are mixed to up with no objectives. Support is at 4390, 4300, and 4220 July, with resistance at 4680, 4730, and 4790 September.
• SUGAR
General Comments: New York and London closed a little lower yesterday as harvest progress in Brazil was the important fundamental but as world supplies remain rather tight. The trading yesterday implied that futures have gone down enough for now. Harvest yields of Sugarcane in Brazil are improving, and UNICA said that Sugar production was up more than 20% from last year at 3.25 million tons. The market had expected this increase. There are still ideas that the Brazil harvest can be strong for the next few weeks amid dry harvest weather. Harvest weather is called good in center-south Brazil.
Overnight News:
Chart Trends: Trends in New York are mixed to down with no objectives. Support is at 1910, 1880, and 1860 October and resistance is at 2050, 2070, and 2090 October. Trends in London are mixed to down with no objectives. Support is at 538.00, 530.00, and 526.00 October, with resistance at 572.00, 581.00, and 599.00 October.
• COCOA
General Comments: New York and London closed lower yesterday and both markets tested support ares before starting to bounce a little bit. The European Cocoa grind was 357,502 tons, up 4.1% from last year. The data was supportive to prices. Production concerns in West Africa as well as demand from nontraditional sources along with traditional buyers keep supporting futures, but this support is running its course and the market is searching for a new bullish fundamental. Production in West Africa could be reduced this year due to the extreme weather which included Harmattan conditions. The availability of Cocoa from West Africa remains very restricted.
Overnight News: ICE NY said that 0 notices were posted for delivery against July futures and that total deliveries for the month are now 1,970 contracts.
Chart Trends: Trends in New York are mixed to up with no objectives. Support is at 7800, 7520, and 6960 September, with resistance at 8670, 8960, and 9540 September. Trends in London are mixed to up with no objectives. Support is at 6520, 6250, and 5920 September, with resistance at 7420, 7940, and 8300 September.
Read Full Story »»»
DiscoverGold
Tumbling Corn Prices Have More Room to the Downside
By: Barchart | July 16, 2024
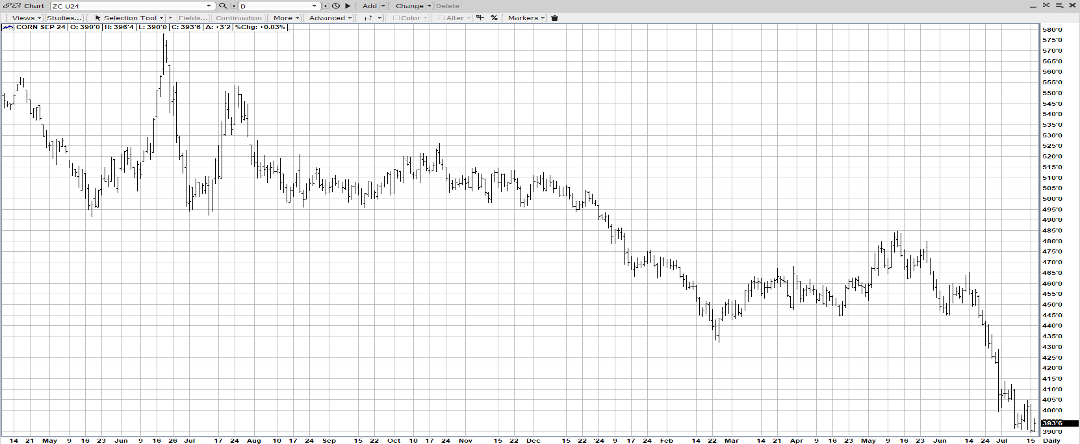
• Corn market participants have seen a steep fall after prices peaked in the Spring of 2022. Last year's planting season rally saw prices peak at $6.30 based on the new crop December 2023 futures. Many farmers/producers held onto their crops, anticipating higher prices. However, record production in the US and Brazil led to an oversupply, causing prices to plummet. Consequently, US corn storage on farms soared to a 16% increase over the prior year and hit an all-time high. Farmers now face storage costs amid higher interest rates while hoping for a price rebound, but with prices just above $4 per bushel and the break-even point slightly above $5.00, selling will need to be done on price rallies.
Are new 2024 December futures contract lows ahead?

Source: Barchart
The price downtrend following the 2024 planting season rally is persistently continuing. Last Friday's USDA report was generally bullish for corn, but it was aggressively sold as prices declined to the trend lows. The contract low for the December 2024 futures contract was created in 2020 at $3.95. As of this writing, the lowest price for this seasonal downtrend since May has been $4.03.
Will the funds press the corn market to new contract lows?

Source: Drought.gov
The recent drought map as of July 09 shows the US corn belt, Nebraska to Ohio, and good moisture levels for the recently planted corn as it enters its pollination period. There is no evidence of flooding or too much rain to cause problems. Looking at Iowa, the largest corn producer, where in 2023 they produced 16% of the nation's corn, is looking great for this time of the year...
* * *
Read Full Story »»»
DiscoverGold
Agriculture Master Report
By: Bill Moore | July 16, 2024
SEPT CORN
The 7-12-24 USDA Report issued last Friday was friendly – basically leaving production at 15.1 & yield at 181.00 – both as expected but lowering both US & World carry-out for 23-24 & 24-25! That resulted in an up day Friday – however, benign pollination weather over the W/E & the Trump assassination attempt Sat both pressured the mkt Mon! The consensus is that the incident helped Trump & that his tariff policies with China would be harmful to grain trade! Finally, last nite, the Gd-Ex ratings stayed at 68% (exp 1-2% higher) & this gave a boost to corn today! Mon inspections were solid at 1.07mmt & cumulatively are up 31% for the year! The short fund position is a record & would offer extensive short-covering on good news!
AUG BEANS
Aug Beans have been in virtual “free fall” in the past 10 days – dropping a full $1.00 (1170 – 1075)! Non-threatening weather & anticipated tariff policies against China – should Trump get elected – have applied continuous pressure on prices the last few days – as well, Monday Inspections were a meager 168,000 mt! A 53-53.5 yield has already been built into the price structure! However, the mkt is grossly oversold, the Friday Crop Report was friendly & Beans really aren’t made until August! Also, the lower prices should increase export demand! An upside correction is overdue
SEPT WHT
Sept Wht has been pummeled by a negative USDA Report which raised US Wht Production & yesterday’s Gd-Ex Crop Rating at 77% – the highest since June 2019! The result was a 45 cent drop in Sept Wht (580-525) in a mere 4 trading days! But harvest at 71% (avg -62) is well over the half-way mark & harvest pressure should be easing now! And recent exports have been superb – yesterday at 533 mmt with the cumulative #’s running 26% over 2023! Much like her “sister mkts”, Sept Wht is quite oversold!
AUG CAT
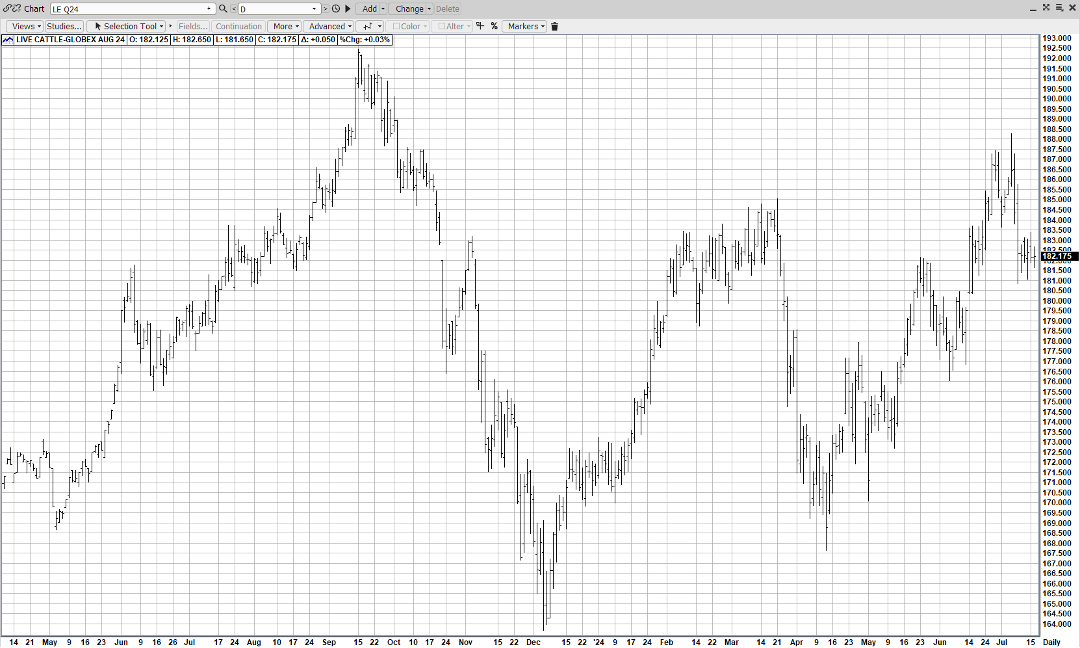
After correcting a quick $7.00 (188-181) last week, the mkt has congested in a tight range – closing 4 consecutive days within a 50 cent range (182-182.50)! The Aug Cattle is trading $12 under last weeks cash & exports have been solid! But the mkt, after a sterling upswing – now can’t seem to make up its mind – whether to resume its up or continue lower – probably confirming a top! Demand will play a big role in determining the outcome – & with the wide disparity between pork & beef in the grocery store, the much cheaper pork may be getting the nod!
AUG HOGS
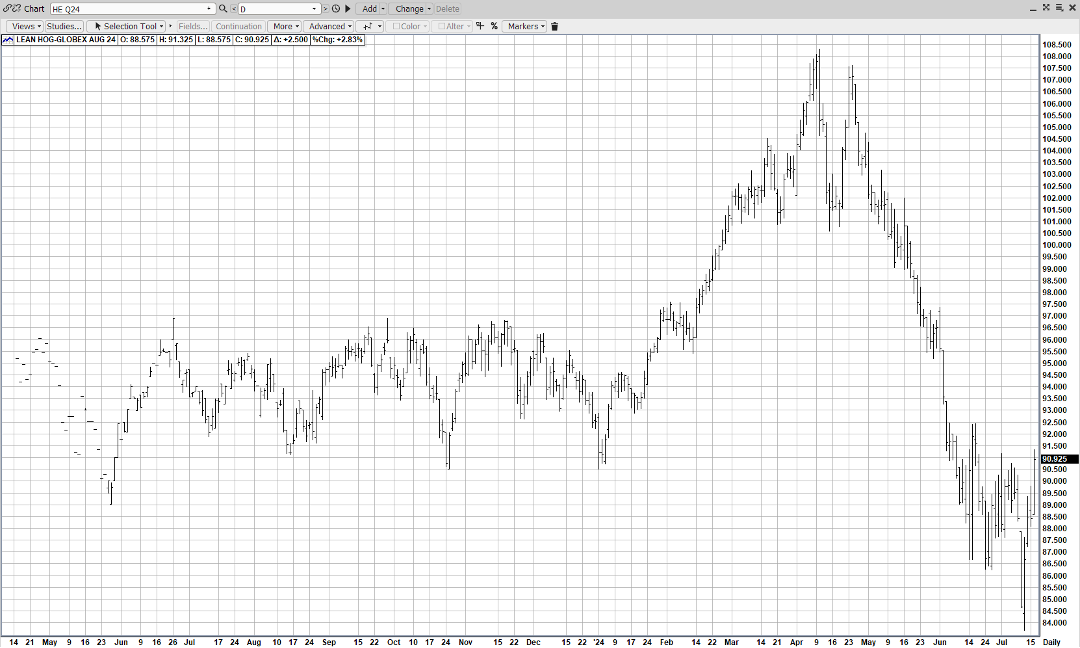
After several false starts – in attempting to carve out a bottom after a stunning $24 plummet (108-84), Aug Hogs appear to have finally “done the deed” – with a strong key reversal last week – on heavy volume – followed by several strong closes – resulting in a near vertical $7 upsurge (84-91)! The technical confirmation of a low was supported by positive fundamentals as various reports of African Swine Fever spreading in Asia have thrown demand pork’s way! Further support from reduced slaughter & avg hog weights would be welcome in validating the turn-around!
Read Full Story »»»
DiscoverGold
The Corn & Ethanol Report. Bearish – Political Risks – Weather – Yields?
By: Daniel Flynn | July 16, 2024
We kickoff the day with Business Inventories, Export Prices MoM & YoY, Import Prices MoM & YoY, Retail Sales MoM & YoY, Retail Sales Ex Autos MoM, and Retail Sales Ex Gas/Autos MoM at 7:30 A.M., NAHB Housing Market Index and Retail Inventories Ex Autos MoM at 9:00 A.M., 42-Day Bill Auction at 10:30 A.M., Fed Kugler Speech at 1:45 P.M., API Energy Stocks at 3:30 P.M.
Gold futures closed higher after nearby futures set a record high on Monday at $2,436/oz. Funds continue to put money in the gold market as the US dollar continues to lose purchasing power, but so far, record and near-record prices have found limited commercial selling. Last week’s Commitment of Traders report showed that for the week ending July 9, funds bought 13,000 contracts against commercial selling of 6,800 contracts. The Tue-Tue price changed was +37.10, While gold prices have yet to reach levels that are high enough to stimulate significant commercial selling. Near Term Heat/Dryness Confined to North/West US & Canada; Sustained Heat Absent Elsewhere; Thunderstorms Hit IA, IL and Southern WI Lat Night: The Central US forecast is broadly favorable in that additional rain is forecast eastern Midwest and mid-South over the next three days and as Central US temps moderate beginning Tuesday. NOAA’s 6-10 day temp probability has readings above 90 degrees July 16-25 will be confined to far southern and western US and pockets of the Dakotas. Temps elsewhere are projected in the 70’s & 80’s. Last night’s storms were intense in E IA, IL, and Southern WI. Otherwise, additional showers across the E Corn Belt will be welcomed. Heavy rain in TX, LA, and the Southeast will begin to ease moisture deficits, which have become massive in the Carolinas and VA. Global corn markets ended weaker on Monday as concern over worsening US-China relations increase and Midwest weather forecast lacked widespread heat into late July. The market is prepped for higher US yield and rising US end stocks in USDA’s August WASDE. The US corn crop on Sunday was rated at 68% good-to-excellent, unchanged from the prior week. Ratings were down week-over-week in all states but IL, IN, MO, ND, and WI. Traders were braced for a 1-2% gain in good-to-excellent ratings which will likely spur a short covering bounce on Tuesday US corn is cheap in the world market. Black Sea drought shows no sign of ending and even with a state holiday, basis offers were up 8 cents. Amid enlarged export demand, a complete reassessment of the trade’s US and world balance sheet is underway if US fails to cross the 180 BPA threshold this year. Managed funds are now short 360,000 contracts which is viewed as excessive. And the extended range forecast model calls for heat returning to the Central US beyond July 25th . Weather and yield potential are at a critical juncture, as well as managed fund activity. And overall, it is no secret that world ag markets are deeply oversold. Ride Turnaround Tuesday.
Read Full Story »»»
DiscoverGold
Commodities Daily Market Movers (% Price Change)
By: Marty Armstrong | July 16, 2024
• Top Movers
LME Aluminum Alloy 7.98 %
White Sugar ICE Futures 3.34 %
Cocoa (NYCSCE) Futures 3.29 %
Cotton 3.17 %
Sugar World (CSCE) Futures 2.92 %
• Bottom Movers
NY Natural Gas Futures 7.34 %
NSW Baseload Electricity Continuous 4.56 %
Lumber (CME) Futures 4.53 %
Wheat #2 4.11 %
Wheat CBT Futures 3.31 %
*Close from the last completed Daily
DiscoverGold
Corn closes at lowest price since November 2020
By: Barchart | July 15, 2024
• Corn closes at lowest price since November 2020.

Read Full Story »»»
DiscoverGold
Lumber has fallen to its lowest price since January 2023. It's now down 25% over the past 4 months.
By: Barchart | July 15, 2024
• Lumber has fallen to its lowest price since January 2023. It's now down 25% over the past 4 months.

Read Full Story »»»
DiscoverGold
Natural Gas Sellers Dominate as Support Levels Break
By: Bruce Powers | July 15, 2024
• Sellers dominate natural gas as it falls to 2.16, testing and breaking support levels, with potential further declines if it closes below 2.17.
Sellers continued to dominate trading in natural gas on Monday as it further retraced the previous advance. Natural gas fell to a new retracement low of 2.16, at the time of this writing, and it continues to trade near the lows of the day. It entered a potential resistance zone starting at 2.23 but has so far seen no slowdown in the descent. The price zone has a lower border around

Lower Target Price Zone Fails to Stop Descent
Two Fibonacci targets were tested as support, and they failed to stop the decline. A descending ABCD pattern completed at 2.20. The target comes from an extended version of the pattern where the second decline marked by CD is 127.2% the distance in price for the first leg down, from point A to point B. The 127.2% Fibonacci ratio is derived from square root of 1.618 (the golden ratio) multiplied by 100. Further, a 61.8% Fibonacci retracement completed at 2.18. The low of the potential support zone as highlighted on the chart was 2.17.
Close Below 2.17 Points to Lower Prices
Since the bottom of the support zone has been broken to the downside the next lower support zone is at risk of being reached. Nevertheless, support zones are areas of possible support. If a daily close occurs today above 2.17, natural gas may have a chance to bounce in the short-term.
Otherwise, a daily close below 2.17, points to lower prices in the near-term. There looks to be an interim price level around 2.09, from a prior internal swing high. But the next key lower price zone where support may be seen is down to around 2.00. That is an even number and where the recent rise in prices began.
Lower 2.00 Support Zone
The initial bullish advance off the confirmed an upside breakout of a symmetrical triangle bottom consolidation pattern at 2.00. That was the top of the triangle pattern where a rise above further confirms the bull breakout. There is also the completion of another lower target for an extended falling ABCD pattern at 2.02. In this case, the extension utilized the 161.8% ratio to identify a lower target for the CD leg of the decline. Lower still is the 78.6% Fibonacci ratio at 1.92.
Read Full Story »»»
DiscoverGold
The Corn & Ethanol Report
By: Daniel Flynn | July 15, 2024
We kickoff the day with NY Empire State Manufacturing Index at 7:30 A.M., Export Inspections at 10:00 A.M., NOPA Crush Report at 11:00 A.M., Fed Chair Powell Speech at 11:30 A.M., Crop Progress at 3:00 P.M., and Fed Daly Speech at 3:35 P.M.
The CBOT opened week to mixed to slightly higher, and quickly retreated on favorable US weather and a stronger US dollar following the Saturday attempted assassination of former President Trump. Ag Resources (ARC) Notes: The stricken President emerged politically stronger which has held varied impacts on financial markets. In the grains, the fear is that Trump will place new tariffs on China which will deepen a trade war that started back in 2018. Net US agricultural trade is in decline. My take is simple, Free Markets For Free Men, that means a fair balance of trade with an equal playing field or I am for tariffs. However, (ARC continues), it’s far too early to react after November’s winner and their coming policies, but China’s absence as a US corn/soybean buyer in recent months is worrisome. The key question going forward is will China step up their US demand ahead of the US election fearing higher tariffs sometime in mid-2025. Current CBOT pieces reflect strong Chinese import margins. Central US weather forecasts are generally favorable with no extreme heat forecast into the Gulf States and Southeastern US. The market is trading 182-184 BPA corn and 53 BPA soybean yield. NASS in the August report will adjust US planted and harvested acres due to FSA data. ARC is looking for a combined 1.5-2.0 acre fall in corn and soybeans.
Read Full Story »»»
DiscoverGold
Wheat closes at lowest price since April 2
By: Barchart | July 12, 2024
• Wheat closes at lowest price since April 2.

Read Full Story »»»
DiscoverGold
Hedge Funds are now short more than 500,000 contracts on Corn, the largest short position in history
By: Barchart | July 12, 2024
• Hedge Funds are now short more than 500,000 contracts on Corn, the largest short position in history.

Read Full Story »»»
DiscoverGold
Natural Gas Eyes Bullish Retracement Amid Key Reversal
By: Bruce Powers | July 12, 2024
• Natural gas dipped to 2.25 before reversing above 2.34, indicating a potential bullish retracement toward resistance zones at 2.45 and beyond.
Natural gas dipped briefly to a new retracement low of 2.25 earlier on Friday before buyers took control and drove it back above yesterday’s high. It is on track to confirm a reversal day if it can close above yesterday’s high of 2.34. At the time of this writing, natural gas continues to trade near the highs of the day.

Buyers Show Interest
Today’s low was just shy of reaching of potential support zone for around 2.23 to 2.17. Nonetheless, a likely strong daily close and a key reversal day shows buyers stepping up. That may lead to a bullish retracement to test potential areas of resistance. If natural gas stays within the downtrend (retracement) price structure following a bounce, a test of the lows and possibly the slightly lower support zone may yet occur.
Resistance Zone from 2.45 to 2.475
A key price zone to watch for resistance is around the 200-Day MA, which is now at 2.46. That moving average can be watched together with the previous swing low of 2.475 as they are close to each other. Moreover, the most recent minor swing high of 2.45 is a little lower than the 200-Day line. It has some significance as it was the first day in eight days down that exceeded the previous day’s high.
An advance above 2.45 improves the chance that natural gas can challenge resistance around the 200-Day MA. It would show strength as the 2.45 swing high makes up part of the downtrend price structure of lower swing highs and lower swing lows. A daily close above the price level would confirm strength and improve the chance for a continuation higher. The next higher potential resistance zone looks to be from the 50-Day MA at 2.56 and up to the 20-Day MA at 2.59.
Higher Target Goes From 2.56 to 2.59
Notice that the 50-Day line continues to rise, and it is approaching the 20-Day line. Also, the 20-Day line is falling and has converged with the 38.2% Fibonacci retracement at 2.60. In general, in Fibonacci analysis, a minimum retracement to at least the 38.2% retracement is common. On June 28 support was found around the same price area as the 38.2% retracement. However, that support level didn’t last long as the next day natural gas continued to fall. A downtrend line for the current decline has been added to the chart to provide additional guidance during an advance.
Read Full Story »»»
DiscoverGold
The Corn & Ethanol Report
By: Daniel Flynn | July 12, 2024
We kickoff the day with PPI MoM & YoY, Core PPI MoM & YoY, PPI, and PPI Ex Food, Energy, and Trade MoM & YoY at 7:30 A.M., Michigan Consumer Sentiment Prel, Michigan 5-Year Inflation Expectations Prel, Michigan Consumer Expectations Prel, Michigan Current Conditions Prel, and Michigan Inflation Expectations Prel at 9:00 A.M., Crop Production, USDA Supply/Demand and WASDE at 11:00 A.M., and Baker Hughes Oil & Total Rig Count at 12:00 P.M.
CBOT futures are lower in the expectation of a bearish USDA crop report this morning. The addition of planted US corn area and larger June corn/wheat stocks has traders expecting larger 2024/25 end stocks. The USDA will release the report at 11:00 A.M. central. The reaction of the market to the report, and not the report itself, will key price direction into the weekend. We also are at a pivotal time in the growing season and the bets are on what the US crop yield potential and the reality of what it is capable of. Remember managed money is heavy short. Thursday’s CBOT open interest data showed a decline in grains but an increase in soybeans. Corn open interest was down 7,668 contracts, Chicago wheat of 6,373 contracts and soybeans up 5,329.
Read Full Story »»»
DiscoverGold
Grains Report: Wheat, Rice, Corn and Oats, Soybeans, Canola and Palm Oil
By: Jack Scoville | July 12, 2024
• WHEAT
General Comments: Wheat was higher in all three markets yesterday in preparation for the USDA WASDE reports to be released later today. US harvest progress and ideas of good yields and crops went against reports of hot and dry weather in eastern Europe and Russia and too wet weather in France are still heard and the weather there affecting world production estimates. Russia is likely to expand the war and has reportedly started to make some threats against the US and NATO countries. The US harvest is expanding through Kansas and is now more than 50% complete for the country as a whole and adverse world growing conditions are still around. There were more reports of hot temperatures coming this week to Russian growing areas. It has also been very dry there. Eastern Europe is also hot and dry. Western Europe has seen too much rain.
Overnight News:
Chart Analysis: Trends in Chicago are mixed. Support is at 550, 544, and 538 September, with resistance at 581, 592, and 600 September. Trends in Kansas City are mixed. Support is at 552, 546, and 540 September, with resistance at 590, 601, and 615 September. Trends in Minneapolis are down with no objectives. Support is at 602, 596, and 590 September, and resistance is at 628, 636, and 646 September.
• RICE
General Comments: Rice closed a little higher as the market prepared for the WASDE reports from USDA later today. Hurricane Beryl has passed by but hit growing areas with the damaging parts of the storm in and around the Houston area. The system has brought beneficial rains to Arkansas and other part of the Delta. The US weather has been an issue much of the growing season with too much rain early in the year and now a hurricane that dropped big amounts of rain on cops again along with some high winds. Inland Texas areas could also see too much rain. Supply tightness is expected to give way to increased production this year and greatly increased supplies this Fall.
Overnight News:
Chart Analysis Trends are down with no objectives. Support is at 1451, 1441, and 1428 September and resistance is at 1498, 1611, and 1518 September
• CORN AND OATS
General Comments: Corn closed mostly a little higher and Oats closed higher as the market prepared for the release of the WASDE reports from USDA today. Hurricane Beryl brought beneficial precipitation to the southern and eastern Midwest. Current forecasts call for hotter and drier weather for the Midwest later this week. Weakness was based on hopes for improved crop condition ratings to be released on Monday afternoon. The US weather features moderate temperatures and increasing chances for rains. Northern areas such as southern Minnesota that have had way too much rain and flooding is still reported.
Overnight News:
Chart Analysis: Trends in Corn are down with no objectives. Support is at 391, 388, and 385 September, and resistance is at 403, 412, and 426 September. Trends in Oats are mixed. Support is at 296, 290, and 284 September, and resistance is at 322, 327, and 331 September.
• SOYBEANS
General Comments: Soybeans and the products closed mostly a little higher yesterday as the market prepared for the USDA WASDE reports to be released later today. Hurricane Beryl brought beneficial precipitation to areas of the southern and eastern Midwest where conditions have been too dry until now. Northern and western areas should turn drier which is also beneficial for crops. Reports indicate that China remains an active buyer of Soybeans in Brazil but has cut back and increased purchases from the US on demand due to the tax issues in Brazil and on Brazil logistical concerns. Domestic demand has been strong in the US but has suffered as crushers were crushing for oil. Oil demand has suffered as cheaper alternatives for feedstocks hit the biofuels market.
Overnight News:
Chart Analysis: Trends in Soybeans are mixed to down with objectives of 1117 and 1094 August. Support is at 1104, 1092, and 1080 August, and resistance is at 1130, 1151, and 1170 August. Trends in Soybean Meal are down with objectives of 334.00 and 318.00 August. Support is at 337.00, 334.00, and 331.00 August, and resistance is at 344.00, 351.00, and 359.00 August. Trends in Soybean Oil are up with objectives of 4660 and 4890 August. Support is at 4510, 4440, and 4390 August, with resistance at 5030, 5090, and 6050 August.
• CANOLA AND PALM OIL
General Comments: Palm Oil was higher yesterday on demand. Reports indicate that production is rising as well. Export demand has been very strong in recent private reports but has been weaker in recent days. There is talk of increased supplies available to the market, and the trends are down on the daily charts. Canola was higher yesterday along with US prices. The daily charts show that Canola trends are down.
Overnight News:
Chart Analysis: Trends in Canola are down with objectives of 636.00 and 625.00 November. Support is at 615.00, 599.00, and 591.00 November, with resistance at 648.00, 664.00, and 670.00 November. Trends in Palm Oil are mixed to down with objectives of 3770 and 3630 September. Support is at 3850, 3830, and 3780 September, with resistance at 4000, 4050, and 4090 September.
Midwest Weather Forecast Showers and storms mostly south and east. Temperatures should average below normal.
Read Full Story »»»
DiscoverGold
Softs Report: Cotton, OJ, Coffee, Sugar, Cocoa
By: Jack Scoville | July 12, 2024
• COTTON
General Comments: Cotton was a little lower yesterday as Hurricane Beryl is part of the past and as traders look ahead to the USDA WASDE reports due on Friday. The demand as reflected in the weekly USDA export sales report was poor. USDA showed a decrease in production conditions for the crops in its reports this week that were the result of some extreme weather seen recently in Texas and the Southeast. The Delta should have the best looking crops right now. Demand has been weaker so far this year but there are hopes for improved demand with the lower prices. Chinese consumer demand has held together well, and Chinese demand for Cotton has started to increase.
Overnight News: ICE said that 0 notices were posted for delivery against July futures and that total deliveries for the month are now 132 contracts.
Chart Trends: Trends in Cotton are mixed. Support is at 70.00, 68.80, and 67.60 December, with resistance of 72.30, 73.70 and 74.40 December.
• FCOJ
General Comments: FCOJ closed lower as the hurricane watch continued. Hurricane Beryl missed Florida and there are no other storms in sight for the state for now, but a very active year is forecast and there have been some reports of flooding in the state even with no huge storms. The market remains well supported in the longer term based on forecasts for tight supplies and very hot weather in Florida. The reduced production appears to be at the expense of the greening disease. There are no weather concerns to speak of for Florida or for Brazil right now. The weather has improved in Brazil with some moderation in temperatures and increased rainfall amid reports of short supplies in Florida and Brazil are around but will start to disappear as the weather improves and the new crop gets harvested.
Overnight News: ICE said that 0 notices were posted for delivery against July futures and that total deliveries for the month are now 147 contracts.
Chart Trends: Trends in FCOJ are mixed. Support is at 433.00, 421.00, and 410.00 September, with resistance at 478.00, 484.00, and 490.00 September.
• COFFEE
General Comments: New York and London closed higher on more reports of short supplies that could be made worse by ideas of reduced offers of Robusta are still in the market. Offers from Vietnam are reported to be down significantly and the current crop in Brazil along with the next crop in Vietnam s reported to be smaller These markets are up sharply one day and down sharply the next, but the rally days are bigger than the loss days. The weather forecasters now say that conditions are good in Vietnam, but damage was done to crops earlier in the growing season. A little rain has been reported in Vietnam recently to help crops there. There were also reports of poor Robusta yields in Brazil during the harvest due to small bean sizes.
Overnight News: The ICO daily average price is now 247.48 ct/lb. ICE NY said that 21 contracts were posted for delivery against July contracts and that total deliveries for the month are now 682 contracts.
Chart Trends: Trends in New York are mixed. Support is at 243.00, 239.00, and 232.00 September, and resistance is at 258.00, 264.00 and 270.00 September. Trends in London are mixed to up with no objectives. Support is at 4390, 4300, and 4220 July, with resistance at 4680, 4730, and 4790 September.
• SUGAR
General Comments: New York and London closed lower as harvest progress in Brazil was the important fundamental but as world supplies remain rather tight. Harvest yields of Sugarcane in Brazil are improving, and UNICA said that Sugar production was up more than 20% from last year at 3.25 million tons. The market had expected this increase. There are still ideas that the Brazil harvest can be strong for the next few weeks amid dry harvest weather. Harvest weather is called good in center-south Brazil.
Overnight News:
Chart Trends: Trends in New York are up with objectives of 2070 and 2170 October. Support is at 1920, 1880, and 1860 October and resistance is at 2050, 2070, and 2090 October. Trends in London are up with objectives of 575.00 and 600.00 October. Support is at 538.00, 530.00, and 526.00 October, with resistance at 560.00, 572.00, and 581.00 October.
• COCOA
General Comments: New York and London both closed a little higher in consolidation trading but chart trends are still down. The European Cocoa grind was 357,502 tons, up 4.1% from last year. The data was supportive to prices. Production concerns in West Africa as well as demand from nontraditional sources along with traditional buyers keep supporting futures, but this support is running its course and the market is searching for a new bullish fundamental. Production in West Africa could be reduced this year due to the extreme weather which included Harmattan conditions. The availability of Cocoa from West Africa remains very restricted.
Overnight News: ICE NY said that 0 notices were posted for delivery against July futures and that total deliveries for the month are now 1,571 contracts.
Chart Trends: Trends in New York are mixed to up with no objectives. Support is at 7880, 7520, and 6960 September, with resistance at 8630, 8960, and 9540 September. Trends in London are mixed to up with no objectives. Support is at 6520, 625a0, and 5920 September, with resistance at 7420, 7940, and 8300 September.
Read Full Story »»»
DiscoverGold
Commodities Daily Market Movers (% Price Change)
By: Marty Armstrong | July 12, 2024
• Top Movers
Cocoa (NYCSCE) Futures 6.43 %
Oats (CBOT) Futures 4.95 %
Oats (Minneapolis) 4.72 %
AU - Victoria Base-Load Electricity Futures 2.81 %
AU - Queensland Base-Load Electricity Futures 2.8 %
• Bottom Movers
Orange Juice (NYCE) Futures 4.33 %
NY Natural Gas Futures 2.62 %
NY Copper Futures 2.21 %
New York Spot Copper 2.21 %
Sugar World (CSCE) Futures 1.92 %
*Close from the last completed Daily
DiscoverGold
Natural Gas Approaching Key Support Zone Starting at 2.23
By: Bruce Powers | July 11, 2024
• Natural gas fell below 2.27 support, targeting the 2.23-2.17 price zone. A bearish weekly close looms.
Natural gas fell on Thursday and triggered a continuation of the bearish retracement. It dropped below the previous retracement low of 2.27 and looks to be heading towards the next lower support zone that starts around 2.23. Resistance at 2.17 from the early-February high marks the lower edge of the price zone. However, that range is an estimate and there is no assurance that it will stop the descent. Nonetheless, there is reason to believe that it might.

Targets 2.23 to 2.17 Support Zone
Within the 2.27 to 2.17 price zone are two additional indications on the daily chart that support the identification of that price zone. First, there is a descending ABCD pattern where the CD leg of the pattern has been extended by 127.2% of the initial AB decline. It reaches the target at 2.20. In addition, there is a 61.8% Fibonacci retracement that completes at 2.18.
Since today is Thursday, if natural gas stays around current price levels or lower heading into the weekend, it is set to end with another bearish weekly candlestick pattern and a close near the lows of the week. Regardless, this week will complete the fourth sequential week of lower weekly highs and lower weekly lows. As of the 2.26 low today, the price of natural gas has declined by 28.4% from the June swing high of 3.16 (A).
Challenging Below 200-Day MA
If support is seen in the price zone that leads to a bullish reversal, rallies will first need to contend with possible resistance around the 200-Day MA, currently at 2.46. It represented resistance earlier this week and may do so again. Given how persistent the current correction has been to date, there is a chance for a bounce up into resistance, followed by a turn back down.
Either way, if the 2.17 price area is decisively broken to the downside, the initial bullish breakout from the top of a bottom symmetrical triangle pattern could eventually be challenged as support. That price level is at 2.00 and highlighted on the chart with a red box.
The current retracement followed a failed attempt to break out above the downtrend line in early-June. That created a lower swing high and kept the downtrend price structure in place. Failed moves can lead to fast moves and that looks to be what we’ve been seeing in natural gas since the June high.
Read Full Story »»»
DiscoverGold
CBOT Grains Ride International Cash Market. The Corn & Ethanol Report
By: Daniel Flynn | July 11, 2024
We kickoff the day with Core Inflation Rate MoM & YoY, Inflation Rate MoM & YoY, CPI, CPI s.a., Initial Jobless Claims, and Jobless Claims 4-Week Average at 7:30 A.M., EIA Natural Gas Storage at 9:30 A.M., Fed Bostic Speech at 10:15 A.M., 4-Week & 8-Week Bill Auction at 10:30 A.M., 15-Year & 30-Year Mortgage Rate at 11:00 A.M., 30-Year Bond Auction and Fed Musalem Speech at 12:00 P.M., Monthly Budget Statement at 1:00 P.M., and Fed Balance Sheet at 3:30 P.M.,
The Mortgage Bankers Association’s weekly survey of home lenders showed that the average contract interest rate for 30-Year mortgages eased 0.03% from the previous week but remained at 7%. In the first 27 weeks of 2024, the average rate has been at or above 7% in 15-Weeks. It is worth noting that this week’s interest rate was below a year ago for the first time since September 2021. However, the still elevated mortgage rates have kept mortgage demand surpressed, and the Mortgage Application Index remains near the lowest levels since 1995.
CBOT Attempts Recovery on US, International Cash Market Strength: Global corn markets ended steady for a second day. Central US weather stays broadly favorable nearby, through the duration of dryness needs close monitoring, and uncertainty over the location of heat. But it’s strength in the international cash market makes $4.00 CBOT Dec corn look cheap until actual yield data is available. Talking with Scott Shellady, “The Cow Guy,” he believes we could see a short covering rally of 50 cents or so, if the funds start to cover shorts or puke all of them out, and he said, $4.50 corn is still too cheap. The market is trading a yield of 180+. It remains that a yield below 177 leans positive of price. Risk is minimal. The Argentine harvest is expected to reach 68-70% complete. The lack of fob premiums weakness in June/early July aligns with the collapse in second crop yields. The US market is priced to boost export demand over the long run. Tomorrow’s USDA Crop Production, YSDA Supply/Demand, and WASDE data will place 24/25 US end stocks on Friday at 2.3-2.4 Bil Bu amid larger harvested area. This is known, and the key is how the market reacts. Short covering will be used to move along cash sales. The funds are at record or near record net short positions of 10 of the principal ag markets. Will be trading July WASDE and weather while Mother Nature keeps her cards close to the vest. Again, CBOT futures are higher in a recovery effort with key government crop reports tomorrow and Brazil’s CONAB update out this morning. And possibly the most important report will be the CFTC Commitment of Traders report due out Friday afternoon. Traders are betting that managed money is holding a record short corn position in the wake of recent price decline. Also, a key inflation data point will be released this morning by the US Labor Dept. with the June guage of prices (excluding food & energy) rising by just .2% the same as May. (Do I smell a revision in the future?) The moderate rise in inflation would allow the US Central Bank a runway to start cutting interest rates as early as September. There are strong indications that the US labor market is back in balance, while lower energy prices are allowing for price stability in consumer goods. The debt markets are betting that the US Central Bank will reduce its Fed Funds rate by 50 basis points by the end of the year. The fall in lending rates will allow for a decline in the value of the US dollar, which will be supportive to world raw material demand.
Read Full Story »»»
DiscoverGold
Arabica Coffee (the good stuff) jumps to highest price in 2.5 years
By: Barchart | July 11, 2024
• JUST IN: Arabica Coffee (the good stuff) jumps to highest price in 2.5 years.

Read Full Story »»»
DiscoverGold
Natural Gas Remains Bearish as Resistance Holds Strong
By: Bruce Powers | July 10, 2024
• Downturn following test of 200-Day MA resistance is short-term bearish behavior and improves chance of testing lower support zone.
Natural gas followed through to the downside on Wednesday after Tuesday’s rally encountered resistance around the 200-Day MA. Yesterday’s low of 2.33 was exceeded to the downside before natural gas found support at the day’s low of 2.29, which led to a bounce.
Today’s price action did little to comfort bulls as a downtrend is well in place and today’s decline following yesterday’s test of potentially significant resistance is bearish behavior. Until there is a clear change in character natural gas remains bearish and a test of support at the next lower target zone continues to be the next likely scenario to unfold.

Confluence of Indicators Point to 2.23 and Lower
There is a confluence of price levels that appear from around 2.23 to 2.17. That is not too much lower than the current retracement low of 2.27. The range provides a potential support area given the confluence of indicators pointing to the price range. Two key levels include the 61.8% Fibonacci retracement at 2.18 and the completion of a falling ABCD pattern at 2.20. Each method is looking to identify a harmonic price level associated with prior swings highs and lows. The target from the ABCD pattern is an extended target using the 127.2% Fibonacci ratio.
Bullish Sentiment Begins to Dominate Above 2.46
An alternative to the bearish scenario unfolds with a rally above Tuesday’s high of 2.45, along with the 200-Day MA at 2.46. An earlier initial indication of strength would be seen in a rally above today’s high of 2.385. However, an advance above 2.385 puts the price of natural gas heading back up into potential resistance around the 200-Day line. And resistance may be seen again.
Once the 200-Day line is exceeded, a potentially significant near-term barrier to a continuation higher is resolved. It would set the stage for a rally up to the 50-Day MA at 2.55 and the 38.2% Fibonacci retracement at 2.61. A little higher will be a price range from around 2.67 to 2.71. That range consists of the 20-Day MA and 50% retracement, respectively.
20-Week MA Further Confirms Support Zone
Regarding the next lower potential support zone, in addition to four price levels that identify the price range there is also confirmation of the range on the higher time frame weekly chart. The 20-Week MA is present on the weekly chart (not shown) at 2.19. Also, the 50-Week MA is a close match with potential resistance around the 200-Day line. It shows potential resistance at 2.49.
Read Full Story »»»
DiscoverGold
Orange Juice just doesn't give up, making another run
By: Barchart | July 10, 2024
• Orange Juice just doesn't give up, making another run.

Read Full Story »»»
DiscoverGold
Agriculture Master Report
By: Bill Moore | July 9, 2024
SEPT CORN
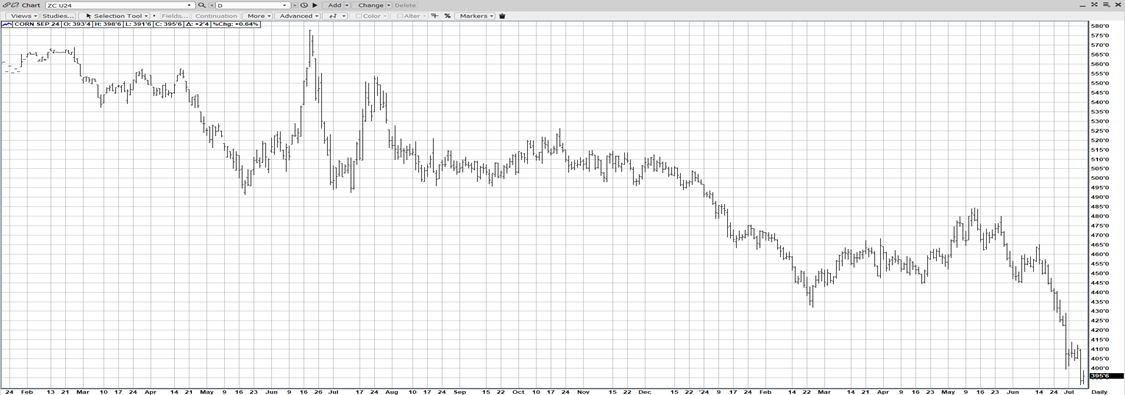
Hurricane Beryl delivered quite a bit of moisture to the Eastern Corn Belt resulting in a violent downswing yesterday that took out the lows established by the June 28th Acres/Qtly Stocks Report! The mkt is already dialing in a 182-183 BPA yield – well over the 2023 record of 177! That maybe premature given it’s only early July! And it’s all dependent on the yields as the acres are forecast to be 3MA under 2023! The mkt may well correct up this week – in anticipation of Friday’s July WASDE Report! Foreign production is waning – particularly in the Black Sea! And the Western Corn Belt is expected to be hot & dry the 2nd half of July! As well exports have been impressive with over 1mmt Mon & a flash sale of corn to an unknown destination! Finally, a record short open interest has developed which could fuel any fundamental rallies ahead!
SEPT BEANS
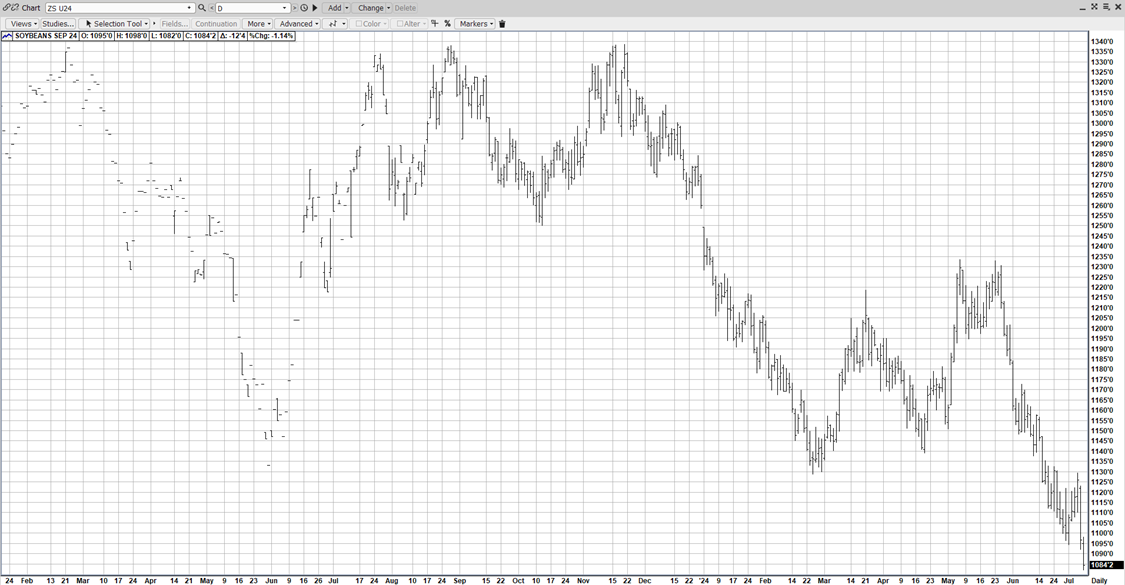
Much like Sept Corn, the Hurricane brought needed moisture to the Eastern States causing a collapse in prices yesterday – which is being furthered today! Gd-Ex crop conditions increased 1% to 68%! Tight farmer holding of cash beans supports – as well as the export potential created by the recent dramatic price drop! Beans aren’t made until August so the jury is still out on the yields! But it feels like early harvest lows are being carved out now! Global stocks continue to decrease due to dryness, heat & frost in some major crop areas! Hot & dry is forecast for the end of July in the WCB!
SEPT WHT
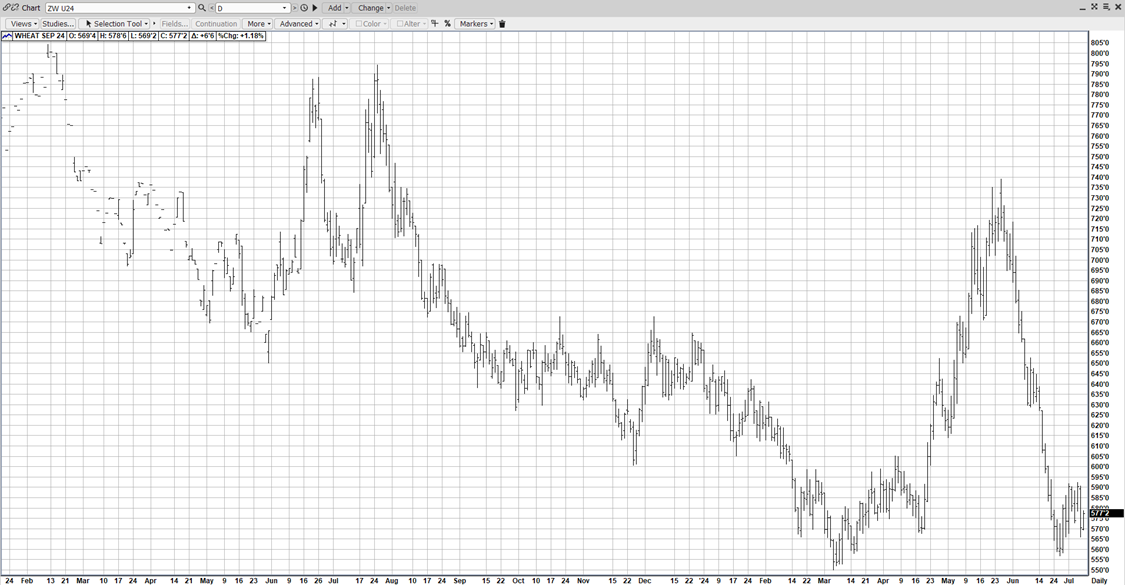
A quick purview of all grain charts shows Sept Wht to be the strongest as it resisted the massive down in corn & beans on Mon & is recovering today! The harvest pressure is easing off the mkt with harvest 63% done & stocks are on the low side as Russia is being less aggressive in its export program! Cumulative export inspections are 23% over last year & the historically low prices promise more of the same!
AUG CAT
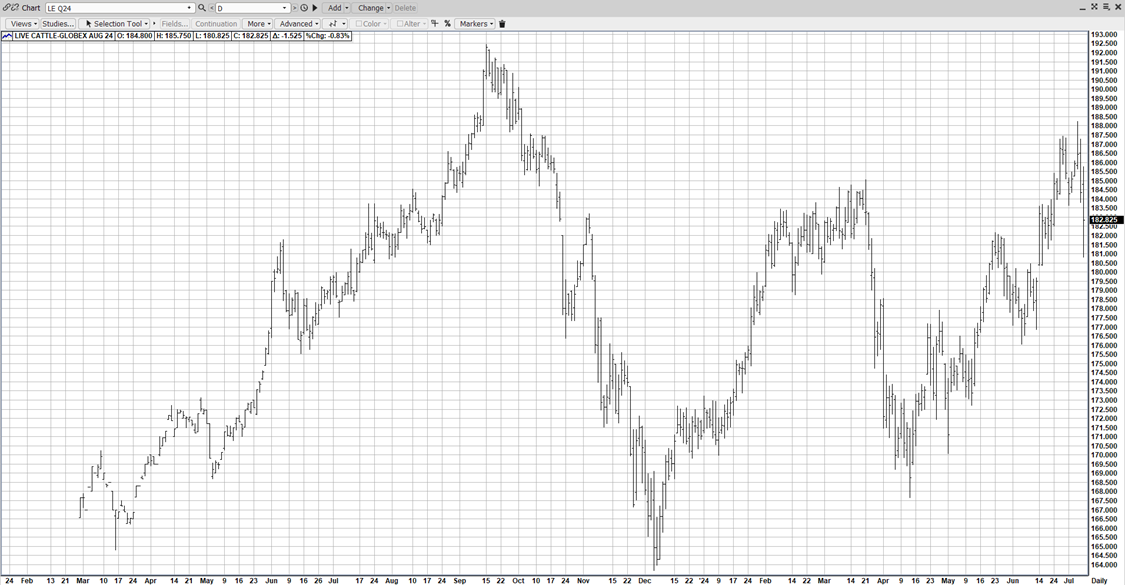
That was quick! All of a sudden, Aug Cat has corrected $7.00 (188-181)! Definitely, a mkt correction & maybe even a mkt top! Even with boxed beef trading the highest since 6-26-23! The key demand periods – Memorial Day W/E & the 4th of July are in the review mirror & the glaring gap between pork & beef prices in the supermarket is not lost on consumers! We’ll see if the mkt stabilizes late week as cash cattle is relatively strong even though short-term technicals have turned lower!
AUG HOGS
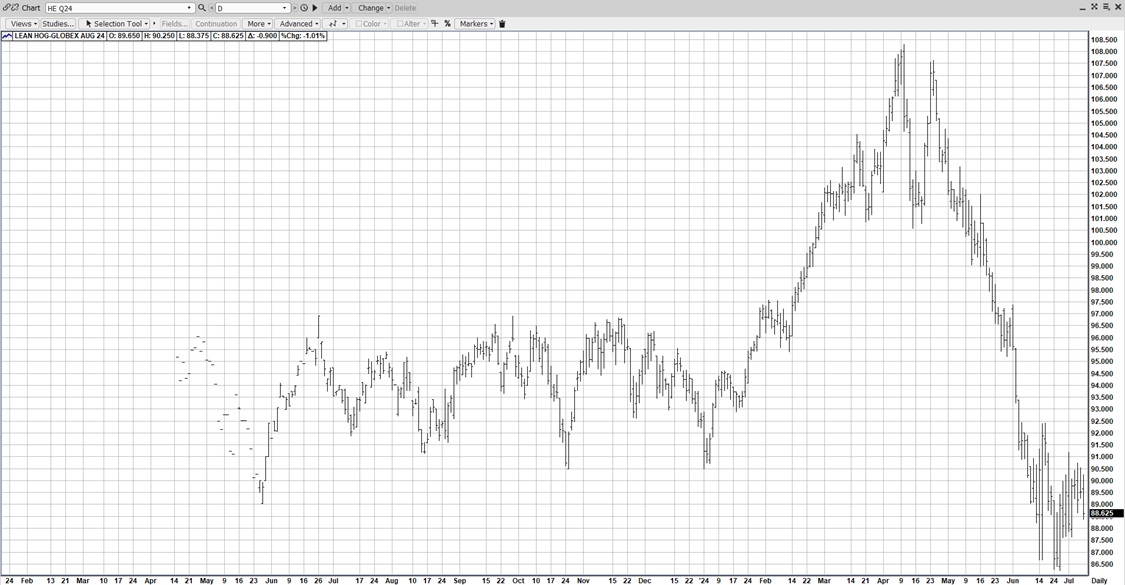
An interesting dichotomy exists in the hogs – the near-term Aug hogs are congesting in a $3-4 range after dropping $20 since late April while the Fall contract Oct hogs are plummeting – making new contract lows the last 3 consecutive days! The recent Pig Crop Report indicated bigger #’s down the road & that’s coming to fruition while the front month is holding a tight sideways pattern due to OK demand from the huge disparity between pork & beef in the grocery store!
Read Full Story »»»
DiscoverGold
Bloomberg Agriculture Index breaking down
By: Nautilus Research | July 10, 2024
• #wheat #corn #soybeans Bloomberg AG Index breaking down.

Read Full Story »»»
DiscoverGold
Grains Report: Wheat, Rice, Corn and Oats, Soybeans, Canola and Palm Oil
By: Jack Scoville | July 9, 2024
• WHEAT
General Comments: Wheat was lower in all three markets yesterday as Hurricane Beryl is likely to miss much of yhr Gtray Plains with moisture and instead move into the southern and eastern Midwest. M Reports of hot and dry weather in eastern Europe and Russia and too wet weather in France are still heard and the weather there affecting world production estimates. Russia is likely to expand the war and has reportedly started to make some threats against the US and NATO countries. The US harvest is expanding through Kansas and is now more than 50% complete for the country as a whole and adverse world growing conditions are still around. There were more reports of hot temperatures coming this week to Russian growing areas. It has also been very dry there. Eastern Europe is also hot and dry. Western Europe has seen too much rain.
Overnight News: The southern Great Plains should get mostly dry conditions. Temperatures should be above normal. Northern areas should see mostly dry conditions. Temperatures will average above normal. The Canadian Prairies should see mostly dry conditions. Temperatures should average above normal.
Chart Analysis: Trends in Chicago are mixed. Support is at 566, 557, and 550 September, with resistance at 605, 614, and 631 September. Trends in Kansas City are mixed. Support is at 573, 568, and 565 September, with resistance at 601, 614, and 636 September. Trends in Minneapolis are down with no objectives. Support is at 602, 596, and 590 September, and resistance is at 646, 649, and 669 September.
• RICE
General Comments: Rice closed sharply higher as the market heard that Hurricane Beryl has hit growing areas with the damaging parts of the storm in and around the Houston area. The US weather has been an issue much of the growing season with too much rain early in the year and now a hurricane to drop big amounts of rain on cops again along with some high winds. Inland Texas areas could also see too much rain. Supply tightness is expected to give way to increased production this year and greatly increased supplies this Fall.
Overnight News:
Chart Analysis Trends are down with no objectives. Support is at 1453 1451, and 1441 September and resistance is at 1498, 1611, and 1518 September
• CORN AND OATS
General Comments: Corn and Oats closed lower in response to forecasts calling for hotter and drier weather for the Midwest later this week. Hurricane Beryl is likely to bring some much needed precipitation to the southern and eastern Midwest while northern and western areas stay mostly dry. It should turn hot after that for most areas. Weakness was based on higher than expected planted area estimates released by USDA along with sharply higher than expected quarterly stocks data and strength coming from rallies in Soybeans and Wheat. The US weather features moderate temperatures and increasing chances for rains. Northern areas such as southern Minnesota that have had way too much rain and flooding is still reported.
Overnight News:
Chart Analysis: Trends in Corn are down with no objectives. Support is at 388, 382, and 376 September, and resistance is at 429, 432, and 443 September. Trends in Oats are mixed. Support is at 302, 296, and 290 September, and resistance is at 322, 327, and 338 September.
• SOYBEANS
General Comments: Soybeans and the products closed lower. Hurricane Beryl is expected to bring beneficial precipitation to areas of the southern and eastern Midwest where conditions have been too dry until now. Northern and western areas should turn drier which is also beneficial for crops.. Reports indicate that China remains an active buyer of Soybeans in Brazil but has cut back and increased purchases from the US on demand due to the tax issues in Brazil and on Brazil logistical concerns. Domestic demand has been strong in the US but has suffered as crushers were crushing for oil. Oil demand has suffered as cheaper alternatives for feedstocks hit the biofuels market.
Overnight News:
Chart Analysis: Trends in Soybeans are mixed to down with objectives of 1117 and 1094 August. Support is at 1128, 1116, and 1104 August, and resistance is at 1180, 1185, and 1199 August. Trends in Soybean Meal are mixed. Support is at 344.00, 343.00, and 340.00 August, and resistance is at 359.00, 362.00, and 365.00 August. Trends in Soybean Oil are up with objectives of 4660 and 4890 August. Support is at 4510, 4440, and 4390 August, with resistance at 5930, 5990, and 6050 August.
• CANOLA AND PALM OIL
General Comments: Palm Oil was higher last week and trends are up again. Export demand has been very strong in recent private reports but has been weaker in recent days. There is talk of increased supplies available to the market, but the trends are up on the daily and weekly charts. Canola was sharply higher last week along with US prices. The daily charts show that Canola trends are up.
Overnight News:
Chart Analysis: Trends in Canola are up with objectives of 664.00 and 708.00 November. Support is at 618.00, 599.00, and 591.00 November, with resistance at 664.00, 670.00, and 680.00 November. Trends in Palm Oil are mixed to down with objectives of 3770 and 3630 September. Support is at 4020, 3990, and 3960 September, with resistance at 4170, 4220, and 4280 September.
Read Full Story »»»
DiscoverGold
Softs Report: Cotton, OJ, Coffee, Sugar, Cocoa
By: Jack Scoville | July 9, 2024
• COTTON
General Comments: Cotton was near unchanged yesterday as Hurricane Beryl moved into the Mexican and Texan coast and brought beneficial rains to important growing areas of Texas. USDA showed a decrease in production conditions for the crops in its reports this week that were the result of some extreme weather seen recently in Texas and the Southeast. The Delta should have the best looking crops right now. Demand has been weaker so far this year but there are hopes for improved demand with the lower prices. Chinese consumer demand has held together well, and Chinese demand for Cotton has started to increase.
Overnight News: ICE said that 0 notices were posted for delivery against July futures and that total deliveries for the month are now 132 contracts.
Chart Trends: Trends in Cotton are mixed. Support is at 70.00, 68.80, and 67.60 December, with resistance of 75.80, 77.70 and 79.40 December.
• FCOJ
General Comments: FCOJ closed lower as Hurricane Beryl missed Florida and there are no other storms in sight for the state. The market remains well supported in the longer term based on forecasts for tight supplies and very hot weather in Florida. The reduced production appears to be at the expense of the greening disease. There are no weather concerns to speak of for Florida or for Brazil right now. The weather has improved in Brazil with some moderation in temperatures and increased rainfall amid reports of short supplies in Florida and Brazil are around but will start to disappear as the weather improves and the new crop gets harvested.
Overnight News: ICE said that 0 notices were posted for delivery against July futures and that total deliveries for the month are now 144 contracts.
Chart Trends: Trends in FCOJ are mixed. Support is at 421.00, 410.00, and 403.00 September, with resistance at 441.00, 457.00, and 459.00 September.
• COFFEE
General Comments: New York and London closed higher with London the leader as more reports of short supplies that could be made worse by ideas of reduced offers of Robusta are still in the market. The weather forecasters now say that conditions are good in Vietnam, but damage was done to crops earlier in the growing season. A little rain has been reported in Vietnam recently to help crops there. There were also reports of poor Robusta yields in Brazil during the harvest due to small bean sizes.
Overnight News: The ICO daily average price is now 237.05 ct/lb. ICE NY said that 0 contracts were posted for delivery against July contracts and that total deliveries for the month are now 661 contracts.
Chart Trends: Trends in New York are mixed. Support is at 217.00, 212.00, and 203.00 September, and resistance is at 236.00, 238.00 and 240.00 September. Trends in London are mixed to up with no objectives. Support is at 3960, 3820, and 3740 July, with resistance at 4390, 4450, and 4510 September.
• SUGAR
General Comments: New York and London closed lower as harvest progress in Brazil was the important fundamental but as world supplies remain rather tight. Harvest yields of Sugarcane in Brazil have been disappointing so far. Trends are mixed to up on the daily and weekly charts. There are still ideas that the Brazil harvest can be strong for the next few weeks amid dry harvest weather. Harvest weather is called good in center-south Brazil.
Overnight News:
Chart Trends: Trends in New York are up with objectives of 2070 and 2170 October. Support is at 1970, 1920, and 1880 October and resistance is at 2090, 2140, and 2170 October. Trends in London are up with objectives of 575.00 and 600.00 October. Support is at 550.00, 550.00, and 528.00 October, with resistance at 581.00, 590.00, and 599.00 October.
• COCOA
General Comments: New York and London both closed lower with most of the weakness in nearby months due to speculative selling and chart trends are down. Production concerns in West Africa as well as demand from nontraditional sources along with traditional buyers keep supporting futures, but this support is running its course and the market is searching for a new bullish fundamental. Production in West Africa could be reduced this year due to the extreme weather which included Harmattan conditions. The availability of Cocoa from West Africa remains very restricted.
Overnight News: ICE NY said that 14 notices were posted for delivery against July futures and that total deliveries for the month are now 1,571 contracts.
Chart Trends: Trends in New York are down with no objectives. Support is at 6960, 6420, and 6w000 September, with resistance at 8000, 8130, and 8670 September. Trends in London are mixed. Support is at 5790, 5350, and 4920 September, with resistance at 6810, 7420, and 7940 September.
Read Full Story »»»
DiscoverGold
The Corn & Ethanol Report. Excessive Heat & No Electricity After Beryl
By: Daniel Flynn | July 9, 2024
We kickoff the day with NFIB Business Optimism Index at 5:00 A.M., Redbook YoY at 7:55 A.M., Fed Barr Speech at 8:15 A.M., Fed Chair Powell Testimony at 9:00 A.M., NY Fed Treasury Purchases 10-22.5 yrs. at 9:30 A.M., 42-Day Bill Auction and 52-Week Bill Auction at 10:30 A.M., 3-Year Note Auction at 12:00 P.M., Fed Bowman Speech at 12:30 P.M., API Energy Stocks, Used Car Prices MoM & YoY, and Treasury Secretary Yellen Testimony at 3:30 P.M.
The delayed Commitment of Traders report showed that funds were large sellers in ag commodity market in the week ending July 2nd . Funds sold 59,000 contracts of corn, 14,000 contracts in soybean meal, and over 11,000 contracts in soybeans. Across all 3 wheat exchanges funds sold 18,000 contracts. Funds bought 47,000 contracts in soybean oil, 7,500 contracts in live cattle, and 1,400 contracts in feeders. Across the 10 principal ag markets, funds sold over 46,000 contracts and were net short nearly 547,000 contracts. Funds net short in agriculture markets is testing the record lows scored earlier this year, waiting for a new fundamental reason to exit. Looking backwards, it’s managed money positioning that moves price.
Beryl to Provide Needed Rain to E Midwest; Outlook Elsewhere Warm/Dry into July 23rd: Tropical Depression Beryl northeasterly move bodes favorably for IL, IN, OH, and KY. There’s broad agreement that rainfall of 1-3” impacts this region over the next 72 hours, and this follows the recent develop of abnormal dryness/moderate drought east of the Mississippi River. Coming rain is timely. Yet outside this narrow band a lengthy period of net drying is forecast and the GFS model project no major changes over the next week, but late July details are important. Operational models agree that dryness and warming temps are most probable into July 23rd . Any additional tropical activity in July is projected to favor the east coast. The 2024 growing season is just nearing its halfway mark.
No Relief Offered to Black Sea Next 10 Days; Temps Warm Further as Mid-Summer Approaches: A stagnant pattern of heat and dryness will be ongoing in E Europe, Ukraine, and much of Russia into July 17th . 11-155 day guidance lacks any hint of a pattern change, and so adversity is expected to cover nearly all of corns pollination there. The EU model’s latest 10-day precipitation forecast is not promising. Temps expected to reach into the upper 80’s/upper 90’s this week and will consistently be in the 90’s throughout the 6-10 day period. Ukraine is most concerning, but Russia has become a modest exporter of corn to neighboring destinations in recent years. Extreme heat favors Romania after July 15th . The market’s fixation on Central US weather in July must be expected, but numerous supply issues are present elsewhere across the world. CBOT open interest surged on Monday’s decline with corn up 18,706 contracts, Chicago wheat up 4,477 contracts while soybeans rose 2,648 contracts. New short positions were entered across the CBOT grain complex, except that soybean oil open interest fell 4,218 contracts on short covering. We are closing in on the fundamental summit as US corn and soybean good-to-excellent ratings rose 1%. 24% of the US corn crop is pollinating with 34% of the soybean crop in bloom.
Read Full Story »»»
DiscoverGold
To Recovery Mode. The Energy Report
By: Phil Flynn | July 9, 2024
The Port of Galveston and the Port of Houston are in recovery mode as well as refiners where the biggest damage from hurricane Beryl seems to be the lack of power. There are 2.3 million still without power in Texas post Hurricane Beryl and that is one of the reasons the recovery from the storm is taking time.
Corpus Christi, the largest crude oil export port in the US, is in recovery mode. They reported that, “In response to the impacts of Hurricane Beryl, the Port of Corpus Christi Authority has now fully transitioned to Post-Storm Recovery in accordance with the 2024 Hurricane Readiness Plan. Port personnel are continuing to assess impacts; however no significant impacts have been reported. Port facilities, including the Emergency Operations Center (EOC), Security Command Center and Harbormaster’s Office have maintained continuous uninterrupted operations. Port offices will open as scheduled tomorrow, July 9, for normal operations.
Power outages shut down Marathons Galveston Bay refinery yesterday as well as tripping units at Valero’s Texas refinery. When the power comes back online they should be able to resume operations and we will be watching for updates. Hours ago, the Port of Galveston reported that Galveston Harbor and port operations remain closed as the port and federal agencies assess the impact of Beryl. The U.S. Army Corps of Engineers expects to begin surveying federal portions of waterways on Tuesday. That port is a major exporter of liquefied natural gas and oil but at the same time it is also a spot where many cruise ships start their voyage.
The Port of Houston said that, “after conducting preliminary assessments of our facilities, power, and systems, all Port Houston terminals will remain closed tomorrow (Tuesday, July 9, 2024). They will continue to assess and repair damage this afternoon and tomorrow and will send an update by 4 PM CT tomorrow if there are any further disruptions to operations for Wednesday. The key thing is whether the flooding has impacted shore production and how quickly they can get the power back on.
The futures market already is looking ahead past the storm. It will now start to focus on supply and demand, and we will get a snapshot of that today with the American Petroleum Institute (API) report that comes out at 3:30 pm central standard time. That should be the biggest market mover that we could be impacted by and any comments from Fed Chairman Jerome Powell who speaks today in front of a Senate committee. Oil traders will be listening very carefully to get a sense on whether the recent signs that The US jobs market is starting in the private sector is starting to weaken and signs that inflation has slowed impact the value of the dollar and the price of oil.
The one thing that we do know is that tonight’s API report and tomorrow’s Energy Information Administration (EIA) Petroleum Status Report will be the last reports for a while that won’t be impacted by Hurricane Beryl. This is going to give us our best snapshot of current supply versus demand and give us an idea about expectations of supply and demand going forward.
And if air travel is any indication, it looks like we are going to really be taking off. Taking to the air! The 4th of July holiday saw over 3 million people go through TSA checkpoints breaking all-time records. And lava land there’s a one-man band that will toot its flute for you! Now the question is whether that record-breaking air travel demand will translate into gasoline demand. Gasoline demand while growing has been a bit disappointing. Perhaps the 4th of July travel weekend may rewrite the weak gasoline narrative that is held back the market.
From a technical perspective, if you look at the crude oil daily chart, it could be on the precipice of a major breakout to the upside. While we haven’t broken out yet, the momentum and technical setup could be wildly bullish, and a breakout would confirm that the market is going to see a supply deficit later in the year. We think the market is flashing warning signs and while we may get a pullback from resistance, the overall fundamental suggests that you really need to be hedged because the market has a lot of room to move if we get an upside breakout.
Meanwhile gas demand in the US has still been questionable but in Brazil it seems to be rising. Bloomberg reported that Brazil’s state-controlled oil company is raising domestic gasoline prices for the first time in 11 months as crude prices have climbed and the value of the nation’s currency. Petroleo Brasileiro SA will increase gasoline prices for distributors by 7.1%, to 3.01 reais ($0.55) per liter, according to a statement Monday. The company also raised prices for liquefied petroleum gas used for cooking and heating. It left diesel prices unchanged.
China has been the beneficiary of imports of cheap Russian crude oil as world governments have to admit that the Russian price cap fantasy turned out to be a total failure. Saudi Arabia has lost some market share to Russia on exports to China but are trying to get it back. Reuters is reporting that Saudi crude oil exports to China will rebound in August to at least 44 million barrels after deep price cuts by state energy firm Saudi Aramco. August exports to China will rise for the first time in four months, from about 36 million barrels in July, the sources said. The rebound will help the biggest oil exporter regain its share in the largest import market.
Perhaps the biggest surprise in the aftermath of the hurricane with the fact that natural gas prices held up well. It’s amazing when you think that LNG exports were delayed, and production could have been impacted and massive power outages that would decrease demand so when the market holds up that well even in the face of those challenges, it makes you feel like the bottom is in. It’s probably a good time to put on some bullish strategies for natural gas because the market seems to know something.
Read Full Story »»»
DiscoverGold
Commodities Daily Market Movers (% Price Change)
By: Marty Armstrong | July 9, 2024
• Top Movers
AU - Queensland Base-Load Electricity Futures 5.7 %
AU - Victoria Base-Load Electricity Futures 3.8 %
NSW Baseload Electricity Continuous 3.51 %
Cheese 3.16 %
Coffee (NYCSCE) Futures 2.38 %
• Bottom Movers
Eggs 4.2 %
Corn (CBOT) Futures 3.87 %
Wheat CBT Futures 3.39 %
Soybean Meal CBT Futures 3.34 %
NY Platinum Futures 3.11 %
*Close from the last completed Daily
DiscoverGold
Corn plummets to lowest price since November 2020
By: Barchart | July 8, 2024
• Corn plummets to lowest price since November 2020.

Read Full Story »»»
DiscoverGold
The Corn & Ethanol Report
By: Daniel Flynn | July 8, 2024
We kickoff the day with Consumer Inflation Expectations and Export Inspections at 10:00 A.M., 3-Month & 6-Month Bill Auction at 10:30 A.M., Consumer Credit Change and Used Car Sales MoM & YoY at 2:00 P.M., and Crop Progress at 3:00 P.M.
The July jobs report offered nonfarm payrolls coming in 206,000 jobs versus trade expectations of 190,000. Bit once again, the previous 2 months were revised lower. The May nonfarm payroll figure was slashed by 54,000 jobs (20%) to 218,000, and the April figure was cut by 57,000 jobs (35%) to 108,000 jobs. The nonfarm payroll figures continue to lose credibility as the 2nd & 3rd releases are always a downward revisions. Further adding skepticism are the results from the Household survey. The Establishment Survey showed that since December 2022, nonfarm payrolls have risen by 4.35 Mil jobs were added. Moreover, the June Unemployment rate rose to a 32-month high of 4.1%. The US economy is slowing and US interest rate cuts are in the offing with the 1st reduction potentially possible in September.
Monitoring Hurricane Beryl this weekend, the category 1 made landfall early this morning. The cone of the storm has changed as expected with tropical weather, and my most current update has the EU forecast model showing a cone with rains as northwest as Chicago proper, while the GFS shows it moving in a more southern direction, but both models concur that the Eastern Corn Belt should receive much needed precipitation. Farmers are hoping for aa quick moving storm with good saturation without too much rain that could create other issues. We will have a better handle of the situation by Wednesday.
CBOT Corn Rallies; South American Premiums Firm; Ukrainian Drought Imminent: Corn futures rallied Friday as model guidance remains consistent in advertising prolonged dryness and the return of heat to the N Plains and Midwest in mid-July. Additionally, South American fob premiums continue to rally. Drought development in Ukraine will be swift. Ag Resources (ARC) maintains that non-US exporter production in calendar year 2024 will be sizable, which underpins Dec at $405-415. Long term export demand is building and will be robust. Argentine second crop yields have failed to improve. Yield last week was 5.48 MT/HA (87 BPA), which implies final production of 45.6 MMT’s assuming no change in yields in the remaining 37% of unharvested corn crop. Recall USDA pegs Argentine corn production at 53 MMT’s. The point that South American basis is rising during the throes of harvest is noteworthy.
ARC analyzes Dec CBOT corn is fairly valued between $4.10-450, but Mother Nature that dictates price discovery into mid-August. The last half of July weather forecasts will be watched closely over the coming week and weekend. US corn crop conditions should rise on today’s Crop Progress and the USDA out with the July WASDE report on Friday. The corn price risk is turning upwards. Beef and Pork demand are struggling, with weak numbers, in this long 4th of July weekend, it must be the economy and jobs number. Getting back to corn, weather forecast aren’t providing much in the way of hints of change that could disrupt corn’s crucial pollination window, which is well underway.
The CFTC will release their Commitment of Traders report this afternoon due to last weeks 4th of July holiday. The report is expected to reflect managed money added a considerable net short to wheat, corn, and soybean position with corn nearing a record. Historically low prices and the structural make up of the market makes it difficult to sustain a CBOT break until more is known about 2023 US corn/soybean/sorghum yields.
Read Full Story »»»
DiscoverGold
All the grains... especially rice hitting new lows in the monthly charts.. how can this be when rice feeds the world? Well coordinated manipulation comes to mind.
Link to all Monthly charts:
https://finviz.com/futures_charts.ashx?p=m
|
Followers
|
89
|
Posters
|
|
|
Posts (Today)
|
1
|
Posts (Total)
|
9010
|
|
Created
|
05/01/07
|
Type
|
Free
|
| Moderators DiscoverGold Pro-Life | |||
- The Commodity Bull is Running... Inflation is Running... Harder Living (i.e. FOOD, CLOTHING, SHELTER) is Dead Ahead... -
- Commodity Futures Trading -
http://finviz.com/futures_performance.ashx
All Commodity Futures Charts From Finbiz.com Available Below:
Daily
Weekly
Monthly
Quarterly
6 Months
12 Months
YTD
2 Years
5 Years
Max
Beneficial Educational Resources on Futures TradingThe futures market is volatile, and it cuts both ways. Leverage that makes it profitable can also ruin reckless, undisciplined traders overnight. Most brokers have paper trading available on their platforms, so those who are new to futures should take advantage and learn with these tools before going live with real money. Mitigate risk with stop loss orders at all times, and cut losses quickly instead of adding contracts and attempting to flip your way out of a losing position. Also, use mini instruments when available, with lower margin requirements, until you have sufficient capital to buy and sell more expensive contracts. Even though the potential is there, don't try to make too many profits at once. If things aren't going well, often times quitting for the day and collecting one's thoughts is the best decision. New opportunities come along daily. Markets are open nearly 24 hours, so set a schedule and stick to it. Avoid trading while tired or distracted, and please don't listen to the advice of others. Do research on fundamentals affecting markets as well as paying attention to TA. Watch key indices, and listen to accurate, real-time news during the session to stay aware of shifting trends. Trade smart, trade safely, and have fun.
Videos on Futureshttps://www.youtube.com/playlist?list=PL9A5C5A93D243CA44 Continuous Improvement in Progress |
Commodity Futures Trading
https://www.tdameritrade.com/investment-products/futures-trading.page
| Volume | |
| Day Range: | |
| Bid Price | |
| Ask Price | |
| Last Trade Time: |


