Natural Gas Volatility Decline Setting Stage for Pennant Breakout By: Bruce Powers | April 17, 2024
• Natural gas is consolidating within a bear pennant pattern, with volatility declining as it trades inside a narrowing price range.
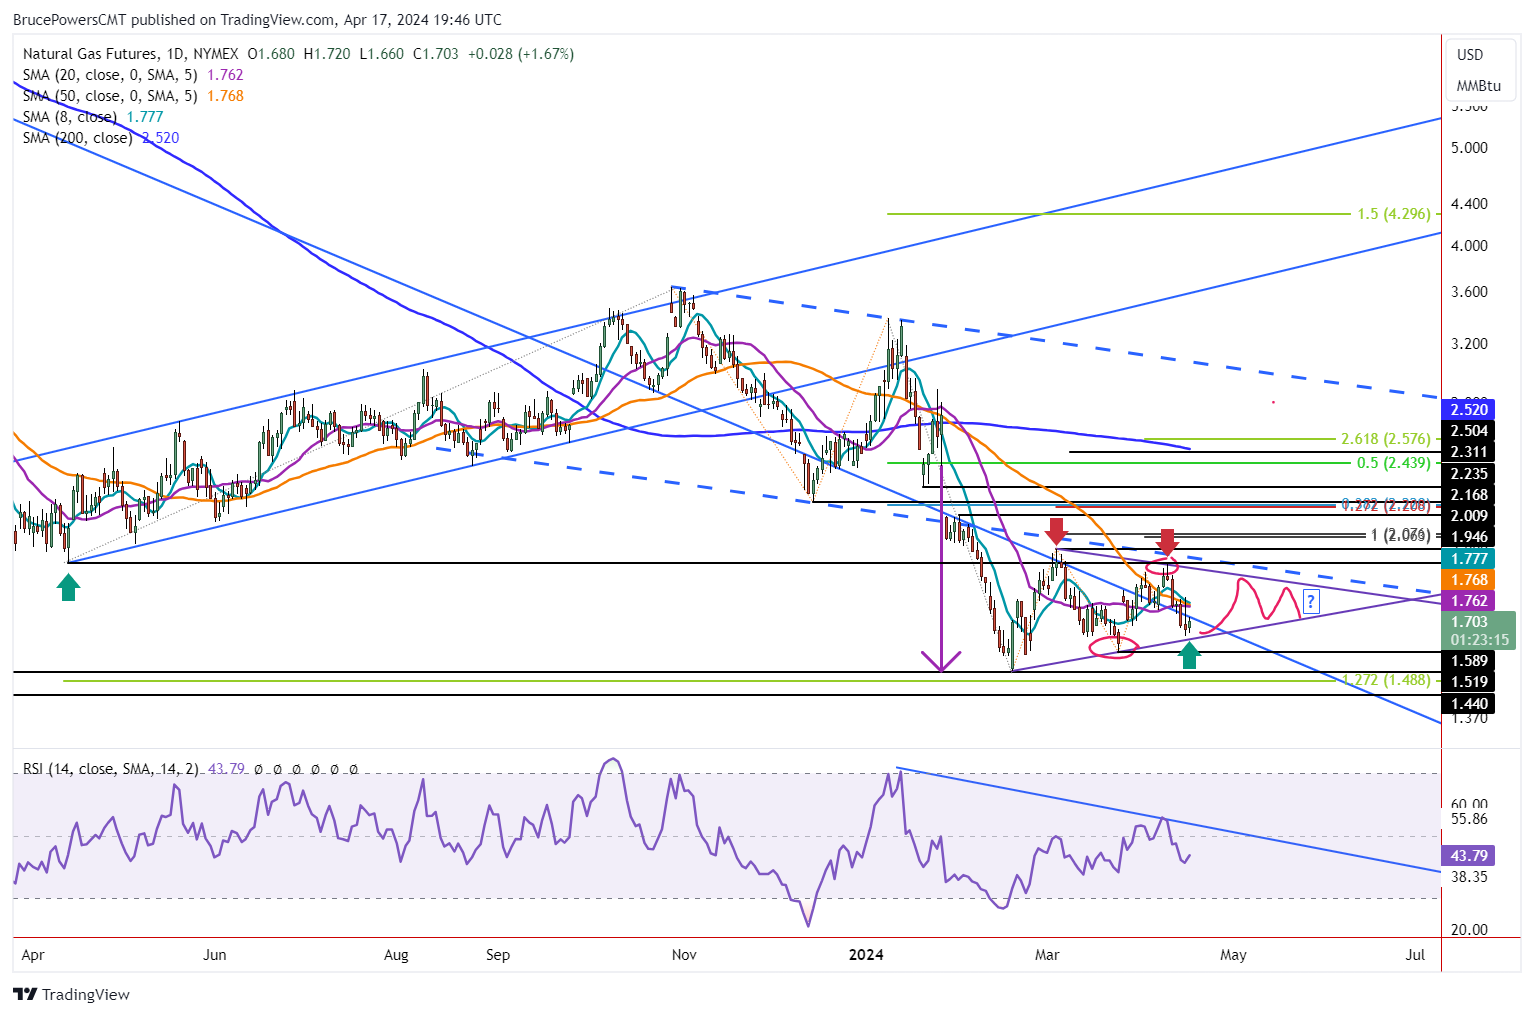
Natural gas further consolidates on Wednesday within a bear pennant pattern. It is on track to end the day as a relatively narrow inside day. Yesterday’s low of 1.65 approached a test of support at the lower trendline of a developing bear pennant consolidation pattern. This week’s decline has clarified that pattern as an attempt to hold support above the 50-Day MA and long-term trendline failed earlier this week.
Declining Volatility Likely to Continue
Volatility has been declining and it will likely continue to fall as natural gas further trades inside the small triangle pattern with a narrowing price range. The decline in volatility is also indicated by the three moving averages that have converged. The 8-Day, 20-Day, and 50-Day have come together.
What follows a period of low volatility is a clear increase in volatility. That will likely happen upon a breakout of the pennant. Natural gas remains in a clear downtrend and there was a relatively sharp decline prior to the pennant consolidation pattern. However, the downside may be limited.
29-Year Low is 1.44
In June 2020 a low of 1.44 was reached and price was quickly rejected to the upside. Natural gas traded below the prior support level of 1.52 for only one day before buyers took back control and the early stages of an advance began. That is the lowest price that natural gas has traded at in approximately 29 years. This means that 1.52 is a key low price to watch if a breakdown from the pennant occurs. Given the quick rebound off the 1.44 price level it seems unlikely that that price area will be tested again as support. Nevertheless, it is always a possibility.
Breakdown Signal
Until it is clear that Tuesday’s low of 1.65 is going to be a swing low, a breakdown is triggered on a drop below the earlier swing low at 1.59. It is confirmed on a daily close below that price level. Otherwise, support is likely to continue to be seen near the lower boundary line with trading contained within the pattern. Such a low volatility environment is likely to keep some traders on the sidelines until price breaks out.
Upside Trigger
Although the bear pennant is considered a trend continuation pattern, it is not valid until a breakout is triggered. Therefore, an eventual upside breakout remains a possibility. An upside breakout is triggered on a move above the recent swing high of 1.94. The next time that a bullish breakout could occur would be on the next rally towards the top of the pattern if it does occur.
Information posted to this board is not meant to suggest any specific action, but to point out the technical signs that can help our readers make their own specific decisions. Caveat emptor! • DiscoverGold
Register for free to join our community of investors and share your ideas. You will also get access to streaming quotes, interactive charts, trades, portfolio, live options flow and more tools.


 News
News  Market Data
  Discover