 News
News  Market Data
  Discover
Support: 888-992-3836
Copyright © 2023 InvestorsHub Inc.


Register for free to join our community of investors and share your ideas. You will also get access to streaming quotes, interactive charts, trades, portfolio, live options flow and more tools.
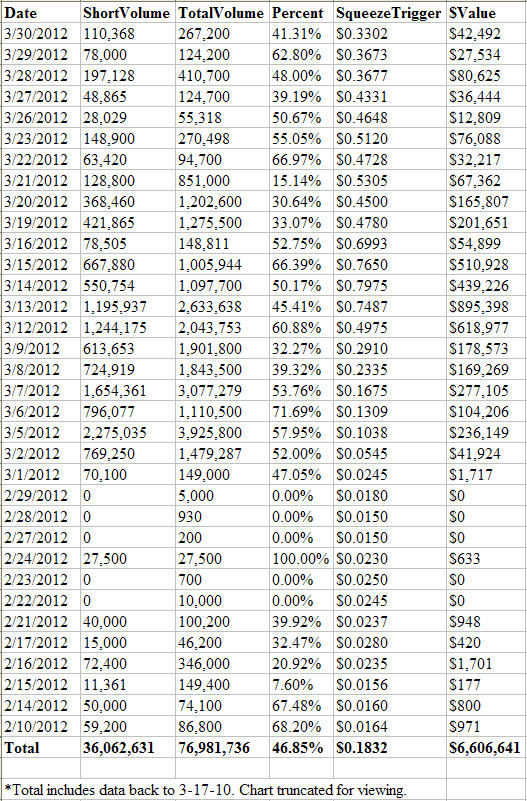
BUYINS.NET's updated SqueezeTrigger on $SLMU
The SqueezeTrigger price for all shares shorted is $0.1832
SMKY WEEKLY - Making the Turn:
But wouldn't that take a computer and an internet connection (provided by corporations) to accomplish?
WALL STREET PROTESTERS
if so inclined <support>
please sign the petition below
http://www.avaaz.org/en/the_world_vs_wall_st/?fp
==
original link courtesy of alanc
==
4kids
all jmo
JBII .. trading stats .. week ending .. 7/22/2011
            Date	Open	High	Low	Close	Volume	    SHORT %

            07/22/11	2.05	2.29	2.00	2.12	128,437    38.1%
            07/21/11	1.94	2.39	1.50	2.00    1,258,794  34.6%/2,500 t trades
            07/20/11	2.45	2.88	2.27	2.62	304,973    34.6%/2,500 t trades
            07/19/11	2.00	2.44	1.86	2.44	255,726    51.7%
            07/18/11	2.05	2.06	1.87	2.03	196,697    43.5%
            07/15/11	2.03	2.06	1.71	2.03	586,882    59.2%/2,000 t trades
            07/14/11	2.65	2.65	1.76	1.90	832,745    34.3%/1,000 t trades
            07/13/11	2.78	2.80	2.33	2.55	285,463    37.4%
            07/12/11	2.91	2.91	2.78	2.89	82,731     47.4%
            07/11/11	2.94	3.00	2.86	2.91	67,278     37.4%
            07/08/11	3.00	3.04	2.78	2.95	90,731     39.8%
            07/07/11	3.20	3.20	2.94	3.01	119,354    22.5%
            07/06/11	3.20	3.28	3.10	3.16	54,383     41.2%
            07/05/11	3.23	3.24	3.15	3.23	69,820     57%
            07/01/11	2.90	3.21	2.90	3.15	81,860     41.8%/1,000 t trade

                     REG SHO ~ OVER 30% ~ CURRENTLY 14 DAYS
        JUL 2011 ~ volume total currently ~ 4,415,874


            06/30/11	3.30	3.80	2.52	2.90	513,831    25.4%
            06/29/11	3.65	3.65	3.08	3.30	208,414    32.6%
            06/28/11	3.90	3.90	3.63	3.70	80,178     29%
            06/27/11	3.97	3.99	3.85	3.88	43,608     23%
            06/24/11	3.95	3.99	3.93	3.99	110,033    77.4%
            06/23/11	3.90	3.99	3.84	3.93	47,751     18.5%
            06/22/11	3.99	4.09	3.90	3.93	83,867     55.5%
            06/21/11	4.00	4.09	3.93	3.99	33,065     37.2%/1,000 t trades
            06/20/11	4.14	4.14	3.90	3.90	135,256    34.6%
            06/17/11	3.95	4.13	3.95	4.10	145,687    46.3%
            06/16/11	4.05	4.17	3.85	3.98	258,824    44.4%/10,000 t trades
            06/15/11	4.08	4.18	4.03	4.15	213,917    58.7%/12,000 t trades
            06/14/11	3.95	4.20	3.78	4.04	786,401    45.4%/2,000 t trades
            06/13/11	3.73	3.97	3.70	3.94	500,214    57.4%/7,000 t trades
            06/10/11	3.45	3.60	3.22	3.59	201,530    50.3%/1,100 t trades
            06/09/11	3.35	3.76	3.21	3.41	290,105    33.4%
            06/08/11	3.19	3.35	3.17	3.35	176,907    22.8%/22,500 t trades
            06/07/11	3.25	3.30	3.16	3.27	46,516     51.5%
            06/06/11	3.27	3.32	3.15	3.20	70,629     36%/1,500 t trades
            06/03/11	3.25	3.38	3.08	3.22	127,546    25.6%
            06/02/11	3.27	3.39	3.22	3.29	85,391     38.6%
            06/01/11	3.20	3.40	3.19	3.35	49,437     61.3%

                      REG SHO ~ OVER 30% ~ 16 DAYS
        JUN 2011 ~ TOTAL VOLUME TRADED ~ 4,203,607


            05/31/11	3.40	3.47	3.30	3.30	71,249     48.6%/2,700 t trades
            05/27/11	3.22	3.68	3.16	3.44	335,667    48.6%
            05/26/11	3.23	3.25	3.12	3.16	59,802     57.1%
            05/25/11	3.15	3.27	3.05	3.21	86,902     58.7%
            05/24/11	3.16	3.35	3.15	3.17	132,203    32.3%/4,000 t trades
            05/23/11	3.30	3.44	3.28	3.37	95,012     48.4%/6,000 t trades
            05/20/11	3.46	3.46	3.10	3.34	163,141    43.7%/3,500 t trades
            05/19/11	3.25	3.49	3.20	3.35	103,917    50.4%
            05/18/11	3.07	3.38	3.07	3.20	145,329    63.1%/1,500 t trades
            05/17/11	2.90	3.10	2.80	3.00	86,112     57.6%
            05/16/11	3.00	3.15	2.77	2.91	166,856    18.5%
            05/13/11	3.25	3.45	3.03	3.08	196,827    26.6%
            05/12/11	3.05	3.57	3.04	3.25	235,203    42.5%/2,000 t trades
            05/11/11	3.20	3.45	3.20	3.27	143,359    36.3%/2,500 t trades
            05/10/11	3.97	3.98	3.16	3.50	491,161    29.2%/3,500 t trades
            05/09/11	3.30	3.96	3.26	3.95	907,083    46.4%/1,968 t trades
            05/06/11	2.74	3.06	2.62	3.00	264,058    50.7%
            05/05/11	2.95	2.95	2.76	2.81	152,416    31.5%
            05/04/11	3.27	3.30	2.71	3.00	306,008    38.3%/1,500 t trades
            05/03/11	3.25	3.50	3.13	3.30	351,938    43.1%/10,200 t trades
            05/02/11	2.88	3.50	2.88	3.12	531,247    39.1%

                        REG SHO OVER 30% = 18 DAYS
         MAY 2011 ~ TOTAL VOLUME TRADED ~ 5,015,980


            04/29/11	2.24	3.00	2.05	2.78	417,170	     62.7%/20,100 t trades
            04/28/11	1.96	2.25	1.94	2.25	174,529	     55.6%/11,290 t trades
            04/27/11	1.57	2.05	1.55	1.92	392,824	     50.4%/18,293 t trades
            04/26/11	1.59	1.64	1.52	1.61	285,316	     41%
            04/25/11	1.87	1.87	1.68	1.68	286,864	     43.7%/2,000 t trades
            04/21/11	1.22	1.84	1.05    1.84	736,234	     34%
            04/20/11	1.96	2.08	1.17	1.26	949,402	     22.5%
            04/19/11	2.15	2.15	2.00	2.14	171,325	     32.3%
            04/18/11	2.05	2.17	2.05	2.14	131,592	     45.5%
            04/15/11	2.20	2.25	2.00	2.17	234,742	     42.2%
            04/14/11	2.10	2.32	1.90	2.25	375,545      38.6%
            04/13/11	2.21	2.38	1.88	2.30	692,446	     57.8%
            04/12/11	1.80	2.12	1.78	2.12	686,209	     67%
            04/11/11	1.40	1.93	1.30	1.75	907,578      39.6%
            04/08/11	1.10	1.24	1.04	1.24	220,368	     66.7%
            04/07/11	1.05	1.14	0.96	1.11	160,793	     61.9%
            04/06/11	1.01	1.10	0.98	1.05	155,038	     31.5%
            04/05/11	1.07	1.07	0.95	1.00	322,332	     34.3%
            04/04/11	0.88	1.13	0.85	1.04	658,574	     40.6%
            04/01/11	0.84	0.85	0.82	0.85	138,711	     45.1%

                 REG SHO OVER 30% = 19 DAYS
         APR 2011 ~ TOTAL VOLUME TRADED ~ 8,093,592


            03/31/11	0.84	0.84	0.80	0.84	72,760	     40.7%
            03/30/11	0.81	0.81	0.791	0.805	14,350	     23.3%
            03/29/11	0.81	0.84	0.79	0.81	81,478	     26%
            03/28/11	0.84	0.84	0.81	0.81	48,597	     49.1%
            03/25/11	0.83	0.88	0.81	0.83	186,434	     47.2%
            03/24/11	0.795	0.83	0.79	0.83	38,680	     61.7%
            03/23/11	0.81	0.82	0.80	0.80	40,232	     43.7%
            03/22/11	0.82	0.82	0.80	0.80	68,064	     47.5%
            03/21/11	0.83	0.83	0.80	0.82	44,155	     47%
            03/18/11	0.80	0.83	0.80	0.83	59,617	     55.5%
            03/17/11	0.80	0.835	0.79	0.81	118,087	     66.7%
            03/16/11	0.81	0.81	0.61	0.79	60,122	     52.4%
            03/15/11	0.80	0.80	0.78	0.80	38,055       36%
            03/14/11	0.79	0.80	0.77	0.80	48,539       59.5%
            03/11/11	0.785	0.81	0.78	0.80	29,897	     22.5%
            03/10/11	0.82	0.82	0.785	0.81	13,020	     1.6%
            03/09/11	0.83	0.83	0.7901	0.82	34,949       54.4%
            03/08/11	0.82	0.82	0.78	0.82	56,098	     67.3%
            03/07/11	0.84	0.84	0.78	0.82	20,800	     17.3%
            03/04/11	0.85	0.88	0.80	0.84	94,990	     83.4%
            03/03/11	0.80	0.82	0.79	0.82	7,565	     6.1%
            03/02/11	0.79	0.80	0.78	0.80	18,076	     16%
            03/01/11	0.80	0.81	0.80	0.80	41,727       15.7%

                    REG SHO OVER 30% = 15 DAYS
         MAR 2011 ~ TOTAL VOLUME TRADED ~ 1,236,292


            02/28/11	0.80	0.82	0.80	0.81	33,239	     31%
            02/25/11	0.79	0.835	0.79	0.81	31,909	     28.2%
            02/24/11	0.817	0.835	0.80	0.80	18,058	     54.1%
            02/23/11	0.84	0.84	0.79	0.816	52,489	     62.1%
            02/22/11	0.87	0.8799	0.815	0.84	46,077	     2.6%
            02/18/11	0.82	0.88	0.80	0.87	35,687	     7%
            02/17/11	0.864	0.864	0.80	0.86	69,191       23.2%
            02/16/11	0.86	0.864	0.828	0.864	39,375	     35.3%
            02/15/11	0.885	0.885	0.82	0.855	41,250       65.3%
            02/14/11	0.84	0.85	0.79	0.82	60,817	     22.3%
            02/11/11	0.77	0.8788	0.77	0.85	47,806	     29%
            02/10/11	0.824	0.888	0.77	0.8388	77,249	     29.3%
            02/09/11	0.76	0.8498	0.76	0.77	117,105	     40.1%
            02/08/11	0.78	0.82	0.72	0.76	87,250	     24.1%
            02/07/11	0.80	0.888	0.76	0.80	36,205	     59.3%
            02/04/11	0.87	0.87	0.80	0.85	93,475	     23.3%
            02/03/11	0.895	0.90	0.845	0.8799	109,875	     53.7%
            02/02/11	0.92	0.94	0.87	0.88	225,396	     17.7%
            02/01/11	0.83	0.87	0.8031	0.87	99,279	     29.2%

                     REG SHO OVER 30% = 8 DAYS
         FEB 2011 ~ TOTAL VOLUME TRADED ~ 1,321,732


            01/31/11	0.82	0.83	0.80	0.83	53,733	     35.7%
            01/28/11	0.81	0.82	0.785	0.82	161,153	     52%
            01/27/11	0.815	0.83	0.80	0.81	22,610	     79.3%
            01/26/11	0.82	0.83	0.78	0.82	37,543	     ===
            01/25/11	0.80	0.82	0.791	0.82	108,230	     28.2%
            01/24/11	0.815	0.815	0.775	0.80	61,130	     40.6%
            01/21/11	0.794	0.82	0.771	0.815	78,942	     30%
            01/20/11	0.79	0.80	0.77	0.795	132,149	     18.5%
            01/19/11	0.77	0.79	0.761	0.79	100,943	     33.5%
            01/18/11	0.75	0.79	0.72	0.77	153,578      30.8%
            01/14/11	0.68	0.75	0.68	0.75	89,264	     71.2%
            01/13/11	0.79	0.79	0.66	0.68	102,498	     32.2%
            01/12/11	0.69	0.69	0.66	0.675	45,961	     24.5%
            01/11/11	0.74	0.74	0.662	0.69	91,237	     54.7%
            01/10/11	0.80	0.80	0.70	0.7399	48,062       44.3%
            01/07/11	0.74	0.74	0.70	0.719	89,455	     10.2%
            01/06/11	0.70	0.77	0.70	0.74	109,155	     28.6%
            01/05/11	0.77	0.80	0.71	0.73	64,338	     22.6%
            01/04/11	0.67	0.75	0.67	0.71	85,065       25.4%
            01/03/11	0.65	0.67	0.65	0.67	96,008       12.2%

                     REG SHO OVER 30% = 11 DAYS
         JAN 2011 ~ TOTAL VOLUME TRADED ~ 1,731,054


            12/31/10	0.57	0.66	0.54	0.65	325,552      22.7%
            12/30/10	0.60	0.60	0.55	0.56	225,954	     30.3%
            12/29/10	0.60	0.60	0.54	0.58	219,868	     23.4%
            12/28/10	0.615	0.65	0.585	0.60	219,392	      9.2%
            12/27/10	0.70	0.70	0.605	0.69	112,852	      3.2%
            12/23/10	0.8475	0.895	0.65	0.70	356,969      33.3%
            12/22/10	0.83	0.86	0.79	0.85	279,657	     37.8%
            12/21/10	0.86	0.86	0.77	0.7711	301,917      29.6%
            12/20/10	0.89	0.89	0.76	0.76	184,651      34.7%
            12/17/10	0.94	1.01	0.77	0.83	473,413      28.5%
            12/16/10	0.86	1.35	0.78	0.92	1,546,137    33.3%
            12/15/10	0.52	0.77	0.51	0.77	895,815      32.0%

        DEC 2010 ~ TOTAL VOLUME TRADED ~ 6,242,313
==
4kids
all jmo
TORONTO, ONTARIO--(Marketwire - 07/07/11) - InterAmerican Gaming Inc. ("the Company") (OTC.BB:IAGM - News) announced today that it has entered into a letter of intent with Baron Group Ventures ("BGV") to acquire an 80.1% interest in NOWPHIT (www.nowphit.com). NOWPHIT is a new social gaming platform and smartphone application that empowers and inspires people to improve their personal health and fitness and makes it easier to achieve healthy lifestyle goals. The NOWPHIT app will be available for the iPhone via the iTunes Store at launch (expected Q4 2011), with Blackberry and Android versions to follow.
NOWPHIT syncs with gym or at-home fitness machines and allows "NOWPHIT athletes" to track, train and compete with each other over the NOWPHIT network in real time for virtual and real-life rewards such as trophies, medals and location-based coupons and special offers. NOWPHIT also features a charitable and event function. NOWPHIT athletes can raise donations for a charity of their choice, and virtually train and compete in real athletic events anywhere around the world (i.e. the New York City Marathon).
InterAmerican Gaming is acquiring NOWPHIT by issuing sixty-five million (65,000,000) of its common shares. The terms also require IAGM to exclusively fund the development of NOWPHIT through recourse loans to a maximum of five million dollars (US$5,000,000). At closing, Mr. Marc Askenasi, the founder of NOWPHIT and principal shareholder of BGV, will enter into a management agreement to become Chief Executive Officer of the Company. The closing of the acquisition is subject to mutual due diligence, the completion of the formal purchase and sale documents, and settlement of certain liabilities of the Company. Closing is anticipated to occur in August 2011.
"With our existing business in IAGM having suffered significantly from the global financial crisis, NOWPHIT presents an exciting opportunity for the company to rebuild value for its shareholders," said Mr. John G. Simmonds, President and CEO of InterAmerican Gaming Inc. "Marc is an excellent Internet entrepreneur and the NOWPHIT solution he has developed meets a real need. Health and fitness have become critical social issues due to an aging North American population and increased pressure on our health care system. I believe the NOWPHIT solution will be embraced by health and fitness professionals and become a valuable service for people looking to live a healthier and more active lifestyle."
"It was evident early on to me and my team that a public company structure would provide increased value to our employees, our channel and strategic partners, and it would position us to make other acquisitions in the future. The structure would also facilitate increased exposure for the NOWPHIT brand," stated Mr. Marc Askenasi, founder of NOWPHIT. "The partnership with InterAmerican Gaming provides that structure, but we recognize there is still a lot of work to do. We are working on the Company's public company filings and financial statements and we will begin cleaning up InterAmerican's corporate affairs immediately. We intend to work diligently to close the acquisition this summer so we are well prepared for our launch later this year."
JBII .. trading stats .. week ending .. 6/24/2011 Date Open High Low Close Volume SHORT %
06/24/11 3.95 3.99 3.93 3.99 110,033 77.4%
06/23/11 3.90 3.99 3.84 3.93 47,751 18.5%
06/22/11 3.99 4.09 3.90 3.93 83,867 55.5%
06/21/11 4.00 4.09 3.93 3.99 33,065 37.2%/1,000 t trades
06/20/11 4.14 4.14 3.90 3.90 135,256 34.6%
06/17/11 3.95 4.13 3.95 4.10 145,687 46.3%
06/16/11 4.05 4.17 3.85 3.98 258,824 44.4%/10,000 t trades
06/15/11 4.08 4.18 4.03 4.15 213,917 58.7%/12,000 t trades
06/14/11 3.95 4.20 3.78 4.04 786,401 45.4%/2,000 t trades
06/13/11 3.73 3.97 3.70 3.94 500,214 57.4%/7,000 t trades
06/10/11 3.45 3.60 3.22 3.59 201,530 50.3%/1,100 t trades
06/09/11 3.35 3.76 3.21 3.41 290,105 33.4%
06/08/11 3.19 3.35 3.17 3.35 176,907 22.8%/22,500 t trades
06/07/11 3.25 3.30 3.16 3.27 46,516 51.5%
06/06/11 3.27 3.32 3.15 3.20 70,629 36%/1,500 t trades
06/03/11 3.25 3.38 3.08 3.22 127,546 25.6%
06/02/11 3.27 3.39 3.22 3.29 85,391 38.6%
06/01/11 3.20 3.40 3.19 3.35 49,437 61.3%
REG SHO ~ OVER 30% ~ 15 DAYS
JUN 2011 ~ VOLUME currently ~ 3,363,076
05/31/11 3.40 3.47 3.30 3.30 71,249 48.6%/2,700 t trades
05/27/11 3.22 3.68 3.16 3.44 335,667 48.6%
05/26/11 3.23 3.25 3.12 3.16 59,802 57.1%
05/25/11 3.15 3.27 3.05 3.21 86,902 58.7
05/24/11 3.16 3.35 3.15 3.17 132,203 32.3%/4,000 t trades
05/23/11 3.30 3.44 3.28 3.37 95,012 48.4%/6,000 t trades
05/20/11 3.46 3.46 3.10 3.34 163,141 43.7%/3,500 t trades
05/19/11 3.25 3.49 3.20 3.35 103,917 50.4%
05/18/11 3.07 3.38 3.07 3.20 145,329 63.1%/1,500 t trades
05/17/11 2.90 3.10 2.80 3.00 86,112 57.6%
05/16/11 3.00 3.15 2.77 2.91 166,856 18.5%
05/13/11 3.25 3.45 3.03 3.08 196,827 26.6%
05/12/11 3.05 3.57 3.04 3.25 235,203 42.5%/2,000 t trades
05/11/11 3.20 3.45 3.20 3.27 143,359 36.3%/2,500 t trades
05/10/11 3.97 3.98 3.16 3.50 491,161 29.2%/3,500 t trades
05/09/11 3.30 3.96 3.26 3.95 907,083 46.4%/1,968 t trades
05/06/11 2.74 3.06 2.62 3.00 264,058 50.7%
05/05/11 2.95 2.95 2.76 2.81 152,416 31.5%
05/04/11 3.27 3.30 2.71 3.00 306,008 38.3%/1,500 t trades
05/03/11 3.25 3.50 3.13 3.30 351,938 43.1%/10,200 t trades
05/02/11 2.88 3.50 2.88 3.12 531,247 39.1%
REG SHO OVER 30% = 18 DAYS
MAY 2011 ~ TOTAL VOLUME ~ 5,015,980
04/29/11 2.24 3.00 2.05 2.78 417,170 62.7%/20,100 t trades
04/28/11 1.96 2.25 1.94 2.25 174,529 55.6%/11,290 t trades
04/27/11 1.57 2.05 1.55 1.92 392,824 50.4%/18,293 t trades
04/26/11 1.59 1.64 1.52 1.61 285,316 41%
04/25/11 1.87 1.87 1.68 1.68 286,864 43.7%/2,000 t trades
04/21/11 1.22 1.84 1.05 1.84 736,234 34%
04/20/11 1.96 2.08 1.17 1.26 949,402 22.5%
04/19/11 2.15 2.15 2.00 2.14 171,325 32.3%
04/18/11 2.05 2.17 2.05 2.14 131,592 45.5%
04/15/11 2.20 2.25 2.00 2.17 234,742 42.2%
04/14/11 2.10 2.32 1.90 2.25 375,545 38.6%
04/13/11 2.21 2.38 1.88 2.30 692,446 57.8%
04/12/11 1.80 2.12 1.78 2.12 686,209 67%
04/11/11 1.40 1.93 1.30 1.75 907,578 39.6%
04/08/11 1.10 1.24 1.04 1.24 220,368 66.7%
04/07/11 1.05 1.14 0.96 1.11 160,793 61.9%
04/06/11 1.01 1.10 0.98 1.05 155,038 31.5%
04/05/11 1.07 1.07 0.95 1.00 322,332 34.3%
04/04/11 0.88 1.13 0.85 1.04 658,574 40.6%
04/01/11 0.84 0.85 0.82 0.85 138,711 45.1%
REG SHO OVER 30% = 19 DAYS
APR 2011 ~ TOTAL VOLUME ~ 8,093,592
03/31/11 0.84 0.84 0.80 0.84 72,760 40.7%
03/30/11 0.81 0.81 0.791 0.805 14,350 23.3%
03/29/11 0.81 0.84 0.79 0.81 81,478 26%
03/28/11 0.84 0.84 0.81 0.81 48,597 49.1%
03/25/11 0.83 0.88 0.81 0.83 186,434 47.2%
03/24/11 0.795 0.83 0.79 0.83 38,680 61.7%
03/23/11 0.81 0.82 0.80 0.80 40,232 43.7%
03/22/11 0.82 0.82 0.80 0.80 68,064 47.5%
03/21/11 0.83 0.83 0.80 0.82 44,155 47%
03/18/11 0.80 0.83 0.80 0.83 59,617 55.5%
03/17/11 0.80 0.835 0.79 0.81 118,087 66.7%
03/16/11 0.81 0.81 0.61 0.79 60,122 52.4%
03/15/11 0.80 0.80 0.78 0.80 38,055 36%
03/14/11 0.79 0.80 0.77 0.80 48,539 59.5%
03/11/11 0.785 0.81 0.78 0.80 29,897 22.5%
03/10/11 0.82 0.82 0.785 0.81 13,020 1.6%
03/09/11 0.83 0.83 0.7901 0.82 34,949 54.4%
03/08/11 0.82 0.82 0.78 0.82 56,098 67.3%
03/07/11 0.84 0.84 0.78 0.82 20,800 17.3%
03/04/11 0.85 0.88 0.80 0.84 94,990 83.4%
03/03/11 0.80 0.82 0.79 0.82 7,565 6.1%
03/02/11 0.79 0.80 0.78 0.80 18,076 16%
03/01/11 0.80 0.81 0.80 0.80 41,727 15.7%
REG SHO OVER 30% = 15 DAYS
MAR 2011 ~ TOTAL VOLUME TRADED ~ 1,236,292
02/28/11 0.80 0.82 0.80 0.81 33,239 31%
02/25/11 0.79 0.835 0.79 0.81 31,909 28.2%
02/24/11 0.817 0.835 0.80 0.80 18,058 54.1%
02/23/11 0.84 0.84 0.79 0.816 52,489 62.1%
02/22/11 0.87 0.8799 0.815 0.84 46,077 2.6%
02/18/11 0.82 0.88 0.80 0.87 35,687 7%
02/17/11 0.864 0.864 0.80 0.86 69,191 23.2%
02/16/11 0.86 0.864 0.828 0.864 39,375 35.3%
02/15/11 0.885 0.885 0.82 0.855 41,250 65.3%
02/14/11 0.84 0.85 0.79 0.82 60,817 22.3%
02/11/11 0.77 0.8788 0.77 0.85 47,806 29%
02/10/11 0.824 0.888 0.77 0.8388 77,249 29.3%
02/09/11 0.76 0.8498 0.76 0.77 117,105 40.1%
02/08/11 0.78 0.82 0.72 0.76 87,250 24.1%
02/07/11 0.80 0.888 0.76 0.80 36,205 59.3%
02/04/11 0.87 0.87 0.80 0.85 93,475 23.3%
02/03/11 0.895 0.90 0.845 0.8799 109,875 53.7%
02/02/11 0.92 0.94 0.87 0.88 225,396 17.7%
02/01/11 0.83 0.87 0.8031 0.87 99,279 29.2%
REG SHO OVER 30% = 8 DAYS
FEB 2011 ~ TOTAL VOLUME TRADED ~ 1,321,732
01/31/11 0.82 0.83 0.80 0.83 53,733 35.7%
01/28/11 0.81 0.82 0.785 0.82 161,153 52%
01/27/11 0.815 0.83 0.80 0.81 22,610 79.3%
01/26/11 0.82 0.83 0.78 0.82 37,543 ===
01/25/11 0.80 0.82 0.791 0.82 108,230 28.2%
01/24/11 0.815 0.815 0.775 0.80 61,130 40.6%
01/21/11 0.794 0.82 0.771 0.815 78,942 30%
01/20/11 0.79 0.80 0.77 0.795 132,149 18.5%
01/19/11 0.77 0.79 0.761 0.79 100,943 33.5%
01/18/11 0.75 0.79 0.72 0.77 153,578 30.8%
01/14/11 0.68 0.75 0.68 0.75 89,264 71.2%
01/13/11 0.79 0.79 0.66 0.68 102,498 32.2%
01/12/11 0.69 0.69 0.66 0.675 45,961 24.5%
01/11/11 0.74 0.74 0.662 0.69 91,237 54.7%
01/10/11 0.80 0.80 0.70 0.7399 48,062 44.3%
01/07/11 0.74 0.74 0.70 0.719 89,455 10.2%
01/06/11 0.70 0.77 0.70 0.74 109,155 28.6%
01/05/11 0.77 0.80 0.71 0.73 64,338 22.6%
01/04/11 0.67 0.75 0.67 0.71 85,065 25.4%
01/03/11 0.65 0.67 0.65 0.67 96,008 12.2%
REG SHO OVER 30% = 11 DAYS
JAN 2011 ~ TOTAL VOLUME TRADED ~ 1,731,054
12/31/10 0.57 0.66 0.54 0.65 325,552 22.7%
12/30/10 0.60 0.60 0.55 0.56 225,954 30.3%
12/29/10 0.60 0.60 0.54 0.58 219,868 23.4%
12/28/10 0.615 0.65 0.585 0.60 219,392 9.2%
12/27/10 0.70 0.70 0.605 0.69 112,852 3.2%
12/23/10 0.8475 0.895 0.65 0.70 356,969 33.3%
12/22/10 0.83 0.86 0.79 0.85 279,657 37.8%
12/21/10 0.86 0.86 0.77 0.7711 301,917 29.6%
12/20/10 0.89 0.89 0.76 0.76 184,651 34.7%
12/17/10 0.94 1.01 0.77 0.83 473,413 28.5%
12/16/10 0.86 1.35 0.78 0.92 1,546,137 33.3%
12/15/10 0.52 0.77 0.51 0.77 895,815 32.0%
DEC 2010 ~ TOTAL VOLUME TRADED ~ 6,242,313 shares
==
4kids
all jmo
EXPH .. trading stats .. week ending ..6/24/2011 Date Open High Low Close Volume SHORT %
here are some interesting facts re: EXPH in 2011
AS last increased on 2/1/2011
shares issued via TA last on 2/3/2011
less than 114M shares took out the .0002s at ask
less than 44M shares took out the .0003s at ask ~ .0003s touched for the
first time in 2011 on 4/25/2011 tape 4/25
approx 24.8M has *traded* at .0004 in 2011 at ask
first day traded at .0004 is on 4/26/2011 tape 4/26
EXPO's MGMT has released 3 PR's in 2011
<early feb early apr and early may>
and 5 PRs' in total since sept 2010 ~ that is
almost TEN MONTHS for 5 PR'S
tellingly imo are the *sizes* shown via NITE & ETMM <EXPH's
PRIMARY & SECONDARY MM re: ACTIVITY> @ .0004 on ask
'cos on monday may 9th .. finra's reg 6460 kicked in showing
sizes on both bid and ask via *respective* MMs' ..
just another *observation* that can be tracked in total
effective june 1st .. info for the MMs' for june is due out
next friday .. july 1 .. via finra
even more interesting to observe over the past month are the
lack of *taps* bid whacking EXPH .. the last done @ .0002
was on june 8th <500 and 1k> tape 6/8
oh and have to love a CONTROLLED STOCK .. i look forward
to the catalyst *breaking* the control on exph :)
06/24/11 0.0003 0.0004 0.0003 0.0004 41,580 ===
06/23/11 0.0003 0.0004 0.0003 0.0004 7,090,000 42.3%
06/22/11 0.0003 0.0004 0.0003 0.0004 5,315,554 50%
06/21/11 0.0003 0.0004 0.0003 0.0004 10,510,000 60.1%
06/20/11 0.0003 0.0004 0.0003 0.0004 3,586,005 14.5%
06/17/11 0.0003 0.0004 0.0003 0.0004 4,857,265 38%
06/16/11 0.0003 0.0004 0.0003 0.0004 3,766,000 57%
06/15/11 0.0003 0.0004 0.0003 0.0003 3,900,400 20.5%
06/14/11 0.0003 0.0004 0.0003 0.0004 5,003,100 40%
06/13/11 0.0004 0.0004 0.0004 0.0004 105,000 ===
06/10/11 0.0003 0.0003 0.0003 0.0003 5,605,000 82.6%
06/09/11 0.0003 0.0004 0.0003 0.0004 3,925,000 23.8%
06/08/11 0.0003 0.0004 0.0002 0.0003 3,369,250 22.5%
06/07/11 0.0004 0.0004 0.0002 0.0004 28,537,491 48.8%
06/06/11 0.0003 0.0004 0.0003 0.0003 47,885,703 86%
06/03/11 0.0003 0.0003 0.0003 0.0003 340,134 ===
06/02/11 0.0003 0.0003 0.0002 0.0003 4,934,277 43.7%
06/01/11 0.0002 0.0003 0.0002 0.0003 3,335,000 7.4%
JUN 2011 ~ current volume ~ 142,106,759
exph closes *even* = 10 DAYS
exph closes *up* = 3 DAYS
exph closes *down* = 3 DAYS
05/31/11 0.0003 0.0003 0.0002 0.0002 15,212,667 13.8%
05/27/11 0.0003 0.0003 0.0003 0.0003 762,400 100%
05/26/11 0.0002 0.0003 0.0002 0.0003 5,529,595 ===
05/25/11 0.0003 0.0003 0.0002 0.0003 1,189,750 97.8%
05/24/11 0.0003 0.0003 0.0002 0.0002 820,978 24.6%
05/23/11 0.0002 0.0002 0.0002 0.0002 2,000 ===
05/20/11 0.0003 0.0003 0.0002 0.0003 13,130,000 43%
05/19/11 0.0003 0.0003 0.0003 0.0003 3,000,000 100%
05/18/11 0.0003 0.0003 0.0002 0.0003 4,175,000 71.8%
05/17/11 0.0002 0.0003 0.0002 0.0003 301,000 ===
05/16/11 0.0003 0.0003 0.0002 0.0003 9,049,966 44.1%
05/13/11 0.0002 0.0003 0.0002 0.0003 1,063,160 94%
05/12/11 0.0003 0.0004 0.0002 0.0003 3,290,999 57.7%
05/11/11 0.0003 0.0004 0.0003 0.0004 6,106,366 87.4%
05/10/11 0.0004 0.0004 0.0003 0.0003 2,400,000 33.3%
05/09/11 0.0003 0.0003 0.0003 0.0003 28,977,774 91.2%
05/06/11 0.0003 0.0003 0.0002 0.0003 60,908,104 28%
05/05/11 0.0004 0.0004 0.0003 0.0003 10,643,330 7%
05/04/11 0.0003 0.0004 0.0003 0.0003 5,550,000 20.2%
05/03/11 0.0003 0.0004 0.0003 0.0004 70,776,215 63.1%
05/02/11 0.0002 0.0003 0.0002 0.0003 59,121,639 57.9%
MAY 2011 ~ 21 days traded ~ TOTAL VOLUME ~ 302,010,943
exph closes *even* = 14 DAYS
exph closes *up* = 3 DAYS
exph closes *down* = 4 DAYS
04/29/11 0.0003 0.0003 0.0002 0.0003 41,254,496 87%
04/28/11 0.0004 0.0004 0.0002 0.0003 57,469,582 17%
04/27/11 0.0003 0.0004 0.0002 0.0004 70,204,384 45.4%
04/26/11 0.0002 0.0004 0.0002 0.0004 67,272,459 70%
04/25/11 0.0002 0.0003 0.0002 0.0002 129,550,931 85.4%
04/21/11 0.0001 0.0002 0.0001 0.0002 35,905,000 98%
04/20/11 0.0001 0.0001 0.0001 0.0001 530,000 ===
04/19/11 0.0001 0.0002 0.0001 0.0001 3,631,555 82.6%
04/18/11 0.0000 0.0000 0.0000 0.0000 ========= ===
04/15/11 0.0002 0.0002 0.0002 0.0002 4,875,000 100%
04/14/11 0.0002 0.0002 0.0002 0.0002 5,000,000 100%
04/13/11 0.0002 0.0002 0.0002 0.0002 320,000 ===
04/12/11 0.0001 0.0002 0.0001 0.0002 13,139,323 7.6% (1 trade @ .0002 reg sho)
04/11/11 0.0002 0.0002 0.0002 0.0002 2,000,000 100%
04/08/11 0.0002 0.0002 0.0002 0.0002 911 100%
04/06/11 0.0002 0.0002 0.0001 0.0001 21,699,990 32.2% (7M trade at .0002 reg sho)
04/05/11 0.0001 0.0001 0.0001 0.0001 1,347,556 ===
04/04/11 0.0001 0.0002 0.0001 0.0002 7,736,443 ===
04/01/11 0.0001 0.0002 0.0001 0.0002 6,000 ===
APR 2011~ 18 days traded ~ TOTAL VOLUME ~ 461,943,630
exph closes *even* ~ 12 days
exph closes *up* ~ 3 days
exph closes *down* ~ 3 days
03/31/11 0.0002 0.0002 0.0002 0.0002 280,000 ===
03/30/11 0.0001 0.0002 0.0001 0.0001 77,582,580 30.3%
03/29/11 0.0001 0.0001 0.0001 0.0001 6,306,189 ===
03/28/11 0.0002 0.0002 0.0001 0.0001 1,001,690 ===
03/25/11 0.0001 0.0001 0.0001 0.0001 3,000,000 ===
03/24/11 0.0001 0.0002 0.0001 0.0001 12,378,815 71.6%
03/23/11 0.0001 0.0001 0.0001 0.0001 1,189,999 ===
03/22/11 0.0001 0.0001 0.0001 0.0001 121,018 ===
03/21/11 0.0001 0.0002 0.0001 0.0002 2,807,004 78.4% (both trades @ .0002 reg sho)
03/18/11 0.0001 0.0002 0.0001 0.0002 2,486,999 ===
03/17/11 0.0001 0.0002 0.0001 0.0002 500,970 === (850 shares @ .0002 reg sho)
03/16/11 0.0002 0.0002 0.0001 0.0001 2,921,965 99.9% (only trade @ .0002 reg sho)
03/15/11 0.0001 0.0002 0.0001 0.0002 12,500,200 47.5%
03/14/11 0.0002 0.0002 0.0001 0.0001 18,490,598 67.5%
03/11/11 0.0001 0.0002 0.0001 0.0002 3,945,405 ===
03/10/11 0.0001 0.0002 0.0001 0.0001 17,164,654 13.8% (only trade @ .0002 reg sho)
03/09/11 0.0001 0.0002 0.0001 0.0001 2,010,100 99.4% (1 trade @ .0002 reg sho)
03/08/11 0.0002 0.0002 0.0001 0.0001 8,250,850 97.5% (3 trades @ .0002 reg sho)
03/07/11 0.0002 0.0002 0.0002 0.0002 1,000,000 ===
03/04/11 0.0001 0.0001 0.0001 0.0001 4,607,400 === (RS .. BID BACK on exph .. zero trades reg sho)
03/03/11 0.0001 0.0002 0.0001 0.0002 5,145,750 === (RS .. BID BACK on exph .. zero trades reg sho)
03/02/11 0.0001 0.0001 0.0001 0.0001 8,647,100 === (RS .. BID BACK on exph .. zero trades reg sho)
03/01/11 0.0001 0.0002 0.0001 0.0002 11,749,660 === (RS .. BID BACK on exph .. zero trades reg sho)
MAR 2011 ~ 23 days traded ~ TOTAL VOLUME ~ 204,088,946
exph closes *even* ~ 10 days
exph closes *up* ~ 7 days
exph closes *down* ~ 6 days
=====================================================
EXPH OCT 2010 - JUN 2011 ~ OS & AS INFO
OCTOBER 21, 2010 ~ 1.973.987.656 (AS = 2B)
OCTOBER 22, 2010 ~ 2.047.945.311 (AS = 2.050B)
NOVEMBER 03, 2010 ~ 2.047.945.311 (AS = 2.050B)
NOVEMBER 04, 2010 ~ 2.189.048.732 (AS = 2.2B)
NOVEMBER 16, 2010 ~ 2.189.048.732 (AS = 2.2B)
NOVEMBER 17, 2010 ~ 2.355.715.398 (AS = 2.4B)
NOVEMBER 26, 2010 ~ 2.355.715.398 (AS = 2.4B)
NOVEMBER 29, 2010 ~ 2.355.715.398 (AS NV 2.560 TA 2.4B)
DECEMBER 03, 2010 ~ 2.355.715.398 (AS NV 2.560 TA 2.4B)
DECEMBER 07, 2010 ~ 2.355.715.398 (AS NV 2.560 TA 2.4B)
DECEMBER 08, 2010 ~ 2.556.802.354 (AS 2.560)
DECEMBER 10, 2010 ~ 2.556.802.354 (AS 2.560)
DECEMBER 15, 2010 ~ 2.556.802.354 (AS 2.560)
DECEMBER 16, 2010 ~ 2.779.024.576 (AS 2.8B)
DECEMBER 22, 2010 ~ 2.779.024.576 (AS 2.8B)
DECEMBER 28, 2010 ~ 2.779.024.576 (AS NV 3.1B TA 2.8B)
DECEMBER 31, 2010 ~ 2.779.024.576 (AS NV 3.1B TA 2.8B)
JANUARY 07, 2011 ~ 2.779.024.576 (AS NV 3.1B TA 2.8B)
JANUARY 10, 2011 ~ 2.779.024.576 (AS NV 3.1B TA 2.8B)
JANUARY 11, 2011 ~ 3.052.997.178 (AS 3.1B)
JANUARY 12, 2011 ~ 3.052.997.178 (AS 3.1B)
JANUARY 13, 2011 ~ 3.052.997.178 (AS 3.1B)
JANUARY 21, 2011 ~ 3.052.997.178 (AS 3.1B)
FEBRUARY 01, 2011 ~ 3.053.997.178 (AS NV 3.33B TA 3.1B)
FEBRUARY 02, 2011 ~ 3.053.997.178 (AS NV 3.33B TA 3.1B)
FEBRUARY 03, 2011 ~ 3.325.724.450 (AS 3.33B)
FEBRUARY 07, 2011 ~ 3.325.724.450 (AS 3.33B)
FEBRUARY 11, 2011 ~ 3.325.724.450 (AS 3.33B)
FEBRUARY 18, 2011 ~ 3.325.724.450 (AS 3.33B)
FEBRUARY 25, 2011 ~ 3.325.724.450 (AS 3.33B)
MARCH 04, 2011 ~ 3.325.724.450 (AS 3.33B)
MARCH 18, 2011 ~ 3.325.724.450 (AS 3.33B)
APRIL 01, 2011 ~ 3.325.724.450 (AS 3.33B)
APRIL 15, 2011 ~ 3.325.724.450 (AS 3.33B)
APRIL 21, 2011 ~ 3.325.724.450 (AS 3.33B)
MAY 02, 2011 ~ 3.325.724.450 (AS 3.33B)
MAY 13, 2011 ~ 3.325.724.450 (AS 3.33B)
JUN 01, 2011 ~ 3.325.724.450 (AS 3.33B)
JUN 24, 2011 ~ 3.325.724.450 (AS 3.33B)
============================================================
and one last bit of data .. epxh's closing pps/volume from
9/30/2009 ~ 05/31/2011 or how a stock gets cellar boxed
*regardless* of .. er .. volume :0
Date Open High Low Close Volume
05/31/11 0.0003 0.0003 0.0002 0.0002 15,212,667
04/29/11 0.0003 0.0003 0.0002 0.0003 41,254,496
03/31/11 0.0002 0.0002 0.0002 0.0002 280,000
02/28/11 0.0001 0.0001 0.0001 0.0001 1,200,240
01/31/11 0.0001 0.0002 0.0001 0.0001 2,446,000
12/31/10 0.0001 0.0002 0.0001 0.0002 9,560,295
11/30/10 0.0002 0.0002 0.0001 0.0002 20,434,477
10/29/10 0.0004 0.0006 0.0004 0.0006 30,848,954
09/30/10 0.0006 0.0008 0.0006 0.0008 19,117,500
08/31/10 0.0017 0.0019 0.0015 0.0018 17,006,717
07/30/10 0.0005 0.0005 0.0004 0.0005 22,767,174
06/30/10 0.0005 0.0005 0.0004 0.0005 19,336,500
05/28/10 0.0006 0.0007 0.0005 0.0006 7,963,785
04/30/10 0.001 0.0011 0.0009 0.001 67,856,017
03/31/10 0.0012 0.0012 0.001 0.0012 9,820,090
02/26/10 0.0022 0.0026 0.002 0.0026 2,671,150
01/29/10 0.0029 0.0031 0.0028 0.0029 2,823,606
12/31/09 0.004 0.004 0.0035 0.0035 2,678,990
11/30/09 0.0073 0.0074 0.0069 0.0072 4,771,260
10/30/09 0.0067 0.0082 0.0066 0.0078 28,627,473
09/30/09 0.01 0.0104 0.0095 0.0098 26,320,045
link back for prior month's trading stats
===
4kids
all jmo
ZAGG .. another new 52 week high hit today Last Trade 15.55
i see 20.00 bucks in ZAGG's horizon
due to a wee problem *abusive* shorts have .. lol
expect a few other totally legit co.s with *abusive* shorts
very much *entrenched* to follow course in due time ..
QPSA/JBII/EXPH <among others>
==
Detailed Quote:ZAGG
ZAGG INCORPORATED
15.55 0.614 (4.11 %)AS OF 11:18:02AM ET 06/23/2011
Trade Time 11:18:02am ET
Last Trade Exchange CBOE
Today's Change 0.614
Today's % Change 4.11%
Open 14.64
Today's High 15.82 **
Today's Low 13.80
Previous Close Price
06/22/2011 14.936
52-Week High
06/22/2011 15.30 **
52-Week Low
06/23/2010 2.30
Volume 2,059,094
10-Day Average Volume 2,229,276
90-Day Average Volume 1,380,738
==
4kids
all jmo
NHSH - AUDITED FINANCIALS - PROFITABLE
http://www.otcmarkets.com/otciq/ajax/showFinancialReportById.pdf?id=54210
JBII .. trading stats .. week ending .. 6/17/2011
          Date	       Open	High	Low	Close	Volume	    SHORT %

          06/17/11	3.95	4.13	3.95	4.10	145,687    46.3%
          06/16/11	4.05	4.17	3.85	3.98	258,824    44.4%/10,000 t trades
          06/15/11	4.08	4.18	4.03	4.15	213,917    58.7%/12,000 t trades
          06/14/11	3.95	4.20	3.78	4.04	786,401    45.4%/2,000 t trades
          06/13/11	3.73	3.97	3.70	3.94	500,214    57.4%/7,000 t trades
          06/10/11	3.45	3.60	3.22	3.59	201,530    50.3%/1,100 t trades
          06/09/11	3.35	3.76	3.21	3.41	290,105    33.4%
          06/08/11	3.19	3.35	3.17	3.35	176,907    22.8%/22,500 t trades
          06/07/11	3.25	3.30	3.16	3.27	46,516     51.5%
          06/06/11	3.27	3.32	3.15	3.20	70,629     36%/1,500 t trades
          06/03/11	3.25	3.38	3.08	3.22	127,546    25.6%
          06/02/11	3.27	3.39	3.22	3.29	85,391     38.6%
          06/01/11	3.20	3.40	3.19	3.35	49,437     61.3%

                    REG SHO ~ OVER 30% ~ 11 DAYS
                JUN 2011 ~ VOLUME currently ~ 2,953,104


          05/31/11	3.40	3.47	3.30	3.30	71,249     48.6%/2,700 t trades
          05/27/11	3.22	3.68	3.16	3.44	335,667    48.6%
          05/26/11	3.23	3.25	3.12	3.16	59,802     57.1%
          05/25/11	3.15	3.27	3.05	3.21	86,902     58.7
          05/24/11	3.16	3.35	3.15	3.17	132,203    32.3%/4,000 t trades
          05/23/11	3.30	3.44	3.28	3.37	95,012     48.4%/6,000 t trades
          05/20/11	3.46	3.46	3.10	3.34	163,141    43.7%/3,500 t trades
          05/19/11	3.25	3.49	3.20	3.35	103,917    50.4%
          05/18/11	3.07	3.38	3.07	3.20	145,329    63.1%/1,500 t trades
          05/17/11	2.90	3.10	2.80	3.00	86,112     57.6%
          05/16/11	3.00	3.15	2.77	2.91	166,856    18.5%
          05/13/11	3.25	3.45	3.03	3.08	196,827    26.6%
          05/12/11	3.05	3.57	3.04	3.25	235,203    42.5%/2,000 t trades
          05/11/11	3.20	3.45	3.20	3.27	143,359    36.3%/2,500 t trades
          05/10/11	3.97	3.98	3.16	3.50	491,161    29.2%/3,500 t trades
          05/09/11	3.30	3.96	3.26	3.95	907,083    46.4%/1,968 t trades
          05/06/11	2.74	3.06	2.62	3.00	264,058    50.7%
          05/05/11	2.95	2.95	2.76	2.81	152,416    31.5%
          05/04/11	3.27	3.30	2.71	3.00	306,008    38.3%/1,500 t trades
          05/03/11	3.25	3.50	3.13	3.30	351,938    43.1%/10,200 t trades
          05/02/11	2.88	3.50	2.88	3.12	531,247    39.1%

                      REG SHO OVER 30% = 18 DAYS
          MAY 2011 ~ TOTAL VOLUME ~ 5,015,980


          04/29/11	2.24	3.00	2.05	2.78	417,170	     62.7%/20,100 t trades
          04/28/11	1.96	2.25	1.94	2.25	174,529	     55.6%/11,290 t trades
          04/27/11	1.57	2.05	1.55	1.92	392,824	     50.4%/18,293 t trades
          04/26/11	1.59	1.64	1.52	1.61	285,316	     41%
          04/25/11	1.87	1.87	1.68	1.68	286,864	     43.7%/2,000 t trades
          04/21/11	1.22	1.84	1.05    1.84	736,234	     34%
          04/20/11	1.96	2.08	1.17	1.26	949,402	     22.5%
          04/19/11	2.15	2.15	2.00	2.14	171,325	     32.3%
          04/18/11	2.05	2.17	2.05	2.14	131,592	     45.5%
          04/15/11	2.20	2.25	2.00	2.17	234,742	     42.2%
          04/14/11	2.10	2.32	1.90	2.25	375,545      38.6%
          04/13/11	2.21	2.38	1.88	2.30	692,446	     57.8%
          04/12/11	1.80	2.12	1.78	2.12	686,209	     67%
          04/11/11	1.40	1.93	1.30	1.75	907,578      39.6%
          04/08/11	1.10	1.24	1.04	1.24	220,368	     66.7%
          04/07/11	1.05	1.14	0.96	1.11	160,793	     61.9%
          04/06/11	1.01	1.10	0.98	1.05	155,038	     31.5%
          04/05/11	1.07	1.07	0.95	1.00	322,332	     34.3%
          04/04/11	0.88	1.13	0.85	1.04	658,574	     40.6%
          04/01/11	0.84	0.85	0.82	0.85	138,711	     45.1%

               REG SHO OVER 30% = 19 DAYS
       APR 2011 ~ TOTAL VOLUME ~ 8,093,592

          03/31/11	0.84	0.84	0.80	0.84	72,760	     40.7%
          03/30/11	0.81	0.81	0.791	0.805	14,350	     23.3%
          03/29/11	0.81	0.84	0.79	0.81	81,478	     26%
          03/28/11	0.84	0.84	0.81	0.81	48,597	     49.1%
          03/25/11	0.83	0.88	0.81	0.83	186,434	     47.2%
          03/24/11	0.795	0.83	0.79	0.83	38,680	     61.7%
          03/23/11	0.81	0.82	0.80	0.80	40,232	     43.7%
          03/22/11	0.82	0.82	0.80	0.80	68,064	     47.5%
          03/21/11	0.83	0.83	0.80	0.82	44,155	     47%
          03/18/11	0.80	0.83	0.80	0.83	59,617	     55.5%
          03/17/11	0.80	0.835	0.79	0.81	118,087	     66.7%
          03/16/11	0.81	0.81	0.61	0.79	60,122	     52.4%
          03/15/11	0.80	0.80	0.78	0.80	38,055       36%
          03/14/11	0.79	0.80	0.77	0.80	48,539       59.5%
          03/11/11	0.785	0.81	0.78	0.80	29,897	     22.5%
          03/10/11	0.82	0.82	0.785	0.81	13,020	     1.6%
          03/09/11	0.83	0.83	0.7901	0.82	34,949       54.4%
          03/08/11	0.82	0.82	0.78	0.82	56,098	     67.3%
          03/07/11	0.84	0.84	0.78	0.82	20,800	     17.3%
          03/04/11	0.85	0.88	0.80	0.84	94,990	     83.4%
          03/03/11	0.80	0.82	0.79	0.82	7,565	     6.1%
          03/02/11	0.79	0.80	0.78	0.80	18,076	     16%
          03/01/11	0.80	0.81	0.80	0.80	41,727       15.7%

                  REG SHO OVER 30% = 15 DAYS
       MAR 2011 ~ TOTAL VOLUME TRADED ~ 1,236,292


          02/28/11	0.80	0.82	0.80	0.81	33,239	     31%
          02/25/11	0.79	0.835	0.79	0.81	31,909	     28.2%
          02/24/11	0.817	0.835	0.80	0.80	18,058	     54.1%
          02/23/11	0.84	0.84	0.79	0.816	52,489	     62.1%
          02/22/11	0.87	0.8799	0.815	0.84	46,077	     2.6%
          02/18/11	0.82	0.88	0.80	0.87	35,687	     7%
          02/17/11	0.864	0.864	0.80	0.86	69,191       23.2%
          02/16/11	0.86	0.864	0.828	0.864	39,375	     35.3%
          02/15/11	0.885	0.885	0.82	0.855	41,250       65.3%
          02/14/11	0.84	0.85	0.79	0.82	60,817	     22.3%
          02/11/11	0.77	0.8788	0.77	0.85	47,806	     29%
          02/10/11	0.824	0.888	0.77	0.8388	77,249	     29.3%
          02/09/11	0.76	0.8498	0.76	0.77	117,105	     40.1%
          02/08/11	0.78	0.82	0.72	0.76	87,250	     24.1%
          02/07/11	0.80	0.888	0.76	0.80	36,205	     59.3%
          02/04/11	0.87	0.87	0.80	0.85	93,475	     23.3%
          02/03/11	0.895	0.90	0.845	0.8799	109,875	     53.7%
          02/02/11	0.92	0.94	0.87	0.88	225,396	     17.7%
          02/01/11	0.83	0.87	0.8031	0.87	99,279	     29.2%

                   REG SHO OVER 30% = 8 DAYS
       FEB 2011 ~ TOTAL VOLUME TRADED ~ 1,321,732


          01/31/11	0.82	0.83	0.80	0.83	53,733	     35.7%
          01/28/11	0.81	0.82	0.785	0.82	161,153	     52%
          01/27/11	0.815	0.83	0.80	0.81	22,610	     79.3%
          01/26/11	0.82	0.83	0.78	0.82	37,543	     ===
          01/25/11	0.80	0.82	0.791	0.82	108,230	     28.2%
          01/24/11	0.815	0.815	0.775	0.80	61,130	     40.6%
          01/21/11	0.794	0.82	0.771	0.815	78,942	     30%
          01/20/11	0.79	0.80	0.77	0.795	132,149	     18.5%
          01/19/11	0.77	0.79	0.761	0.79	100,943	     33.5%
          01/18/11	0.75	0.79	0.72	0.77	153,578      30.8%
          01/14/11	0.68	0.75	0.68	0.75	89,264	     71.2%
          01/13/11	0.79	0.79	0.66	0.68	102,498	     32.2%
          01/12/11	0.69	0.69	0.66	0.675	45,961	     24.5%
          01/11/11	0.74	0.74	0.662	0.69	91,237	     54.7%
          01/10/11	0.80	0.80	0.70	0.7399	48,062       44.3%
          01/07/11	0.74	0.74	0.70	0.719	89,455	     10.2%
          01/06/11	0.70	0.77	0.70	0.74	109,155	     28.6%
          01/05/11	0.77	0.80	0.71	0.73	64,338	     22.6%
          01/04/11	0.67	0.75	0.67	0.71	85,065       25.4%
          01/03/11	0.65	0.67	0.65	0.67	96,008       12.2%

                   REG SHO OVER 30% = 11 DAYS
       JAN 2011 ~ TOTAL VOLUME TRADED ~ 1,731,054


          12/31/10	0.57	0.66	0.54	0.65	325,552      22.7%
          12/30/10	0.60	0.60	0.55	0.56	225,954	     30.3%
          12/29/10	0.60	0.60	0.54	0.58	219,868	     23.4%
          12/28/10	0.615	0.65	0.585	0.60	219,392	      9.2%
          12/27/10	0.70	0.70	0.605	0.69	112,852	      3.2%
          12/23/10	0.8475	0.895	0.65	0.70	356,969      33.3%
          12/22/10	0.83	0.86	0.79	0.85	279,657	     37.8%
          12/21/10	0.86	0.86	0.77	0.7711	301,917      29.6%
          12/20/10	0.89	0.89	0.76	0.76	184,651      34.7%
          12/17/10	0.94	1.01	0.77	0.83	473,413      28.5%
          12/16/10	0.86	1.35	0.78	0.92	1,546,137    33.3%
          12/15/10	0.52	0.77	0.51	0.77	895,815      32.0%

      DEC 2010 ~ TOTAL VOLUME TRADED ~ 6,242,313 shares
==
4kids
all jmo
EXPH SHAREHOLDER NOTE:
i'll be more than happy to post the FACTS
specific to exph's volume .. which include
every trade done on the stock and reported
to FINRA .. via the MMs' each and every month
the co. diluted 2.3 BILLION shares from march 2010
to feb 3rd 2011 .. it is fact and noted by the co.
as to exactly why it was done .. and explained on
their website <shareholders' section> as well as
via the NV SOS and of course those of us who did
actually call the co.s TA *daily* .. and kept records
of when certs were *issued* specific to each and
every day from march 24th 2010 to feb 3rd 2011
what is remarkably revealing is that the volume
done when the float was 100M <2009> was on avg 40M
today with a float of approx 1 BILLION the avg volume
runs 4M shares
which clearly confirms aspects known to those who've
done *excellent* DD .. exph shares are scarcer than
hens' teeth and are held tightly and some of those certs
have never been deposited in any brokerage acct which of
course explains *some* clearing firms BS specific to exph
regardless the true issue is two fold ..
first the co. didn't shutter their doors like so many others
did b4 them who *underwent* the same *particular* brand of attn
that presents the real issue
which of course is the money involved that the *abusive* shorts
will have to *reconcile* .. even if only a fraction <percentage
wise> is *addressed*
it's also clear that expo holdings has competitors who would
welcome the co.s demise ~
sorry abusive shorts and *slimy competition* .. it's not happening
==
4kids
all jmo
SHORTS and EXPH >>> of exph shares shorted <if> covered at:
===
it's very clear why the SHORTS IN EXPH have ANGST
it's $$$$$$$$$$$$$$$$$$$$$$$$$$$$$$$$$$$$$$$$$$$$
and lots of it .. to even cover ~ 30 percent of the
100s of MILLIONS of shares shorted that have NEVER BEEN COVERED
is volume that equates to 600M shares X 2 <buy/sell>
or a 1.2 BILLION SHARE DAY in vol .. <or 2 back to back days>
and to put that in perspective dollar wise ..
that translates out to the following <both dollar amount and exph's pps>
@ .0009 pps it's $1 MILLION DOLLARS
@ .0016 pps it's $2 MILLION DOLLARS
@ .0033 pps it's $4 MILLION DOLLARS
@ .0083 pps it's $10 MILLION DOLLARS
@ .0160 pps it's $20 MILLION DOLLARS
@ .0250 pps it's $30 MILLION DOLLARS
@ .0410 pps it's $50 MILLION DOLLARS
let me reiterate
that is just a 30 percent cover of what has been shorted since nov 2010 ..
that is shares @ .0002/.0001
i haven't even bothered with the shares done at .0004
this is why i've tracked every trade .. and ironically the info
actually exists in this very venue .. when the drill is understood
the shake for shares isn't successful
it's just one of the reasons why i don't have one GTC set
below .01
the other is the EXPH FLOAT .. which imo is approx 1 BILLION
to put that in perspective and why i pieced together *bits*
~ the FLOAT in 2009 was *estimated* by mgmt on the CC @ 100M
those were the days of the 40M *avg* vol in exph <tapes exist>
today the avg vol runs 4M .. with the last volume day *coincidentally*
being the 31st of may <15M+> .. of course the *coincidence* was that
the 31st *closed* out the month for the brokerage statements
there are no coincidences *regarding* this issue .. NOT ONE
think about it ~
==
4kids
all jmo
EXPH .. trading stats .. week ending 5/20/2011 here are some interesting facts re: exph in 2011
AS last increased on 2/1/2011
shares issued via TA last on 2/3/2011
less than 114M shares took out the .0002s on ask
less than 44M shares took out the .0003s on ask <.0003s touched for the
first time in 2011 on 4/25/2011 tape of trades
approx 20M has *traded* at .0004 in 2011 <first day traded at .0004
is on 4/26/2011 tape of trades
EXPO's MGMT has released 3 PR's in 2011 <early feb early apr and early may>
and 5 in total since sept 2010 ~ that is NINE MONTHS for 5 PR'S
on monday may 9th .. finra's reg 6460 kicked in showing limit orders
on both bid and ask via *respective* MMs' .. since monday what has
shown on bid at .0002 is over 200M .. what has shown on ask at .0003
is approx 20M ..
oh and have to love a CONTROLLED STOCK .. i look forward
to the catalyst *breaking* the control on exph :)
Date Open High Low Close Volume SHORT %
05/20/11 0.0003 0.0003 0.0002 0.0003 13,130,000 43%
05/19/11 0.0003 0.0003 0.0003 0.0003 3,000,000 100%
05/18/11 0.0003 0.0003 0.0002 0.0003 4,175,000 71.8%
05/17/11 0.0002 0.0003 0.0002 0.0003 301,000 ===
05/16/11 0.0003 0.0003 0.0002 0.0003 9,049,966 44.1%
05/13/11 0.0002 0.0003 0.0002 0.0003 1,063,160 94%
05/12/11 0.0003 0.0004 0.0002 0.0003 3,290,999 57.7%
05/11/11 0.0003 0.0004 0.0003 0.0004 6,106,366 87.4%
05/10/11 0.0004 0.0004 0.0003 0.0003 2,400,000 33.3%
05/09/11 0.0003 0.0003 0.0003 0.0003 28,977,774 91.2%
05/06/11 0.0003 0.0003 0.0002 0.0003 60,908,104 28%
05/05/11 0.0004 0.0004 0.0003 0.0003 10,643,330 7%
05/04/11 0.0003 0.0004 0.0003 0.0003 5,550,000 20.2%
05/03/11 0.0003 0.0004 0.0003 0.0004 70,776,215 63.1%
05/02/11 0.0002 0.0003 0.0002 0.0003 59,121,639 57.9%
SO FAR ~
exph closes *even* = 11 DAYS
exph closes *up* = 2 DAYS
exph closes *down* = 2 DAYS
MAY 2011 ~ current volume = 278,493,553
04/29/11 0.0003 0.0003 0.0002 0.0003 41,254,496 87%
04/28/11 0.0004 0.0004 0.0002 0.0003 57,469,582 17%
04/27/11 0.0003 0.0004 0.0002 0.0004 70,204,384 45.4%
04/26/11 0.0002 0.0004 0.0002 0.0004 67,272,459 70%
04/25/11 0.0002 0.0003 0.0002 0.0002 129,550,931 85.4%
04/21/11 0.0001 0.0002 0.0001 0.0002 35,905,000 98%
04/20/11 0.0001 0.0001 0.0001 0.0001 530,000 ===
04/19/11 0.0001 0.0002 0.0001 0.0001 3,631,555 82.6%
04/18/11 0.0000 0.0000 0.0000 0.0000 ========= ===
04/15/11 0.0002 0.0002 0.0002 0.0002 4,875,000 100%
04/14/11 0.0002 0.0002 0.0002 0.0002 5,000,000 100%
04/13/11 0.0002 0.0002 0.0002 0.0002 320,000 ===
04/12/11 0.0001 0.0002 0.0001 0.0002 13,139,323 7.6% (1 trade @ .0002 reg sho)
04/11/11 0.0002 0.0002 0.0002 0.0002 2,000,000 100%
04/08/11 0.0002 0.0002 0.0002 0.0002 911 100%
04/06/11 0.0002 0.0002 0.0001 0.0001 21,699,990 32.2% (7M trade at .0002 reg sho)
04/05/11 0.0001 0.0001 0.0001 0.0001 1,347,556 ===
04/04/11 0.0001 0.0002 0.0001 0.0002 7,736,443 ===
04/01/11 0.0001 0.0002 0.0001 0.0002 6,000 ===
APR 2011 ~ 18 days traded ~ TOTAL VOLUME ~ 461,943,630
exph closes *even* ~ 12 days
exph closes *up* ~ 3 days
exph closes *down* ~ 3 days
03/31/11 0.0002 0.0002 0.0002 0.0002 280,000 ===
03/30/11 0.0001 0.0002 0.0001 0.0001 77,582,580 30.3%
03/29/11 0.0001 0.0001 0.0001 0.0001 6,306,189 ===
03/28/11 0.0002 0.0002 0.0001 0.0001 1,001,690 ===
03/25/11 0.0001 0.0001 0.0001 0.0001 3,000,000 ===
03/24/11 0.0001 0.0002 0.0001 0.0001 12,378,815 71.6%
03/23/11 0.0001 0.0001 0.0001 0.0001 1,189,999 ===
03/22/11 0.0001 0.0001 0.0001 0.0001 121,018 ===
03/21/11 0.0001 0.0002 0.0001 0.0002 2,807,004 78.4% (both trades @ .0002 reg sho)
03/18/11 0.0001 0.0002 0.0001 0.0002 2,486,999 ===
03/17/11 0.0001 0.0002 0.0001 0.0002 500,970 === (850 shares @ .0002 reg sho)
03/16/11 0.0002 0.0002 0.0001 0.0001 2,921,965 99.9% (only trade @ .0002 reg sho)
03/15/11 0.0001 0.0002 0.0001 0.0002 12,500,200 47.5%
03/14/11 0.0002 0.0002 0.0001 0.0001 18,490,598 67.5%
03/11/11 0.0001 0.0002 0.0001 0.0002 3,945,405 ===
03/10/11 0.0001 0.0002 0.0001 0.0001 17,164,654 13.8% (only trade @ .0002 reg sho)
03/09/11 0.0001 0.0002 0.0001 0.0001 2,010,100 99.4% (1 trade @ .0002 reg sho)
03/08/11 0.0002 0.0002 0.0001 0.0001 8,250,850 97.5% (3 trades @ .0002 reg sho)
03/07/11 0.0002 0.0002 0.0002 0.0002 1,000,000 ===
03/04/11 0.0001 0.0001 0.0001 0.0001 4,607,400 === (RS .. BID BACK on exph .. zero trades reg sho)
03/03/11 0.0001 0.0002 0.0001 0.0002 5,145,750 === (RS .. BID BACK on exph .. zero trades reg sho)
03/02/11 0.0001 0.0001 0.0001 0.0001 8,647,100 === (RS .. BID BACK on exph .. zero trades reg sho)
03/01/11 0.0001 0.0002 0.0001 0.0002 11,749,660 === (RS .. BID BACK on exph .. zero trades reg sho)
MAR 2011 ~ 23 days traded ~ TOTAL VOLUME ~ 204,088,946
exph closes *even* ~ 10 days
exph closes *up* ~ 7 days
exph closes *down* ~ 6 days
=====================================================
EXPH OCT 2010 - APR 2011 ~ OS & AS INFO
OCTOBER 21, 2010 ~ 1.973.987.656 (AS = 2B)
OCTOBER 22, 2010 ~ 2.047.945.311 (AS = 2.050B)
NOVEMBER 03, 2010 ~ 2.047.945.311 (AS = 2.050B)
NOVEMBER 04, 2010 ~ 2.189.048.732 (AS = 2.2B)
NOVEMBER 16, 2010 ~ 2.189.048.732 (AS = 2.2B)
NOVEMBER 17, 2010 ~ 2.355.715.398 (AS = 2.4B)
NOVEMBER 26, 2010 ~ 2.355.715.398 (AS = 2.4B)
NOVEMBER 29, 2010 ~ 2.355.715.398 (AS NV 2.560 TA 2.4B)
DECEMBER 03, 2010 ~ 2.355.715.398 (AS NV 2.560 TA 2.4B)
DECEMBER 07, 2010 ~ 2.355.715.398 (AS NV 2.560 TA 2.4B)
DECEMBER 08, 2010 ~ 2.556.802.354 (AS 2.560)
DECEMBER 10, 2010 ~ 2.556.802.354 (AS 2.560)
DECEMBER 15, 2010 ~ 2.556.802.354 (AS 2.560)
DECEMBER 16, 2010 ~ 2.779.024.576 (AS 2.8B)
DECEMBER 22, 2010 ~ 2.779.024.576 (AS 2.8B)
DECEMBER 28, 2010 ~ 2.779.024.576 (AS NV 3.1B TA 2.8B)
DECEMBER 31, 2010 ~ 2.779.024.576 (AS NV 3.1B TA 2.8B)
JANUARY 07, 2011 ~ 2.779.024.576 (AS NV 3.1B TA 2.8B)
JANUARY 10, 2011 ~ 2.779.024.576 (AS NV 3.1B TA 2.8B)
JANUARY 11, 2011 ~ 3.052.997.178 (AS 3.1B)
JANUARY 12, 2011 ~ 3.052.997.178 (AS 3.1B)
JANUARY 13, 2011 ~ 3.052.997.178 (AS 3.1B)
JANUARY 21, 2011 ~ 3.052.997.178 (AS 3.1B)
FEBRUARY 01, 2011 ~ 3.053.997.178 (AS NV 3.33B TA 3.1B)
FEBRUARY 02, 2011 ~ 3.053.997.178 (AS NV 3.33B TA 3.1B)
FEBRUARY 03, 2011 ~ 3.325.724.450 (AS 3.33B)
FEBRUARY 07, 2011 ~ 3.325.724.450 (AS 3.33B)
FEBRUARY 11, 2011 ~ 3.325.724.450 (AS 3.33B)
FEBRUARY 18, 2011 ~ 3.325.724.450 (AS 3.33B)
FEBRUARY 25, 2011 ~ 3.325.724.450 (AS 3.33B)
MARCH 04, 2011 ~ 3.325.724.450 (AS 3.33B)
MARCH 18, 2011 ~ 3.325.724.450 (AS 3.33B)
APRIL 01, 2011 ~ 3.325.724.450 (AS 3.33B)
APRIL 15, 2011 ~ 3.325.724.450 (AS 3.33B)
APRIL 21, 2011 ~ 3.325.724.450 (AS 3.33B)
MAY 02, 2011 ~ 3.325.724.450 (AS 3.33B)
MAY 13, 2011 ~ 3.325.724.450 (AS 3.33B)
============================================================
and one last bit of data .. epxh's closing pps/volume from
9/30/2009 ~ 04/29/2011 or how a stock gets cellar boxed
*regardless* of .. er .. volume :0
Date Open High Low Close Volume
04/29/11 0.0003 0.0003 0.0002 0.0003 41,254,496
03/31/11 0.0002 0.0002 0.0002 0.0002 280,000
02/28/11 0.0001 0.0001 0.0001 0.0001 1,200,240
01/31/11 0.0001 0.0002 0.0001 0.0001 2,446,000
12/31/10 0.0001 0.0002 0.0001 0.0002 9,560,295
11/30/10 0.0002 0.0002 0.0001 0.0002 20,434,477
10/29/10 0.0004 0.0006 0.0004 0.0006 30,848,954
09/30/10 0.0006 0.0008 0.0006 0.0008 19,117,500
08/31/10 0.0017 0.0019 0.0015 0.0018 17,006,717
07/30/10 0.0005 0.0005 0.0004 0.0005 22,767,174
06/30/10 0.0005 0.0005 0.0004 0.0005 19,336,500
05/28/10 0.0006 0.0007 0.0005 0.0006 7,963,785
04/30/10 0.001 0.0011 0.0009 0.001 67,856,017
03/31/10 0.0012 0.0012 0.001 0.0012 9,820,090
02/26/10 0.0022 0.0026 0.002 0.0026 2,671,150
01/29/10 0.0029 0.0031 0.0028 0.0029 2,823,606
12/31/09 0.004 0.004 0.0035 0.0035 2,678,990
11/30/09 0.0073 0.0074 0.0069 0.0072 4,771,260
10/30/09 0.0067 0.0082 0.0066 0.0078 28,627,473
09/30/09 0.01 0.0104 0.0095 0.0098 26,320,045
link back for prior month's trading stats
===
4kids
all jmo
JBII .. trading stats .. week ending ..5/20/2011 Date Open High Low Close Volume SHORT %
05/20/11 3.46 3.46 3.10 3.34 163,141 43.7%/3,500 t trades
05/19/11 3.25 3.49 3.20 3.35 103,917 50.4%
05/18/11 3.07 3.38 3.07 3.20 145,329 63.1%/1,500 t trades
05/17/11 2.90 3.10 2.80 3.00 86,112 57.6%
05/16/11 3.00 3.15 2.77 2.91 166,856 18.5%
05/13/11 3.25 3.45 3.03 3.08 196,827 26.6%
05/12/11 3.05 3.57 3.04 3.25 235,203 42.5%/2,000 t trades
05/11/11 3.20 3.45 3.20 3.27 143,359 36.3%/2,500 t trades
05/10/11 3.97 3.98 3.16 3.50 491,161 29.2%/3,500 t trades
05/09/11 3.30 3.96 3.26 3.95 907,083 46.4%/1,968 t trades
05/06/11 2.74 3.06 2.62 3.00 264,058 50.7%
05/05/11 2.95 2.95 2.76 2.81 152,416 31.5%
05/04/11 3.27 3.30 2.71 3.00 306,008 38.3%/1,500 t trades
05/03/11 3.25 3.50 3.13 3.30 351,938 43.1%/10,200 t trades
05/02/11 2.88 3.50 2.88 3.12 531,247 39.1%
REG SHO over 30 days = 12 DAYS
MAY 2011 ~ volume currently traded ~ 4,244,655
04/29/11 2.24 3.00 2.05 2.78 417,170 62.7%/20,100 t trades
04/28/11 1.96 2.25 1.94 2.25 174,529 55.6%/11,290 t trades
04/27/11 1.57 2.05 1.55 1.92 392,824 50.4%/18,293 t trades
04/26/11 1.59 1.64 1.52 1.61 285,316 41%
04/25/11 1.87 1.87 1.68 1.68 286,864 43.7%/2k t trades
04/21/11 1.22 1.84 1.05 1.84 736,234 34%
04/20/11 1.96 2.08 1.17 1.26 949,402 22.5%
04/19/11 2.15 2.15 2.00 2.14 171,325 32.3%
04/18/11 2.05 2.17 2.05 2.14 131,592 45.5%
04/15/11 2.20 2.25 2.00 2.17 234,742 42.2%
04/14/11 2.10 2.32 1.90 2.25 375,545 38.6%
04/13/11 2.21 2.38 1.88 2.30 692,446 57.8%
04/12/11 1.80 2.12 1.78 2.12 686,209 67%
04/11/11 1.40 1.93 1.30 1.75 907,578 39.6%
04/08/11 1.10 1.24 1.04 1.24 220,368 66.7%
04/07/11 1.05 1.14 0.96 1.11 160,793 61.9%
04/06/11 1.01 1.10 0.98 1.05 155,038 31.5%
04/05/11 1.07 1.07 0.95 1.00 322,332 34.3%
04/04/11 0.88 1.13 0.85 1.04 658,574 40.6%
04/01/11 0.84 0.85 0.82 0.85 138,711 45.1%
REG SHO OVER 30% = 19 DAYS
APR 2011 TOTAL VOLUME ~ 8,093,592
03/31/11 0.84 0.84 0.80 0.84 72,760 40.7%
03/30/11 0.81 0.81 0.791 0.805 14,350 23.3%
03/29/11 0.81 0.84 0.79 0.81 81,478 26%
03/28/11 0.84 0.84 0.81 0.81 48,597 49.1%
03/25/11 0.83 0.88 0.81 0.83 186,434 47.2%
03/24/11 0.795 0.83 0.79 0.83 38,680 61.7%
03/23/11 0.81 0.82 0.80 0.80 40,232 43.7%
03/22/11 0.82 0.82 0.80 0.80 68,064 47.5%
03/21/11 0.83 0.83 0.80 0.82 44,155 47%
03/18/11 0.80 0.83 0.80 0.83 59,617 55.5%
03/17/11 0.80 0.835 0.79 0.81 118,087 66.7%
03/16/11 0.81 0.81 0.61 0.79 60,122 52.4%
03/15/11 0.80 0.80 0.78 0.80 38,055 36%
03/14/11 0.79 0.80 0.77 0.80 48,539 59.5%
03/11/11 0.785 0.81 0.78 0.80 29,897 22.5%
03/10/11 0.82 0.82 0.785 0.81 13,020 1.6%
03/09/11 0.83 0.83 0.7901 0.82 34,949 54.4%
03/08/11 0.82 0.82 0.78 0.82 56,098 67.3%
03/07/11 0.84 0.84 0.78 0.82 20,800 17.3%
03/04/11 0.85 0.88 0.80 0.84 94,990 83.4%
03/03/11 0.80 0.82 0.79 0.82 7,565 6.1%
03/02/11 0.79 0.80 0.78 0.80 18,076 16%
03/01/11 0.80 0.81 0.80 0.80 41,727 15.7%
REG SHO OVER 30% = 15 DAYS
MAR 2011 ~ TOTAL VOLUME TRADED ~ 1,236,292
02/28/11 0.80 0.82 0.80 0.81 33,239 31%
02/25/11 0.79 0.835 0.79 0.81 31,909 28.2%
02/24/11 0.817 0.835 0.80 0.80 18,058 54.1%
02/23/11 0.84 0.84 0.79 0.816 52,489 62.1%
02/22/11 0.87 0.8799 0.815 0.84 46,077 2.6%
02/18/11 0.82 0.88 0.80 0.87 35,687 7%
02/17/11 0.864 0.864 0.80 0.86 69,191 23.2%
02/16/11 0.86 0.864 0.828 0.864 39,375 35.3%
02/15/11 0.885 0.885 0.82 0.855 41,250 65.3%
02/14/11 0.84 0.85 0.79 0.82 60,817 22.3%
02/11/11 0.77 0.8788 0.77 0.85 47,806 29%
02/10/11 0.824 0.888 0.77 0.8388 77,249 29.3%
02/09/11 0.76 0.8498 0.76 0.77 117,105 40.1%
02/08/11 0.78 0.82 0.72 0.76 87,250 24.1%
02/07/11 0.80 0.888 0.76 0.80 36,205 59.3%
02/04/11 0.87 0.87 0.80 0.85 93,475 23.3%
02/03/11 0.895 0.90 0.845 0.8799 109,875 53.7%
02/02/11 0.92 0.94 0.87 0.88 225,396 17.7%
02/01/11 0.83 0.87 0.8031 0.87 99,279 29.2%
REG SHO OVER 30% = 8 DAYS
FEB 2011 ~ TOTAL VOLUME TRADED ~ 1,321,732
01/31/11 0.82 0.83 0.80 0.83 53,733 35.7%
01/28/11 0.81 0.82 0.785 0.82 161,153 52%
01/27/11 0.815 0.83 0.80 0.81 22,610 79.3%
01/26/11 0.82 0.83 0.78 0.82 37,543 ===
01/25/11 0.80 0.82 0.791 0.82 108,230 28.2%
01/24/11 0.815 0.815 0.775 0.80 61,130 40.6%
01/21/11 0.794 0.82 0.771 0.815 78,942 30%
01/20/11 0.79 0.80 0.77 0.795 132,149 18.5%
01/19/11 0.77 0.79 0.761 0.79 100,943 33.5%
01/18/11 0.75 0.79 0.72 0.77 153,578 30.8%
01/14/11 0.68 0.75 0.68 0.75 89,264 71.2%
01/13/11 0.79 0.79 0.66 0.68 102,498 32.2%
01/12/11 0.69 0.69 0.66 0.675 45,961 24.5%
01/11/11 0.74 0.74 0.662 0.69 91,237 54.7%
01/10/11 0.80 0.80 0.70 0.7399 48,062 44.3%
01/07/11 0.74 0.74 0.70 0.719 89,455 10.2%
01/06/11 0.70 0.77 0.70 0.74 109,155 28.6%
01/05/11 0.77 0.80 0.71 0.73 64,338 22.6%
01/04/11 0.67 0.75 0.67 0.71 85,065 25.4%
01/03/11 0.65 0.67 0.65 0.67 96,008 12.2%
REG SHO OVER 30% = 11 DAYS
JAN 2011 ~ TOTAL VOLUME TRADED ~ 1,731,054
12/31/10 0.57 0.66 0.54 0.65 325,552 22.7%
12/30/10 0.60 0.60 0.55 0.56 225,954 30.3%
12/29/10 0.60 0.60 0.54 0.58 219,868 23.4%
12/28/10 0.615 0.65 0.585 0.60 219,392 9.2%
12/27/10 0.70 0.70 0.605 0.69 112,852 3.2%
12/23/10 0.8475 0.895 0.65 0.70 356,969 33.3%
12/22/10 0.83 0.86 0.79 0.85 279,657 37.8%
12/21/10 0.86 0.86 0.77 0.7711 301,917 29.6%
12/20/10 0.89 0.89 0.76 0.76 184,651 34.7%
12/17/10 0.94 1.01 0.77 0.83 473,413 28.5%
12/16/10 0.86 1.35 0.78 0.92 1,546,137 33.3%
12/15/10 0.52 0.77 0.51 0.77 895,815 32.0%
DEC 2010 ~ TOTAL VOLUME TRADED ~ 6,242,313 shares
==
4kids
all jmo
JBII .. trading stats .. week ending ..5/13/2011 Date Open High Low Close Volume SHORT %
05/13/11 3.25 3.45 3.03 3.08 196,827 26.6%
05/12/11 3.05 3.57 3.04 3.25 235,203 42.5%/2,000 t trades
05/11/11 3.20 3.45 3.20 3.27 143,359 36.3%/2,500 t trades
05/10/11 3.97 3.98 3.16 3.50 491,161 29.2%/3,500 t trades
05/09/11 3.30 3.96 3.26 3.95 907,083 46.4%/1,968 t trades
05/06/11 2.74 3.06 2.62 3.00 264,058 50.7%
05/05/11 2.95 2.95 2.76 2.81 152,416 31.5%
05/04/11 3.27 3.30 2.71 3.00 306,008 38.3%/1,500 t trades
05/03/11 3.25 3.50 3.13 3.30 351,938 43.1%/10,200 t trades
05/02/11 2.88 3.50 2.88 3.12 531,247 39.1%
MAY 2011 ~ volume currently traded ~ 3,579,300
04/29/11 2.24 3.00 2.05 2.78 417,170 62.7%/20,100 t trades
04/28/11 1.96 2.25 1.94 2.25 174,529 55.6%/11,290 t trades
04/27/11 1.57 2.05 1.55 1.92 392,824 50.4%/18,293 t trades
04/26/11 1.59 1.64 1.52 1.61 285,316 41%
04/25/11 1.87 1.87 1.68 1.68 286,864 43.7%/2k t trades
04/21/11 1.22 1.84 1.05 1.84 736,234 34%
04/20/11 1.96 2.08 1.17 1.26 949,402 22.5%
04/19/11 2.15 2.15 2.00 2.14 171,325 32.3%
04/18/11 2.05 2.17 2.05 2.14 131,592 45.5%
04/15/11 2.20 2.25 2.00 2.17 234,742 42.2%
04/14/11 2.10 2.32 1.90 2.25 375,545 38.6%
04/13/11 2.21 2.38 1.88 2.30 692,446 57.8%
04/12/11 1.80 2.12 1.78 2.12 686,209 67%
04/11/11 1.40 1.93 1.30 1.75 907,578 39.6%
04/08/11 1.10 1.24 1.04 1.24 220,368 66.7%
04/07/11 1.05 1.14 0.96 1.11 160,793 61.9%
04/06/11 1.01 1.10 0.98 1.05 155,038 31.5%
04/05/11 1.07 1.07 0.95 1.00 322,332 34.3%
04/04/11 0.88 1.13 0.85 1.04 658,574 40.6%
04/01/11 0.84 0.85 0.82 0.85 138,711 45.1%
REG SHO OVER 30% = 19 DAYS
APR 2011 TOTAL VOLUME ~ 8,093,592
03/31/11 0.84 0.84 0.80 0.84 72,760 40.7%
03/30/11 0.81 0.81 0.791 0.805 14,350 23.3%
03/29/11 0.81 0.84 0.79 0.81 81,478 26%
03/28/11 0.84 0.84 0.81 0.81 48,597 49.1%
03/25/11 0.83 0.88 0.81 0.83 186,434 47.2%
03/24/11 0.795 0.83 0.79 0.83 38,680 61.7%
03/23/11 0.81 0.82 0.80 0.80 40,232 43.7%
03/22/11 0.82 0.82 0.80 0.80 68,064 47.5%
03/21/11 0.83 0.83 0.80 0.82 44,155 47%
03/18/11 0.80 0.83 0.80 0.83 59,617 55.5%
03/17/11 0.80 0.835 0.79 0.81 118,087 66.7%
03/16/11 0.81 0.81 0.61 0.79 60,122 52.4%
03/15/11 0.80 0.80 0.78 0.80 38,055 36%
03/14/11 0.79 0.80 0.77 0.80 48,539 59.5%
03/11/11 0.785 0.81 0.78 0.80 29,897 22.5%
03/10/11 0.82 0.82 0.785 0.81 13,020 1.6%
03/09/11 0.83 0.83 0.7901 0.82 34,949 54.4%
03/08/11 0.82 0.82 0.78 0.82 56,098 67.3%
03/07/11 0.84 0.84 0.78 0.82 20,800 17.3%
03/04/11 0.85 0.88 0.80 0.84 94,990 83.4%
03/03/11 0.80 0.82 0.79 0.82 7,565 6.1%
03/02/11 0.79 0.80 0.78 0.80 18,076 16%
03/01/11 0.80 0.81 0.80 0.80 41,727 15.7%
REG SHO OVER 30% = 15 DAYS
MAR 2011 ~ TOTAL VOLUME TRADED ~ 1,236,292
02/28/11 0.80 0.82 0.80 0.81 33,239 31%
02/25/11 0.79 0.835 0.79 0.81 31,909 28.2%
02/24/11 0.817 0.835 0.80 0.80 18,058 54.1%
02/23/11 0.84 0.84 0.79 0.816 52,489 62.1%
02/22/11 0.87 0.8799 0.815 0.84 46,077 2.6%
02/18/11 0.82 0.88 0.80 0.87 35,687 7%
02/17/11 0.864 0.864 0.80 0.86 69,191 23.2%
02/16/11 0.86 0.864 0.828 0.864 39,375 35.3%
02/15/11 0.885 0.885 0.82 0.855 41,250 65.3%
02/14/11 0.84 0.85 0.79 0.82 60,817 22.3%
02/11/11 0.77 0.8788 0.77 0.85 47,806 29%
02/10/11 0.824 0.888 0.77 0.8388 77,249 29.3%
02/09/11 0.76 0.8498 0.76 0.77 117,105 40.1%
02/08/11 0.78 0.82 0.72 0.76 87,250 24.1%
02/07/11 0.80 0.888 0.76 0.80 36,205 59.3%
02/04/11 0.87 0.87 0.80 0.85 93,475 23.3%
02/03/11 0.895 0.90 0.845 0.8799 109,875 53.7%
02/02/11 0.92 0.94 0.87 0.88 225,396 17.7%
02/01/11 0.83 0.87 0.8031 0.87 99,279 29.2%
REG SHO OVER 30% = 8 DAYS
FEB 2011 ~ TOTAL VOLUME TRADED ~ 1,321,732
01/31/11 0.82 0.83 0.80 0.83 53,733 35.7%
01/28/11 0.81 0.82 0.785 0.82 161,153 52%
01/27/11 0.815 0.83 0.80 0.81 22,610 79.3%
01/26/11 0.82 0.83 0.78 0.82 37,543 ===
01/25/11 0.80 0.82 0.791 0.82 108,230 28.2%
01/24/11 0.815 0.815 0.775 0.80 61,130 40.6%
01/21/11 0.794 0.82 0.771 0.815 78,942 30%
01/20/11 0.79 0.80 0.77 0.795 132,149 18.5%
01/19/11 0.77 0.79 0.761 0.79 100,943 33.5%
01/18/11 0.75 0.79 0.72 0.77 153,578 30.8%
01/14/11 0.68 0.75 0.68 0.75 89,264 71.2%
01/13/11 0.79 0.79 0.66 0.68 102,498 32.2%
01/12/11 0.69 0.69 0.66 0.675 45,961 24.5%
01/11/11 0.74 0.74 0.662 0.69 91,237 54.7%
01/10/11 0.80 0.80 0.70 0.7399 48,062 44.3%
01/07/11 0.74 0.74 0.70 0.719 89,455 10.2%
01/06/11 0.70 0.77 0.70 0.74 109,155 28.6%
01/05/11 0.77 0.80 0.71 0.73 64,338 22.6%
01/04/11 0.67 0.75 0.67 0.71 85,065 25.4%
01/03/11 0.65 0.67 0.65 0.67 96,008 12.2%
REG SHO OVER 30% = 11 DAYS
JAN 2011 ~ TOTAL VOLUME TRADED ~ 1,731,054
12/31/10 0.57 0.66 0.54 0.65 325,552 22.7%
12/30/10 0.60 0.60 0.55 0.56 225,954 30.3%
12/29/10 0.60 0.60 0.54 0.58 219,868 23.4%
12/28/10 0.615 0.65 0.585 0.60 219,392 9.2%
12/27/10 0.70 0.70 0.605 0.69 112,852 3.2%
12/23/10 0.8475 0.895 0.65 0.70 356,969 33.3%
12/22/10 0.83 0.86 0.79 0.85 279,657 37.8%
12/21/10 0.86 0.86 0.77 0.7711 301,917 29.6%
12/20/10 0.89 0.89 0.76 0.76 184,651 34.7%
12/17/10 0.94 1.01 0.77 0.83 473,413 28.5%
12/16/10 0.86 1.35 0.78 0.92 1,546,137 33.3%
12/15/10 0.52 0.77 0.51 0.77 895,815 32.0%
DEC 2010 ~ TOTAL VOLUME TRADED ~ 6,242,313 shares
==
4kids
all jmo
EXPH .. trading stats .. week ending 5/13/2011 here are some interesting facts re: exph in 2011
AS last increased on 2/1/2011
shares issued via TA last on 2/3/2011
less than 114M shares took out the .0002s on ask
less than 44M shares took out the .0003s on ask <.0003s touched for the
first time in 2011 on 4/25/2011 tape of trades
approx 20M has *traded* at .0004 in 2011 <first day traded at .0004
is on 4/26/2011 tape of trades
EXPO's MGMT has released 3 PR's in 2011 <early feb early apr and early may>
and 5 in total since sept 2010 ~ that is NINE MONTHS for 5 PR'S
on monday may 9th .. finra's reg 6460 kicked in showing limit orders
on both bid and ask via *respective* MMs' .. since monday what has
shown on bid at .0002 is over 200M .. what has shown on ask at .0003
is approx 20M ..
oh and have to love a CONTROLLED STOCK .. i look forward
to the catalyst *breaking* the control on exph :)
Date Open High Low Close Volume SHORT %
05/13/11 0.0002 0.0003 0.0002 0.0003 1,063,160 94%
05/12/11 0.0003 0.0004 0.0002 0.0003 3,290,999 57.7%
05/11/11 0.0003 0.0004 0.0003 0.0004 6,106,366 87.4%
05/10/11 0.0004 0.0004 0.0003 0.0003 2,400,000 33.3%
05/09/11 0.0003 0.0003 0.0003 0.0003 28,977,774 91.2%
05/06/11 0.0003 0.0003 0.0002 0.0003 60,908,104 28%
05/05/11 0.0004 0.0004 0.0003 0.0003 10,643,330 7%
05/04/11 0.0003 0.0004 0.0003 0.0003 5,550,000 20.2%
05/03/11 0.0003 0.0004 0.0003 0.0004 70,776,215 63.1%
05/02/11 0.0002 0.0003 0.0002 0.0003 59,121,639 57.9%
MAY 2011 ~ current volume = 248,837,587
04/29/11 0.0003 0.0003 0.0002 0.0003 41,254,496 87%
04/28/11 0.0004 0.0004 0.0002 0.0003 57,469,582 17%
04/27/11 0.0003 0.0004 0.0002 0.0004 70,204,384 45.4%
04/26/11 0.0002 0.0004 0.0002 0.0004 67,272,459 70%
04/25/11 0.0002 0.0003 0.0002 0.0002 129,550,931 85.4%
04/21/11 0.0001 0.0002 0.0001 0.0002 35,905,000 98%
04/20/11 0.0001 0.0001 0.0001 0.0001 530,000 ===
04/19/11 0.0001 0.0002 0.0001 0.0001 3,631,555 82.6%
04/18/11 0.0000 0.0000 0.0000 0.0000 ========= ===
04/15/11 0.0002 0.0002 0.0002 0.0002 4,875,000 100%
04/14/11 0.0002 0.0002 0.0002 0.0002 5,000,000 100%
04/13/11 0.0002 0.0002 0.0002 0.0002 320,000 ===
04/12/11 0.0001 0.0002 0.0001 0.0002 13,139,323 7.6% (1 trade @ .0002 reg sho)
04/11/11 0.0002 0.0002 0.0002 0.0002 2,000,000 100%
04/08/11 0.0002 0.0002 0.0002 0.0002 911 100%
04/06/11 0.0002 0.0002 0.0001 0.0001 21,699,990 32.2% (7M trade at .0002 reg sho)
04/05/11 0.0001 0.0001 0.0001 0.0001 1,347,556 ===
04/04/11 0.0001 0.0002 0.0001 0.0002 7,736,443 ===
04/01/11 0.0001 0.0002 0.0001 0.0002 6,000 ===
APR 2011 ~ 18 days traded ~ TOTAL VOLUME ~ 461,943,630
exph closes *even* ~ 12 days
exph closes *up* ~ 3 days
exph closes *down* ~ 3 days
03/31/11 0.0002 0.0002 0.0002 0.0002 280,000 ===
03/30/11 0.0001 0.0002 0.0001 0.0001 77,582,580 30.3%
03/29/11 0.0001 0.0001 0.0001 0.0001 6,306,189 ===
03/28/11 0.0002 0.0002 0.0001 0.0001 1,001,690 ===
03/25/11 0.0001 0.0001 0.0001 0.0001 3,000,000 ===
03/24/11 0.0001 0.0002 0.0001 0.0001 12,378,815 71.6%
03/23/11 0.0001 0.0001 0.0001 0.0001 1,189,999 ===
03/22/11 0.0001 0.0001 0.0001 0.0001 121,018 ===
03/21/11 0.0001 0.0002 0.0001 0.0002 2,807,004 78.4% (both trades @ .0002 reg sho)
03/18/11 0.0001 0.0002 0.0001 0.0002 2,486,999 ===
03/17/11 0.0001 0.0002 0.0001 0.0002 500,970 === (850 shares @ .0002 reg sho)
03/16/11 0.0002 0.0002 0.0001 0.0001 2,921,965 99.9% (only trade @ .0002 reg sho)
03/15/11 0.0001 0.0002 0.0001 0.0002 12,500,200 47.5%
03/14/11 0.0002 0.0002 0.0001 0.0001 18,490,598 67.5%
03/11/11 0.0001 0.0002 0.0001 0.0002 3,945,405 ===
03/10/11 0.0001 0.0002 0.0001 0.0001 17,164,654 13.8% (only trade @ .0002 reg sho)
03/09/11 0.0001 0.0002 0.0001 0.0001 2,010,100 99.4% (1 trade @ .0002 reg sho)
03/08/11 0.0002 0.0002 0.0001 0.0001 8,250,850 97.5% (3 trades @ .0002 reg sho)
03/07/11 0.0002 0.0002 0.0002 0.0002 1,000,000 ===
03/04/11 0.0001 0.0001 0.0001 0.0001 4,607,400 === (RS .. BID BACK on exph .. zero trades reg sho)
03/03/11 0.0001 0.0002 0.0001 0.0002 5,145,750 === (RS .. BID BACK on exph .. zero trades reg sho)
03/02/11 0.0001 0.0001 0.0001 0.0001 8,647,100 === (RS .. BID BACK on exph .. zero trades reg sho)
03/01/11 0.0001 0.0002 0.0001 0.0002 11,749,660 === (RS .. BID BACK on exph .. zero trades reg sho)
MAR 2011 ~ 23 days traded ~ TOTAL VOLUME ~ 204,088,946
exph closes *even* ~ 10 days
exph closes *up* ~ 7 days
exph closes *down* ~ 6 days
=====================================================
EXPH OCT 2010 - APR 2011 ~ OS & AS INFO
OCTOBER 21, 2010 ~ 1.973.987.656 (AS = 2B)
OCTOBER 22, 2010 ~ 2.047.945.311 (AS = 2.050B)
NOVEMBER 03, 2010 ~ 2.047.945.311 (AS = 2.050B)
NOVEMBER 04, 2010 ~ 2.189.048.732 (AS = 2.2B)
NOVEMBER 16, 2010 ~ 2.189.048.732 (AS = 2.2B)
NOVEMBER 17, 2010 ~ 2.355.715.398 (AS = 2.4B)
NOVEMBER 26, 2010 ~ 2.355.715.398 (AS = 2.4B)
NOVEMBER 29, 2010 ~ 2.355.715.398 (AS NV 2.560 TA 2.4B)
DECEMBER 03, 2010 ~ 2.355.715.398 (AS NV 2.560 TA 2.4B)
DECEMBER 07, 2010 ~ 2.355.715.398 (AS NV 2.560 TA 2.4B)
DECEMBER 08, 2010 ~ 2.556.802.354 (AS 2.560)
DECEMBER 10, 2010 ~ 2.556.802.354 (AS 2.560)
DECEMBER 15, 2010 ~ 2.556.802.354 (AS 2.560)
DECEMBER 16, 2010 ~ 2.779.024.576 (AS 2.8B)
DECEMBER 22, 2010 ~ 2.779.024.576 (AS 2.8B)
DECEMBER 28, 2010 ~ 2.779.024.576 (AS NV 3.1B TA 2.8B)
DECEMBER 31, 2010 ~ 2.779.024.576 (AS NV 3.1B TA 2.8B)
JANUARY 07, 2011 ~ 2.779.024.576 (AS NV 3.1B TA 2.8B)
JANUARY 10, 2011 ~ 2.779.024.576 (AS NV 3.1B TA 2.8B)
JANUARY 11, 2011 ~ 3.052.997.178 (AS 3.1B)
JANUARY 12, 2011 ~ 3.052.997.178 (AS 3.1B)
JANUARY 13, 2011 ~ 3.052.997.178 (AS 3.1B)
JANUARY 21, 2011 ~ 3.052.997.178 (AS 3.1B)
FEBRUARY 01, 2011 ~ 3.053.997.178 (AS NV 3.33B TA 3.1B)
FEBRUARY 02, 2011 ~ 3.053.997.178 (AS NV 3.33B TA 3.1B)
FEBRUARY 03, 2011 ~ 3.325.724.450 (AS 3.33B)
FEBRUARY 07, 2011 ~ 3.325.724.450 (AS 3.33B)
FEBRUARY 11, 2011 ~ 3.325.724.450 (AS 3.33B)
FEBRUARY 18, 2011 ~ 3.325.724.450 (AS 3.33B)
FEBRUARY 25, 2011 ~ 3.325.724.450 (AS 3.33B)
MARCH 04, 2011 ~ 3.325.724.450 (AS 3.33B)
MARCH 18, 2011 ~ 3.325.724.450 (AS 3.33B)
APRIL 01, 2011 ~ 3.325.724.450 (AS 3.33B)
APRIL 15, 2011 ~ 3.325.724.450 (AS 3.33B)
APRIL 21, 2011 ~ 3.325.724.450 (AS 3.33B)
MAY 02, 2011 ~ 3.325.724.450 (AS 3.33B)
MAY 13, 2011 ~ 3.325.724.450 (AS 3.33B)
============================================================
and one last bit of data .. epxh's closing pps/volume from
9/30/2009 ~ 04/29/2011 or how a stock gets cellar boxed
*regardless* of .. er .. volume :0
Date Open High Low Close Volume
04/29/11 0.0003 0.0003 0.0002 0.0003 41,254,496
03/31/11 0.0002 0.0002 0.0002 0.0002 280,000
02/28/11 0.0001 0.0001 0.0001 0.0001 1,200,240
01/31/11 0.0001 0.0002 0.0001 0.0001 2,446,000
12/31/10 0.0001 0.0002 0.0001 0.0002 9,560,295
11/30/10 0.0002 0.0002 0.0001 0.0002 20,434,477
10/29/10 0.0004 0.0006 0.0004 0.0006 30,848,954
09/30/10 0.0006 0.0008 0.0006 0.0008 19,117,500
08/31/10 0.0017 0.0019 0.0015 0.0018 17,006,717
07/30/10 0.0005 0.0005 0.0004 0.0005 22,767,174
06/30/10 0.0005 0.0005 0.0004 0.0005 19,336,500
05/28/10 0.0006 0.0007 0.0005 0.0006 7,963,785
04/30/10 0.001 0.0011 0.0009 0.001 67,856,017
03/31/10 0.0012 0.0012 0.001 0.0012 9,820,090
02/26/10 0.0022 0.0026 0.002 0.0026 2,671,150
01/29/10 0.0029 0.0031 0.0028 0.0029 2,823,606
12/31/09 0.004 0.004 0.0035 0.0035 2,678,990
11/30/09 0.0073 0.0074 0.0069 0.0072 4,771,260
10/30/09 0.0067 0.0082 0.0066 0.0078 28,627,473
09/30/09 0.01 0.0104 0.0095 0.0098 26,320,045
link back for prior month's trading stats
===
4kids
all jmo
Been watching Lars, finally got a small starter this morning ...
FBCD up 400% since board alert and still has only started it's meteoric climb..many new catalysts in play including Beverly Hills store opening, new contract with Mr. Bubbles soap collector toys and dispensers, and huge 40 million share reduction. 93m O/S 150m A/S
DTRO-Nice call and research. Very good company.
FBCD is only going to keep getting stronger this year. I expect .50 from my research. This is an overlooked niche coming into play. And the news, and filings are solid. Super Rad is a big acquisition, company has revenue growth. Convertibles sell 1 for 1 at .625.
Major artists. Their collectible toy art is showing up all over the world now. Share reduction. Low A/S-share structure.
EXPH .. trading stats .. week ending 4/21/2011 Date Open High Low Close Volume SHORT %
04/21/11 0.0001 0.0002 0.0001 0.0002 35,905,000 98%
04/20/11 0.0001 0.0001 0.0001 0.0001 530,000 ===
04/19/11 0.0001 0.0002 0.0001 0.0001 3,631,555 82.6%
04/18/11 0.0000 0.0000 0.0000 0.0000 ========= ===
04/15/11 0.0002 0.0002 0.0002 0.0002 4,875,000 100%
04/14/11 0.0002 0.0002 0.0002 0.0002 5,000,000 100%
04/13/11 0.0002 0.0002 0.0002 0.0002 320,000 ===
04/12/11 0.0001 0.0002 0.0001 0.0002 13,139,323 7.6% (1 trade @ .0002 reg sho)
04/11/11 0.0002 0.0002 0.0002 0.0002 2,000,000 100%
04/08/11 0.0002 0.0002 0.0002 0.0002 911 100%
04/06/11 0.0002 0.0002 0.0001 0.0001 21,699,990 32.2% (7M trade at .0002 reg sho)
04/05/11 0.0001 0.0001 0.0001 0.0001 1,347,556 ===
04/04/11 0.0001 0.0002 0.0001 0.0002 7,736,443 ===
04/01/11 0.0001 0.0002 0.0001 0.0002 6,000 ===
APR 2011 ~ 13 days traded ~ volume currently ~ 96,191,778
03/31/11 0.0002 0.0002 0.0002 0.0002 280,000 ===
03/30/11 0.0001 0.0002 0.0001 0.0001 77,582,580 30.3%
03/29/11 0.0001 0.0001 0.0001 0.0001 6,306,189 ===
03/28/11 0.0002 0.0002 0.0001 0.0001 1,001,690 ===
03/25/11 0.0001 0.0001 0.0001 0.0001 3,000,000 ===
03/24/11 0.0001 0.0002 0.0001 0.0001 12,378,815 71.6%
03/23/11 0.0001 0.0001 0.0001 0.0001 1,189,999 ===
03/22/11 0.0001 0.0001 0.0001 0.0001 121,018 ===
03/21/11 0.0001 0.0002 0.0001 0.0002 2,807,004 78.4% (both trades @ .0002 reg sho)
03/18/11 0.0001 0.0002 0.0001 0.0002 2,486,999 ===
03/17/11 0.0001 0.0002 0.0001 0.0002 500,970 === (850 shares @ .0002 reg sho)
03/16/11 0.0002 0.0002 0.0001 0.0001 2,921,965 99.9% (only trade @ .0002 reg sho)
03/15/11 0.0001 0.0002 0.0001 0.0002 12,500,200 47.5%
03/14/11 0.0002 0.0002 0.0001 0.0001 18,490,598 67.5%
03/11/11 0.0001 0.0002 0.0001 0.0002 3,945,405 ===
03/10/11 0.0001 0.0002 0.0001 0.0001 17,164,654 13.8% (only trade @ .0002 reg sho)
03/09/11 0.0001 0.0002 0.0001 0.0001 2,010,100 99.4% (1 trade @ .0002 reg sho)
03/08/11 0.0002 0.0002 0.0001 0.0001 8,250,850 97.5% (3 trades @ .0002 reg sho)
03/07/11 0.0002 0.0002 0.0002 0.0002 1,000,000 ===
03/04/11 0.0001 0.0001 0.0001 0.0001 4,607,400 === (RS .. BID BACK on exph .. zero trades reg sho)
03/03/11 0.0001 0.0002 0.0001 0.0002 5,145,750 === (RS .. BID BACK on exph .. zero trades reg sho)
03/02/11 0.0001 0.0001 0.0001 0.0001 8,647,100 === (RS .. BID BACK on exph .. zero trades reg sho)
03/01/11 0.0001 0.0002 0.0001 0.0002 11,749,660 === (RS .. BID BACK on exph .. zero trades reg sho)
MAR 2011 ~ 23 days traded ~ TOTAL VOLUME ~ 204,088,946
exph closes *even* ~ 10 days
exph closes *up* ~ 7 days
exph closes *down* ~ 6 days
=====================================================
EXPH OCT 2010 - APR 2011 ~ OS & AS INFO
OCTOBER 21, 2010 ~ 1.973.987.656 (AS = 2B)
OCTOBER 22, 2010 ~ 2.047.945.311 (AS = 2.050B)
NOVEMBER 03, 2010 ~ 2.047.945.311 (AS = 2.050B)
NOVEMBER 04, 2010 ~ 2.189.048.732 (AS = 2.2B)
NOVEMBER 16, 2010 ~ 2.189.048.732 (AS = 2.2B)
NOVEMBER 17, 2010 ~ 2.355.715.398 (AS = 2.4B)
NOVEMBER 26, 2010 ~ 2.355.715.398 (AS = 2.4B)
NOVEMBER 29, 2010 ~ 2.355.715.398 (AS NV 2.560 TA 2.4B)
DECEMBER 03, 2010 ~ 2.355.715.398 (AS NV 2.560 TA 2.4B)
DECEMBER 07, 2010 ~ 2.355.715.398 (AS NV 2.560 TA 2.4B)
DECEMBER 08, 2010 ~ 2.556.802.354 (AS 2.560)
DECEMBER 10, 2010 ~ 2.556.802.354 (AS 2.560)
DECEMBER 15, 2010 ~ 2.556.802.354 (AS 2.560)
DECEMBER 16, 2010 ~ 2.779.024.576 (AS 2.8B)
DECEMBER 22, 2010 ~ 2.779.024.576 (AS 2.8B)
DECEMBER 28, 2010 ~ 2.779.024.576 (AS NV 3.1B TA 2.8B)
DECEMBER 31, 2010 ~ 2.779.024.576 (AS NV 3.1B TA 2.8B)
JANUARY 07, 2011 ~ 2.779.024.576 (AS NV 3.1B TA 2.8B)
JANUARY 10, 2011 ~ 2.779.024.576 (AS NV 3.1B TA 2.8B)
JANUARY 11, 2011 ~ 3.052.997.178 (AS 3.1B)
JANUARY 12, 2011 ~ 3.052.997.178 (AS 3.1B)
JANUARY 13, 2011 ~ 3.052.997.178 (AS 3.1B)
JANUARY 21, 2011 ~ 3.052.997.178 (AS 3.1B)
FEBRUARY 01, 2011 ~ 3.053.997.178 (AS NV 3.33B TA 3.1B)
FEBRUARY 02, 2011 ~ 3.053.997.178 (AS NV 3.33B TA 3.1B)
FEBRUARY 03, 2011 ~ 3.325.724.450 (AS 3.33B)
FEBRUARY 07, 2011 ~ 3.325.724.450 (AS 3.33B)
FEBRUARY 11, 2011 ~ 3.325.724.450 (AS 3.33B)
FEBRUARY 18, 2011 ~ 3.325.724.450 (AS 3.33B)
FEBRUARY 25, 2011 ~ 3.325.724.450 (AS 3.33B)
MARCH 04, 2011 ~ 3.325.724.450 (AS 3.33B)
MARCH 18, 2011 ~ 3.325.724.450 (AS 3.33B)
APRIL 01, 2011 ~ 3.325.724.450 (AS 3.33B)
APRIL 15, 2011 ~ 3.325.724.450 (AS 3.33B)
APRIL 21, 2011 ~ 3.325.724.450 (AS 3.33B)
============================================================
and one last bit of data .. epxh's closing pps/volume from
9/30/2009 ~ 03/31/2011 or how a stock gets cellar boxed
*regardless* of volume :0
Date Open High Low Close Volume
03/31/11 0.0002 0.0002 0.0002 0.0002 280,000
02/28/11 0.0001 0.0001 0.0001 0.0001 1,200,240
01/31/11 0.0001 0.0002 0.0001 0.0001 2,446,000
12/31/10 0.0001 0.0002 0.0001 0.0002 9,560,295
11/30/10 0.0002 0.0002 0.0001 0.0002 20,434,477
10/29/10 0.0004 0.0006 0.0004 0.0006 30,848,954
09/30/10 0.0006 0.0008 0.0006 0.0008 19,117,500
08/31/10 0.0017 0.0019 0.0015 0.0018 17,006,717
07/30/10 0.0005 0.0005 0.0004 0.0005 22,767,174
06/30/10 0.0005 0.0005 0.0004 0.0005 19,336,500
05/28/10 0.0006 0.0007 0.0005 0.0006 7,963,785
04/30/10 0.001 0.0011 0.0009 0.001 67,856,017
03/31/10 0.0012 0.0012 0.001 0.0012 9,820,090
02/26/10 0.0022 0.0026 0.002 0.0026 2,671,150
01/29/10 0.0029 0.0031 0.0028 0.0029 2,823,606
12/31/09 0.004 0.004 0.0035 0.0035 2,678,990
11/30/09 0.0073 0.0074 0.0069 0.0072 4,771,260
10/30/09 0.0067 0.0082 0.0066 0.0078 28,627,473
09/30/09 0.01 0.0104 0.0095 0.0098 26,320,045
link back for prior month's trading stats
===
4kids
all jmo
JBII .. trading stats .. week ending ..4/29/2011 Date Open High Low Close Volume SHORT %
*** notes: based on this month's data *imo* certain MMs'
are no longer in control of jbii
.. notice the last 3 days and the size of the t trades shown
imo there is a reason for those sizes .. i believe they are
percentage based *trades* .. anyhow come monday we get to see
what exact volume/activity was *pumped* thru MM ASCM & CHDN
besides the merry trio that is in JBII's *short* up to their necks
again rt l2 is only good on a day by day basis .. but they pulled
every trick in the book on *low* volume eod to close jbii below 3.00
it's beyond revealing to me ..
and that doesn't mean that all out efforts won't commence
with the first trade monday morning .. but the hole is being
dug deeper each day .. march showed the cracks via reg sho
<stealth>
the onslaught was obvious in april via vol/pps/reg sho
suspect may's chasm will be crystal clear for all ~
04/29/11 2.24 3.00 2.05 2.78 417,170 62.7%/20,100 t trades
04/28/11 1.96 2.25 1.94 2.25 174,529 55.6%/11,290 t trades
04/27/11 1.57 2.05 1.55 1.92 392,824 50.4%/18,293 t trades
04/26/11 1.59 1.64 1.52 1.61 285,316 41%
04/25/11 1.87 1.87 1.68 1.68 286,864 43.7%/2k t trades
04/21/11 1.22 1.84 1.05 1.84 736,234 34%
04/20/11 1.96 2.08 1.17 1.26 949,402 22.5%
04/19/11 2.15 2.15 2.00 2.14 171,325 32.3%
04/18/11 2.05 2.17 2.05 2.14 131,592 45.5%
04/15/11 2.20 2.25 2.00 2.17 234,742 42.2%
04/14/11 2.10 2.32 1.90 2.25 375,545 38.6%
04/13/11 2.21 2.38 1.88 2.30 692,446 57.8%
04/12/11 1.80 2.12 1.78 2.12 686,209 67%
04/11/11 1.40 1.93 1.30 1.75 907,578 39.6%
04/08/11 1.10 1.24 1.04 1.24 220,368 66.7%
04/07/11 1.05 1.14 0.96 1.11 160,793 61.9%
04/06/11 1.01 1.10 0.98 1.05 155,038 31.5%
04/05/11 1.07 1.07 0.95 1.00 322,332 34.3%
04/04/11 0.88 1.13 0.85 1.04 658,574 40.6%
04/01/11 0.84 0.85 0.82 0.85 138,711 45.1%
REG SHO OVER 30% = 19 DAYS
APR 2011 volume currently ~ 8,097,592
03/31/11 0.84 0.84 0.80 0.84 72,760 40.7%
03/30/11 0.81 0.81 0.791 0.805 14,350 23.3%
03/29/11 0.81 0.84 0.79 0.81 81,478 26%
03/28/11 0.84 0.84 0.81 0.81 48,597 49.1%
03/25/11 0.83 0.88 0.81 0.83 186,434 47.2%
03/24/11 0.795 0.83 0.79 0.83 38,680 61.7%
03/23/11 0.81 0.82 0.80 0.80 40,232 43.7%
03/22/11 0.82 0.82 0.80 0.80 68,064 47.5%
03/21/11 0.83 0.83 0.80 0.82 44,155 47%
03/18/11 0.80 0.83 0.80 0.83 59,617 55.5%
03/17/11 0.80 0.835 0.79 0.81 118,087 66.7%
03/16/11 0.81 0.81 0.61 0.79 60,122 52.4%
03/15/11 0.80 0.80 0.78 0.80 38,055 36%
03/14/11 0.79 0.80 0.77 0.80 48,539 59.5%
03/11/11 0.785 0.81 0.78 0.80 29,897 22.5%
03/10/11 0.82 0.82 0.785 0.81 13,020 1.6%
03/09/11 0.83 0.83 0.7901 0.82 34,949 54.4%
03/08/11 0.82 0.82 0.78 0.82 56,098 67.3%
03/07/11 0.84 0.84 0.78 0.82 20,800 17.3%
03/04/11 0.85 0.88 0.80 0.84 94,990 83.4%
03/03/11 0.80 0.82 0.79 0.82 7,565 6.1%
03/02/11 0.79 0.80 0.78 0.80 18,076 16%
03/01/11 0.80 0.81 0.80 0.80 41,727 15.7%
REG SHO OVER 30% = 15 DAYS
MAR 2011 ~ TOTAL VOLUME TRADED ~ 1,236,292
02/28/11 0.80 0.82 0.80 0.81 33,239 31%
02/25/11 0.79 0.835 0.79 0.81 31,909 28.2%
02/24/11 0.817 0.835 0.80 0.80 18,058 54.1%
02/23/11 0.84 0.84 0.79 0.816 52,489 62.1%
02/22/11 0.87 0.8799 0.815 0.84 46,077 2.6%
02/18/11 0.82 0.88 0.80 0.87 35,687 7%
02/17/11 0.864 0.864 0.80 0.86 69,191 23.2%
02/16/11 0.86 0.864 0.828 0.864 39,375 35.3%
02/15/11 0.885 0.885 0.82 0.855 41,250 65.3%
02/14/11 0.84 0.85 0.79 0.82 60,817 22.3%
02/11/11 0.77 0.8788 0.77 0.85 47,806 29%
02/10/11 0.824 0.888 0.77 0.8388 77,249 29.3%
02/09/11 0.76 0.8498 0.76 0.77 117,105 40.1%
02/08/11 0.78 0.82 0.72 0.76 87,250 24.1%
02/07/11 0.80 0.888 0.76 0.80 36,205 59.3%
02/04/11 0.87 0.87 0.80 0.85 93,475 23.3%
02/03/11 0.895 0.90 0.845 0.8799 109,875 53.7%
02/02/11 0.92 0.94 0.87 0.88 225,396 17.7%
02/01/11 0.83 0.87 0.8031 0.87 99,279 29.2%
REG SHO OVER 30% = 8 DAYS
FEB 2011 ~ TOTAL VOLUME TRADED ~ 1,321,732
01/31/11 0.82 0.83 0.80 0.83 53,733 35.7%
01/28/11 0.81 0.82 0.785 0.82 161,153 52%
01/27/11 0.815 0.83 0.80 0.81 22,610 79.3%
01/26/11 0.82 0.83 0.78 0.82 37,543 ===
01/25/11 0.80 0.82 0.791 0.82 108,230 28.2%
01/24/11 0.815 0.815 0.775 0.80 61,130 40.6%
01/21/11 0.794 0.82 0.771 0.815 78,942 30%
01/20/11 0.79 0.80 0.77 0.795 132,149 18.5%
01/19/11 0.77 0.79 0.761 0.79 100,943 33.5%
01/18/11 0.75 0.79 0.72 0.77 153,578 30.8%
01/14/11 0.68 0.75 0.68 0.75 89,264 71.2%
01/13/11 0.79 0.79 0.66 0.68 102,498 32.2%
01/12/11 0.69 0.69 0.66 0.675 45,961 24.5%
01/11/11 0.74 0.74 0.662 0.69 91,237 54.7%
01/10/11 0.80 0.80 0.70 0.7399 48,062 44.3%
01/07/11 0.74 0.74 0.70 0.719 89,455 10.2%
01/06/11 0.70 0.77 0.70 0.74 109,155 28.6%
01/05/11 0.77 0.80 0.71 0.73 64,338 22.6%
01/04/11 0.67 0.75 0.67 0.71 85,065 25.4%
01/03/11 0.65 0.67 0.65 0.67 96,008 12.2%
REG SHO OVER 30% = 11 DAYS
JAN 2011 ~ TOTAL VOLUME TRADED ~ 1,731,054
12/31/10 0.57 0.66 0.54 0.65 325,552 22.7%
12/30/10 0.60 0.60 0.55 0.56 225,954 30.3%
12/29/10 0.60 0.60 0.54 0.58 219,868 23.4%
12/28/10 0.615 0.65 0.585 0.60 219,392 9.2%
12/27/10 0.70 0.70 0.605 0.69 112,852 3.2%
12/23/10 0.8475 0.895 0.65 0.70 356,969 33.3%
12/22/10 0.83 0.86 0.79 0.85 279,657 37.8%
12/21/10 0.86 0.86 0.77 0.7711 301,917 29.6%
12/20/10 0.89 0.89 0.76 0.76 184,651 34.7%
12/17/10 0.94 1.01 0.77 0.83 473,413 28.5%
12/16/10 0.86 1.35 0.78 0.92 1,546,137 33.3%
12/15/10 0.52 0.77 0.51 0.77 895,815 32.0%
DEC 2010 ~ TOTAL VOLUME TRADED ~ 6,242,313 shares
==
4kids
all jmo
yep .. but the cracks do show via reg sho
now you know why that daily data had to be *neutralized* 
nothing beats an educated retail to combat BS and SOS
==
4kids
all jmo
More MM games - nice!
JBII .. trading stats .. week ending ..4/15/2011 Date Open High Low Close Volume SHORT %
04/15/11 2.20 2.25 2.00 2.17 234,742 42.2%
04/14/11 2.10 2.32 1.90 2.25 375,545 38.6%
04/13/11 2.21 2.38 1.88 2.30 692,446 57.8%
04/12/11 1.80 2.12 1.78 2.12 686,209 67%
04/11/11 1.40 1.93 1.30 1.75 907,578 39.6%
04/08/11 1.10 1.24 1.04 1.24 220,368 66.7%
04/07/11 1.05 1.14 0.96 1.11 160,793 61.9%
04/06/11 1.01 1.10 0.98 1.05 155,038 31.5%
04/05/11 1.07 1.07 0.95 1.00 322,332 34.3%
04/04/11 0.88 1.13 0.85 1.04 658,574 40.6%
04/01/11 0.84 0.85 0.82 0.85 138,711 45.1%
REG SHO OVER 30% = 10 DAYS
APR 2011 volume currently ~ 4,552,336
03/31/11 0.84 0.84 0.80 0.84 72,760 40.7%
03/30/11 0.81 0.81 0.791 0.805 14,350 23.3%
03/29/11 0.81 0.84 0.79 0.81 81,478 26%
03/28/11 0.84 0.84 0.81 0.81 48,597 49.1%
03/25/11 0.83 0.88 0.81 0.83 186,434 47.2%
03/24/11 0.795 0.83 0.79 0.83 38,680 61.7%
03/23/11 0.81 0.82 0.80 0.80 40,232 43.7%
03/22/11 0.82 0.82 0.80 0.80 68,064 47.5%
03/21/11 0.83 0.83 0.80 0.82 44,155 47%
03/18/11 0.80 0.83 0.80 0.83 59,617 55.5%
03/17/11 0.80 0.835 0.79 0.81 118,087 66.7%
03/16/11 0.81 0.81 0.61 0.79 60,122 52.4%
03/15/11 0.80 0.80 0.78 0.80 38,055 36%
03/14/11 0.79 0.80 0.77 0.80 48,539 59.5%
03/11/11 0.785 0.81 0.78 0.80 29,897 22.5%
03/10/11 0.82 0.82 0.785 0.81 13,020 1.6%
03/09/11 0.83 0.83 0.7901 0.82 34,949 54.4%
03/08/11 0.82 0.82 0.78 0.82 56,098 67.3%
03/07/11 0.84 0.84 0.78 0.82 20,800 17.3%
03/04/11 0.85 0.88 0.80 0.84 94,990 83.4%
03/03/11 0.80 0.82 0.79 0.82 7,565 6.1%
03/02/11 0.79 0.80 0.78 0.80 18,076 16%
03/01/11 0.80 0.81 0.80 0.80 41,727 15.7%
REG SHO OVER 30% = 15 DAYS
MAR 2011 ~ TOTAL VOLUME TRADED ~ 1,236,292
02/28/11 0.80 0.82 0.80 0.81 33,239 31%
02/25/11 0.79 0.835 0.79 0.81 31,909 28.2%
02/24/11 0.817 0.835 0.80 0.80 18,058 54.1%
02/23/11 0.84 0.84 0.79 0.816 52,489 62.1%
02/22/11 0.87 0.8799 0.815 0.84 46,077 2.6%
02/18/11 0.82 0.88 0.80 0.87 35,687 7%
02/17/11 0.864 0.864 0.80 0.86 69,191 23.2%
02/16/11 0.86 0.864 0.828 0.864 39,375 35.3%
02/15/11 0.885 0.885 0.82 0.855 41,250 65.3%
02/14/11 0.84 0.85 0.79 0.82 60,817 22.3%
02/11/11 0.77 0.8788 0.77 0.85 47,806 29%
02/10/11 0.824 0.888 0.77 0.8388 77,249 29.3%
02/09/11 0.76 0.8498 0.76 0.77 117,105 40.1%
02/08/11 0.78 0.82 0.72 0.76 87,250 24.1%
02/07/11 0.80 0.888 0.76 0.80 36,205 59.3%
02/04/11 0.87 0.87 0.80 0.85 93,475 23.3%
02/03/11 0.895 0.90 0.845 0.8799 109,875 53.7%
02/02/11 0.92 0.94 0.87 0.88 225,396 17.7%
02/01/11 0.83 0.87 0.8031 0.87 99,279 29.2%
REG SHO OVER 30% = 7 DAYS
FEB 2011 ~ TOTAL VOLUME TRADED ~ 1,321,732
01/31/11 0.82 0.83 0.80 0.83 53,733 35.7%
01/28/11 0.81 0.82 0.785 0.82 161,153 52%
01/27/11 0.815 0.83 0.80 0.81 22,610 79.3%
01/26/11 0.82 0.83 0.78 0.82 37,543 ===
01/25/11 0.80 0.82 0.791 0.82 108,230 28.2%
01/24/11 0.815 0.815 0.775 0.80 61,130 40.6%
01/21/11 0.794 0.82 0.771 0.815 78,942 30%
01/20/11 0.79 0.80 0.77 0.795 132,149 18.5%
01/19/11 0.77 0.79 0.761 0.79 100,943 33.5%
01/18/11 0.75 0.79 0.72 0.77 153,578 30.8%
01/14/11 0.68 0.75 0.68 0.75 89,264 71.2%
01/13/11 0.79 0.79 0.66 0.68 102,498 32.2%
01/12/11 0.69 0.69 0.66 0.675 45,961 24.5%
01/11/11 0.74 0.74 0.662 0.69 91,237 54.7%
01/10/11 0.80 0.80 0.70 0.7399 48,062 44.3%
01/07/11 0.74 0.74 0.70 0.719 89,455 10.2%
01/06/11 0.70 0.77 0.70 0.74 109,155 28.6%
01/05/11 0.77 0.80 0.71 0.73 64,338 22.6%
01/04/11 0.67 0.75 0.67 0.71 85,065 25.4%
01/03/11 0.65 0.67 0.65 0.67 96,008 12.2%
REG SHO OVER 30% = 11 DAYS
JAN 2011 ~ TOTAL VOLUME TRADED ~ 1,731,054
12/31/10 0.57 0.66 0.54 0.65 325,552 22.7%
12/30/10 0.60 0.60 0.55 0.56 225,954 30.3%
12/29/10 0.60 0.60 0.54 0.58 219,868 23.4%
12/28/10 0.615 0.65 0.585 0.60 219,392 9.2%
12/27/10 0.70 0.70 0.605 0.69 112,852 3.2%
12/23/10 0.8475 0.895 0.65 0.70 356,969 33.3%
12/22/10 0.83 0.86 0.79 0.85 279,657 37.8%
12/21/10 0.86 0.86 0.77 0.7711 301,917 29.6%
12/20/10 0.89 0.89 0.76 0.76 184,651 34.7%
12/17/10 0.94 1.01 0.77 0.83 473,413 28.5%
12/16/10 0.86 1.35 0.78 0.92 1,546,137 33.3%
12/15/10 0.52 0.77 0.51 0.77 895,815 32.0%
DEC 2010 ~ TOTAL VOLUME TRADED ~ 6,242,313 shares
==
4kids
all jmo
EXPH .. trading stats .. week ending 4/15/2011 Date Open High Low Close Volume SHORT % EXPH OCT 2010 - APR 2011 ~ OS & AS INFO Date Open High Low Close Volume
04/15/11 0.0002 0.0002 0.0002 0.0002 4,875,000 100%
04/14/11 0.0002 0.0002 0.0002 0.0002 5,000,000 100%
04/13/11 0.0002 0.0002 0.0002 0.0002 320,000 ===
04/12/11 0.0001 0.0002 0.0001 0.0002 13,139,323 7.6% (1 trade @ .0002 reg sho)
04/11/11 0.0002 0.0002 0.0002 0.0002 2,000,000 100%
04/08/11 0.0002 0.0002 0.0002 0.0002 911 100%
04/06/11 0.0002 0.0002 0.0001 0.0001 21,699,990 32.2% (7M trade at .0002 reg sho)
04/05/11 0.0001 0.0001 0.0001 0.0001 1,347,556 ===
04/04/11 0.0001 0.0002 0.0001 0.0002 7,736,443 ===
04/01/11 0.0001 0.0002 0.0001 0.0002 6,000 ===
03/31/11 0.0002 0.0002 0.0002 0.0002 280,000 ===
03/30/11 0.0001 0.0002 0.0001 0.0001 77,582,580 30.3%
03/29/11 0.0001 0.0001 0.0001 0.0001 6,306,189 ===
03/28/11 0.0002 0.0002 0.0001 0.0001 1,001,690 ===
03/25/11 0.0001 0.0001 0.0001 0.0001 3,000,000 ===
03/24/11 0.0001 0.0002 0.0001 0.0001 12,378,815 71.6%
03/23/11 0.0001 0.0001 0.0001 0.0001 1,189,999 ===
03/22/11 0.0001 0.0001 0.0001 0.0001 121,018 ===
03/21/11 0.0001 0.0002 0.0001 0.0002 2,807,004 78.4% (both trades @ .0002 reg sho)
03/18/11 0.0001 0.0002 0.0001 0.0002 2,486,999 ===
03/17/11 0.0001 0.0002 0.0001 0.0002 500,970 === (850 shares @ .0002 reg sho)
03/16/11 0.0002 0.0002 0.0001 0.0001 2,921,965 99.9% (only trade @ .0002 reg sho)
03/15/11 0.0001 0.0002 0.0001 0.0002 12,500,200 47.5%
03/14/11 0.0002 0.0002 0.0001 0.0001 18,490,598 67.5%
03/11/11 0.0001 0.0002 0.0001 0.0002 3,945,405 ===
03/10/11 0.0001 0.0002 0.0001 0.0001 17,164,654 13.8% (only trade @ .0002 reg sho)
03/09/11 0.0001 0.0002 0.0001 0.0001 2,010,100 99.4% (1 trade @ .0002 reg sho)
03/08/11 0.0002 0.0002 0.0001 0.0001 8,250,850 97.5% (3 trades @ .0002 reg sho)
03/07/11 0.0002 0.0002 0.0002 0.0002 1,000,000 ===
03/04/11 0.0001 0.0001 0.0001 0.0001 4,607,400 === (RS .. BID BACK on exph .. zero trades reg sho)
03/03/11 0.0001 0.0002 0.0001 0.0002 5,145,750 === (RS .. BID BACK on exph .. zero trades reg sho)
03/02/11 0.0001 0.0001 0.0001 0.0001 8,647,100 === (RS .. BID BACK on exph .. zero trades reg sho)
03/01/11 0.0001 0.0002 0.0001 0.0002 11,749,660 === (RS .. BID BACK on exph .. zero trades reg sho)
MAR 2011 ~ 23 days traded ~ TOTAL VOLUME ~ 204,088,946
exph closes *even* ~ 10 days
exph closes *up* ~ 7 days
exph closes *down* ~ 6 days
=====================================================
OCTOBER 21, 2010 ~ 1.973.987.656 (AS = 2B)
OCTOBER 22, 2010 ~ 2.047.945.311 (AS = 2.050B)
NOVEMBER 03, 2010 ~ 2.047.945.311 (AS = 2.050B)
NOVEMBER 04, 2010 ~ 2.189.048.732 (AS = 2.2B)
NOVEMBER 16, 2010 ~ 2.189.048.732 (AS = 2.2B)
NOVEMBER 17, 2010 ~ 2.355.715.398 (AS = 2.4B)
NOVEMBER 26, 2010 ~ 2.355.715.398 (AS = 2.4B)
NOVEMBER 29, 2010 ~ 2.355.715.398 (AS NV 2.560 TA 2.4B)
DECEMBER 03, 2010 ~ 2.355.715.398 (AS NV 2.560 TA 2.4B)
DECEMBER 07, 2010 ~ 2.355.715.398 (AS NV 2.560 TA 2.4B)
DECEMBER 08, 2010 ~ 2.556.802.354 (AS 2.560)
DECEMBER 10, 2010 ~ 2.556.802.354 (AS 2.560)
DECEMBER 15, 2010 ~ 2.556.802.354 (AS 2.560)
DECEMBER 16, 2010 ~ 2.779.024.576 (AS 2.8B)
DECEMBER 22, 2010 ~ 2.779.024.576 (AS 2.8B)
DECEMBER 28, 2010 ~ 2.779.024.576 (AS NV 3.1B TA 2.8B)
DECEMBER 31, 2010 ~ 2.779.024.576 (AS NV 3.1B TA 2.8B)
JANUARY 07, 2011 ~ 2.779.024.576 (AS NV 3.1B TA 2.8B)
JANUARY 10, 2011 ~ 2.779.024.576 (AS NV 3.1B TA 2.8B)
JANUARY 11, 2011 ~ 3.052.997.178 (AS 3.1B)
JANUARY 12, 2011 ~ 3.052.997.178 (AS 3.1B)
JANUARY 13, 2011 ~ 3.052.997.178 (AS 3.1B)
JANUARY 21, 2011 ~ 3.052.997.178 (AS 3.1B)
FEBRUARY 01, 2011 ~ 3.053.997.178 (AS NV 3.33B TA 3.1B)
FEBRUARY 02, 2011 ~ 3.053.997.178 (AS NV 3.33B TA 3.1B)
FEBRUARY 03, 2011 ~ 3.325.724.450 (AS 3.33B)
FEBRUARY 07, 2011 ~ 3.325.724.450 (AS 3.33B)
FEBRUARY 11, 2011 ~ 3.325.724.450 (AS 3.33B)
FEBRUARY 18, 2011 ~ 3.325.724.450 (AS 3.33B)
FEBRUARY 25, 2011 ~ 3.325.724.450 (AS 3.33B)
MARCH 04, 2011 ~ 3.325.724.450 (AS 3.33B)
MARCH 18, 2011 ~ 3.325.724.450 (AS 3.33B)
APRIL 01, 2011 ~ 3.325.724.450 (AS 3.33B)
APRIL 15, 2011 ~ 3.325.724.450 (AS 3.33B)
============================================================
and one last bit of data .. epxh's closing pps/volume from
9/30/2009 ~ 03/31/2011 or how a stock gets cellar boxed *regardless* of volume :0
03/31/11 0.0002 0.0002 0.0002 0.0002 280,000
02/28/11 0.0001 0.0001 0.0001 0.0001 1,200,240
01/31/11 0.0001 0.0002 0.0001 0.0001 2,446,000
12/31/10 0.0001 0.0002 0.0001 0.0002 9,560,295
11/30/10 0.0002 0.0002 0.0001 0.0002 20,434,477
10/29/10 0.0004 0.0006 0.0004 0.0006 30,848,954
09/30/10 0.0006 0.0008 0.0006 0.0008 19,117,500
08/31/10 0.0017 0.0019 0.0015 0.0018 17,006,717
07/30/10 0.0005 0.0005 0.0004 0.0005 22,767,174
06/30/10 0.0005 0.0005 0.0004 0.0005 19,336,500
05/28/10 0.0006 0.0007 0.0005 0.0006 7,963,785
04/30/10 0.001 0.0011 0.0009 0.001 67,856,017
03/31/10 0.0012 0.0012 0.001 0.0012 9,820,090
02/26/10 0.0022 0.0026 0.002 0.0026 2,671,150
01/29/10 0.0029 0.0031 0.0028 0.0029 2,823,606
12/31/09 0.004 0.004 0.0035 0.0035 2,678,990
11/30/09 0.0073 0.0074 0.0069 0.0072 4,771,260
10/30/09 0.0067 0.0082 0.0066 0.0078 28,627,473
09/30/09 0.01 0.0104 0.0095 0.0098 26,320,045
link back for prior month's trading stats
===
4kids
all jmo
And bought more. I'm into profit. It's a cool thing. This stock will be amazing this year. You should check it out.
FBCD is up 35% since I mentioned it and is going to kick ass. I checked you out and got the same impression
JBII .. trading stats .. week ending ..4/08/2011 Date Open High Low Close Volume SHORT %
04/08/11 1.10 1.24 1.04 1.24 220,368 66.7%
04/07/11 1.05 1.14 0.96 1.11 160,793 61.9%
04/06/11 1.01 1.10 0.98 1.05 155,038 31.5%
04/05/11 1.07 1.07 0.95 1.00 322,332 34.3%
04/04/11 0.88 1.13 0.85 1.04 658,574 40.6%
04/01/11 0.84 0.85 0.82 0.85 138,711 45.1%
APR 2011 volume currently ~ 1,655,816
03/31/11 0.84 0.84 0.80 0.84 72,760 40.7%
03/30/11 0.81 0.81 0.791 0.805 14,350 23.3%
03/29/11 0.81 0.84 0.79 0.81 81,478 26%
03/28/11 0.84 0.84 0.81 0.81 48,597 49.1%
03/25/11 0.83 0.88 0.81 0.83 186,434 47.2%
03/24/11 0.795 0.83 0.79 0.83 38,680 61.7%
03/23/11 0.81 0.82 0.80 0.80 40,232 43.7%
03/22/11 0.82 0.82 0.80 0.80 68,064 47.5%
03/21/11 0.83 0.83 0.80 0.82 44,155 47%
03/18/11 0.80 0.83 0.80 0.83 59,617 55.5%
03/17/11 0.80 0.835 0.79 0.81 118,087 66.7%
03/16/11 0.81 0.81 0.61 0.79 60,122 52.4%
03/15/11 0.80 0.80 0.78 0.80 38,055 36%
03/14/11 0.79 0.80 0.77 0.80 48,539 59.5%
03/11/11 0.785 0.81 0.78 0.80 29,897 22.5%
03/10/11 0.82 0.82 0.785 0.81 13,020 1.6%
03/09/11 0.83 0.83 0.7901 0.82 34,949 54.4%
03/08/11 0.82 0.82 0.78 0.82 56,098 67.3%
03/07/11 0.84 0.84 0.78 0.82 20,800 17.3%
03/04/11 0.85 0.88 0.80 0.84 94,990 83.4%
03/03/11 0.80 0.82 0.79 0.82 7,565 6.1%
03/02/11 0.79 0.80 0.78 0.80 18,076 16%
03/01/11 0.80 0.81 0.80 0.80 41,727 15.7%
MAR 2011 ~ TOTAL VOLUME TRADED ~ 1,236,292
02/28/11 0.80 0.82 0.80 0.81 33,239 31%
02/25/11 0.79 0.835 0.79 0.81 31,909 28.2%
02/24/11 0.817 0.835 0.80 0.80 18,058 54.1%
02/23/11 0.84 0.84 0.79 0.816 52,489 62.1%
02/22/11 0.87 0.8799 0.815 0.84 46,077 2.6%
02/18/11 0.82 0.88 0.80 0.87 35,687 7%
02/17/11 0.864 0.864 0.80 0.86 69,191 23.2%
02/16/11 0.86 0.864 0.828 0.864 39,375 35.3%
02/15/11 0.885 0.885 0.82 0.855 41,250 65.3%
02/14/11 0.84 0.85 0.79 0.82 60,817 22.3%
02/11/11 0.77 0.8788 0.77 0.85 47,806 29%
02/10/11 0.824 0.888 0.77 0.8388 77,249 29.3%
02/09/11 0.76 0.8498 0.76 0.77 117,105 40.1%
02/08/11 0.78 0.82 0.72 0.76 87,250 24.1%
02/07/11 0.80 0.888 0.76 0.80 36,205 59.3%
02/04/11 0.87 0.87 0.80 0.85 93,475 23.3%
02/03/11 0.895 0.90 0.845 0.8799 109,875 53.7%
02/02/11 0.92 0.94 0.87 0.88 225,396 17.7%
02/01/11 0.83 0.87 0.8031 0.87 99,279 29.2%
FEB 2011 ~ TOTAL VOLUME TRADED ~ 1,321,732
01/31/11 0.82 0.83 0.80 0.83 53,733 35.7%
01/28/11 0.81 0.82 0.785 0.82 161,153 52%
01/27/11 0.815 0.83 0.80 0.81 22,610 79.3%
01/26/11 0.82 0.83 0.78 0.82 37,543 ===
01/25/11 0.80 0.82 0.791 0.82 108,230 28.2%
01/24/11 0.815 0.815 0.775 0.80 61,130 40.6%
01/21/11 0.794 0.82 0.771 0.815 78,942 30%
01/20/11 0.79 0.80 0.77 0.795 132,149 18.5%
01/19/11 0.77 0.79 0.761 0.79 100,943 33.5%
01/18/11 0.75 0.79 0.72 0.77 153,578 30.8%
01/14/11 0.68 0.75 0.68 0.75 89,264 71.2%
01/13/11 0.79 0.79 0.66 0.68 102,498 32.2%
01/12/11 0.69 0.69 0.66 0.675 45,961 24.5%
01/11/11 0.74 0.74 0.662 0.69 91,237 54.7%
01/10/11 0.80 0.80 0.70 0.7399 48,062 44.3%
01/07/11 0.74 0.74 0.70 0.719 89,455 10.2%
01/06/11 0.70 0.77 0.70 0.74 109,155 28.6%
01/05/11 0.77 0.80 0.71 0.73 64,338 22.6%
01/04/11 0.67 0.75 0.67 0.71 85,065 25.4%
01/03/11 0.65 0.67 0.65 0.67 96,008 12.2%
JAN 2011 ~ TOTAL VOLUME TRADED ~ 1,731,054
12/31/10 0.57 0.66 0.54 0.65 325,552 22.7%
12/30/10 0.60 0.60 0.55 0.56 225,954 30.3%
12/29/10 0.60 0.60 0.54 0.58 219,868 23.4%
12/28/10 0.615 0.65 0.585 0.60 219,392 9.2%
12/27/10 0.70 0.70 0.605 0.69 112,852 3.2%
12/23/10 0.8475 0.895 0.65 0.70 356,969 33.3%
12/22/10 0.83 0.86 0.79 0.85 279,657 37.8%
12/21/10 0.86 0.86 0.77 0.7711 301,917 29.6%
12/20/10 0.89 0.89 0.76 0.76 184,651 34.7%
12/17/10 0.94 1.01 0.77 0.83 473,413 28.5%
12/16/10 0.86 1.35 0.78 0.92 1,546,137 33.3%
12/15/10 0.52 0.77 0.51 0.77 895,815 32.0%
DEC 2010 ~ TOTAL VOLUME TRADED ~ 6,242,313 shares
==
4kids
all jmo
Check out this new filing today from FBCD (now Super Rad Industries)
http://ih.advfn.com/p.php?pid=nmona&article=47185990
The company just eliminated $1.582 million debt by converting a debenture into 2.5 million preferred shares. These shares are converted into commons only on a 1 to 1 basis. The cost basis for each preferred to convert is 62.5 cents. The stock now is around .021 (i alerted this board at .017)and ready to move tomorrow higher on this news.
FBCD just acquired Super Rad, and projected revenues for this niche collectible toy art company for 2011 is between $3 and 8 million. They have an increasing marketshare in this niche, have just signed with Tootsie Roll, Love Is, and Dr. Seuss for making their cartoon figures as collectible art. A deal with Marvel Comics (and others) is anticipated at the coming convention.
They have added Tristan Eaton, a major artist that sets many standards for the industry
http://www.rock-n-roll-action-figures.com/superradtoys.html
http://www.bing.com/shopping/search?q=super+rad+toys+&FORM=HURE
website http://www.superradindustries.I had learned before buying in, that a CEO from another company received shares that he did not pay for, and sold these into the open market. I was aware that there was litigation, or pending litigation about this situation. Since then I have seen today's filing and the news that the O/S was being reduced by 39.5 million. I do believe the stock price of FBCD came down from .40 for this reason. The people that recommended this stock to me bought huge, sold all his other stocks, and says he is holding for .35. The CEO is accessible, and friendly, and will keep you on the phone longer than you expect.
Their is a good reason why the SEC filings were hacked into recently, and the CEO informed me he has a suspicion who did it. This kept the stock price down a little longer, and it brought out the basher short crew last week, but they could find nothing to bash! The Company with the SEC is tracking down the IPO address of the offender-news is coming on a solid regular basis- FBCD is now Super Rad and with daily revenues. (latest financial filing was before acquisition!)
will add it to my watch list
thanks
==
4kids
all jmo
JBII .. trading stats .. week ending ..4/01/2011 Date Open High Low Close Volume SHORT %
04/01/11 0.84 0.85 0.82 0.85 138,711 45.1%
APR volume currently ~ 138,711
03/31/11 0.84 0.84 0.80 0.84 72,760 40.7%
03/30/11 0.81 0.81 0.791 0.805 14,350 23.3%
03/29/11 0.81 0.84 0.79 0.81 81,478 26%
03/28/11 0.84 0.84 0.81 0.81 48,597 49.1%
03/25/11 0.83 0.88 0.81 0.83 186,434 47.2%
03/24/11 0.795 0.83 0.79 0.83 38,680 61.7%
03/23/11 0.81 0.82 0.80 0.80 40,232 43.7%
03/22/11 0.82 0.82 0.80 0.80 68,064 47.5%
03/21/11 0.83 0.83 0.80 0.82 44,155 47%
03/18/11 0.80 0.83 0.80 0.83 59,617 55.5%
03/17/11 0.80 0.835 0.79 0.81 118,087 66.7%
03/16/11 0.81 0.81 0.61 0.79 60,122 52.4%
03/15/11 0.80 0.80 0.78 0.80 38,055 36%
03/14/11 0.79 0.80 0.77 0.80 48,539 59.5%
03/11/11 0.785 0.81 0.78 0.80 29,897 22.5%
03/10/11 0.82 0.82 0.785 0.81 13,020 1.6%
03/09/11 0.83 0.83 0.7901 0.82 34,949 54.4%
03/08/11 0.82 0.82 0.78 0.82 56,098 67.3%
03/07/11 0.84 0.84 0.78 0.82 20,800 17.3%
03/04/11 0.85 0.88 0.80 0.84 94,990 83.4%
03/03/11 0.80 0.82 0.79 0.82 7,565 6.1%
03/02/11 0.79 0.80 0.78 0.80 18,076 16%
03/01/11 0.80 0.81 0.80 0.80 41,727 15.7%
MAR 2011 ~ total volume traded ~ 1,236,292
02/28/11 0.80 0.82 0.80 0.81 33,239 31%
02/25/11 0.79 0.835 0.79 0.81 31,909 28.2%
02/24/11 0.817 0.835 0.80 0.80 18,058 54.1%
02/23/11 0.84 0.84 0.79 0.816 52,489 62.1%
02/22/11 0.87 0.8799 0.815 0.84 46,077 2.6%
02/18/11 0.82 0.88 0.80 0.87 35,687 7%
02/17/11 0.864 0.864 0.80 0.86 69,191 23.2%
02/16/11 0.86 0.864 0.828 0.864 39,375 35.3%
02/15/11 0.885 0.885 0.82 0.855 41,250 65.3%
02/14/11 0.84 0.85 0.79 0.82 60,817 22.3%
02/11/11 0.77 0.8788 0.77 0.85 47,806 29%
02/10/11 0.824 0.888 0.77 0.8388 77,249 29.3%
02/09/11 0.76 0.8498 0.76 0.77 117,105 40.1%
02/08/11 0.78 0.82 0.72 0.76 87,250 24.1%
02/07/11 0.80 0.888 0.76 0.80 36,205 59.3%
02/04/11 0.87 0.87 0.80 0.85 93,475 23.3%
02/03/11 0.895 0.90 0.845 0.8799 109,875 53.7%
02/02/11 0.92 0.94 0.87 0.88 225,396 17.7%
02/01/11 0.83 0.87 0.8031 0.87 99,279 29.2%
FEB 2011 ~ total volume traded ~ 1,321,732
01/31/11 0.82 0.83 0.80 0.83 53,733 35.7%
01/28/11 0.81 0.82 0.785 0.82 161,153 52%
01/27/11 0.815 0.83 0.80 0.81 22,610 79.3%
01/26/11 0.82 0.83 0.78 0.82 37,543 ===
01/25/11 0.80 0.82 0.791 0.82 108,230 28.2%
01/24/11 0.815 0.815 0.775 0.80 61,130 40.6%
01/21/11 0.794 0.82 0.771 0.815 78,942 30%
01/20/11 0.79 0.80 0.77 0.795 132,149 18.5%
01/19/11 0.77 0.79 0.761 0.79 100,943 33.5%
01/18/11 0.75 0.79 0.72 0.77 153,578 30.8%
01/14/11 0.68 0.75 0.68 0.75 89,264 71.2%
01/13/11 0.79 0.79 0.66 0.68 102,498 32.2%
01/12/11 0.69 0.69 0.66 0.675 45,961 24.5%
01/11/11 0.74 0.74 0.662 0.69 91,237 54.7%
01/10/11 0.80 0.80 0.70 0.7399 48,062 44.3%
01/07/11 0.74 0.74 0.70 0.719 89,455 10.2%
01/06/11 0.70 0.77 0.70 0.74 109,155 28.6%
01/05/11 0.77 0.80 0.71 0.73 64,338 22.6%
01/04/11 0.67 0.75 0.67 0.71 85,065 25.4%
01/03/11 0.65 0.67 0.65 0.67 96,008 12.2%
JAN 2011 ~ TOTAL VOLUME TRADED ~ 1,731,054
12/31/10 0.57 0.66 0.54 0.65 325,552 22.7%
12/30/10 0.60 0.60 0.55 0.56 225,954 30.3%
12/29/10 0.60 0.60 0.54 0.58 219,868 23.4%
12/28/10 0.615 0.65 0.585 0.60 219,392 9.2%
12/27/10 0.70 0.70 0.605 0.69 112,852 3.2%
12/23/10 0.8475 0.895 0.65 0.70 356,969 33.3%
12/22/10 0.83 0.86 0.79 0.85 279,657 37.8%
12/21/10 0.86 0.86 0.77 0.7711 301,917 29.6%
12/20/10 0.89 0.89 0.76 0.76 184,651 34.7%
12/17/10 0.94 1.01 0.77 0.83 473,413 28.5%
12/16/10 0.86 1.35 0.78 0.92 1,546,137 33.3%
12/15/10 0.52 0.77 0.51 0.77 895,815 32.0%
DEC 2010 ~ TOTAL VOLUME TRADED ~ 6,242,313 shares
===
looking forward to the days when JBII's PPS isn't quite so CONTROLLED
the way it is and has been for months
==
4kids
all jmo
FBCD now Super Rad Industries is going to run very hard very soon. You folks really need to DD this stock, it's going to .35. Your timing could not be any better.
You might want to take a look at DTRO - this is one of those companies that is just quietly doing it's business, no PR's, no stock pumping. It's been declining in price and I think it's a great buy at the current level. They should see significant revenue increases in the third quarter of this year - everything is there to check them out - they are fully filing.
EXPH .. trading stats .. week ending 3/4/2011 Date Open High Low Close Volume SHORT %
EXPH >>> JUST ANOTHER CONTROLLED STOCK ON THE OTC .. here's to T squared shaking a few patterns :)
03/04/11 0.0001 0.0001 0.0001 0.0001 4,607,400 === (RS .. BID BACK on exph .. zero trades reg sho)
03/03/11 0.0001 0.0002 0.0001 0.0002 5,145,750 === (RS .. BID BACK on exph .. zero trades reg sho)
03/02/11 0.0001 0.0001 0.0001 0.0001 8,647,100 === (RS .. BID BACK on exph .. zero trades reg sho)
03/01/11 0.0001 0.0002 0.0001 0.0002 11,749,660 === (RS .. BID BACK on exph .. zero trades reg sho)
02/28/11 0.0001 0.0001 0.0001 0.0001 1,200,240 === (RS .. BID BACK on exph .. zero trades reg sho) ****
02/25/11 0.0001 0.0002 0.0001 0.0002 1,096,600 2.7% (RS .. BID BACK on exph .. trades at .0002 all reg sho)
02/24/11 0.0001 0.0001 0.0001 0.0001 7,145,000 100% (RS .. BID BACK on exph .. all trades at .0001)
02/23/11 0.0001 0.0001 0.0001 0.0001 6,780,000 99.9% (RS .. BID BACK on exph .. all trades at .0001)
02/22/11 0.0001 0.0001 0.0001 0.0001 740,000 === (RS .. BID BACK on exph .. zero trades reg sho .. all at .0001)
02/18/11 0.0001 0.0001 0.0001 0.0001 12,724,000 === (RS new *pattern* .. BID BACK on exph .. zero *trades* reg sho)
02/17/11 0.0001 0.0002 0.0001 0.0002 19,217,025 73.6% (RS 6th full day NO BID .. even tho' ask moved to .0002)
02/16/11 0.0001 0.0001 0.0001 0.0001 10,115,000 89.9% (RS 5th full day NO BID .. all trades done at .0001)
02/15/11 0.0001 0.0001 0.0001 0.0001 6,396,500 94.6% (RS 4th full day NO BID .. all trades at .0001)
02/14/11 0.0001 0.0001 0.0001 0.0001 11,455,000 100% (RS 3rd full day NO BID .. all trades at .0001)
02/11/11 0.0001 0.0001 0.0001 0.0001 77,798,340 49.2% (RS 2nd full day NO BID 2.3M shares at .00089) ***
02/10/11 0.0001 0.0001 0.0001 0.0001 26,509,999 96.6% (RS first full day exph NO BID .. all trades at .0001)
02/09/11 0.0002 0.0002 0.0001 0.0001 49,104,998 69.8% (RS only 1M shares were done at ask .0002)
02/08/11 0.0001 0.0002 0.0001 0.0002 8,125,000 61.5% (RS only 125,000 shares were done at ask .0002)
02/07/11 0.0001 0.0002 0.0001 0.0002 280,764,272 58.6% (RS only 250,000 shares were done at ask .0002)
02/04/11 0.0001 0.0001 0.0001 0.0001 37,000,000 91.8% (RS every trade at bid .0001 except 3M at bid .0001)
02/03/11 0.0002 0.0002 0.0001 0.0001 13,193,000 93.6% (RS every trade at the ask .0002 except one duped 500k trade)
02/02/11 0.0001 0.0002 0.0001 0.0001 10,982,300 27.1% (RS every trade at ask .0002)
02/01/11 0.0002 0.0002 0.0001 0.0001 2,126,000 53% (RS every trade at ask .0002)
for FEB 2011 ~ 19 days traded ~ TOTAL VOLUME ~ 582,473,274
exph closes *even* = 13 days
exph closes *down* = 3 days
exph closes *up* = 3 days
RS days running 50% + = 13
RS days running below 49.9% = 6
01/31/11 0.0001 0.0002 0.0001 0.0001 2,446,000 62.7% (RS every trade at ask .0002 except 10k signal trade)
01/28/11 0.0001 0.0002 0.0001 0.0001 7,159,780 34.2% (RS every trade at ask .0002)
01/27/11 0.0002 0.0002 0.0001 0.0001 22,950,00 95.8% (RS every trade at ask .0002)
01/26/11 0.0001 0.0001 0.0001 0.0001 3,155,040 === (all trades done at .0001)
01/25/11 0.0002 0.0002 0.0002 0.0002 500,000 100% (RS every trade at ask .0002)
01/24/11 0.0001 0.0002 0.0001 0.0002 18,160,250 97.6% (RS every trade at ask .0002)
01/21/11 0.0002 0.0002 0.0002 0.0002 13,708,692 100%
01/20/11 0.0002 0.0002 0.0001 0.0001 4,401,000 99.97%
01/19/11 0.0002 0.0002 0.0001 0.0001 29,952,130 99.3%
01/18/11 0.0001 0.0002 0.0001 0.0001 4,051,175 98.7%
01/14/11 0.0001 0.0002 0.0001 0.0002 21,385,260 96.7%
01/13/11 0.0001 0.0002 0.0001 0.0001 182,580,710 96.6%
01/12/11 0.0001 0.0001 0.0001 0.0001 101,407,556 98.6%
01/11/11 0.0002 0.0002 0.0001 0.0002 9,145,556 99.5%
01/10/11 0.0002 0.0002 0.0002 0.0002 30,000 100%
01/07/11 0.0002 0.0002 0.0002 0.0002 9,947,750 100%
01/06/11 0.0001 0.0002 0.0001 0.0002 10,685,500 2.8% **
01/05/11 0.0001 0.0001 0.0001 0.0001 4,999,995 ===
01/04/11 0.0001 0.0002 0.0001 0.0002 157,006 79.6%
01/03/11 0.0002 0.0002 0.0001 0.0001 6,371,724 97.3%
for JAN 2011 ~ 20 days traded .. TOTAL VOLUME = 453,195,124
exph closes *even* = 11 days
exph closes *down* = 5 days
exph closes *up* = 4 days
RS days running 62% + = 16
RS days running below 35% = 4
====
EXPH OCT 2010 - FEB 2011 ~ OS & AS INFO
OCTOBER 21, 2010 ~ 1.973.987.656 (AS = 2B)
OCTOBER 22, 2010 ~ 2.047.945.311 (AS = 2.050B)
NOVEMBER 03, 2010 ~ 2.047.945.311 (AS = 2.050B)
NOVEMBER 04, 2010 ~ 2.189.048.732 (AS = 2.2B)
NOVEMBER 16, 2010 ~ 2.189.048.732 (AS = 2.2B)
NOVEMBER 17, 2010 ~ 2.355.715.398 (AS = 2.4B)
NOVEMBER 26, 2010 ~ 2.355.715.398 (AS = 2.4B)
NOVEMBER 29, 2010 ~ 2.355.715.398 (AS NV 2.560 TA 2.4B)
DECEMBER 03, 2010 ~ 2.355.715.398 (AS NV 2.560 TA 2.4B)
DECEMBER 07, 2010 ~ 2.355.715.398 (AS NV 2.560 TA 2.4B)
DECEMBER 08, 2010 ~ 2.556.802.354 (AS 2.560)
DECEMBER 10, 2010 ~ 2.556.802.354 (AS 2.560)
DECEMBER 15, 2010 ~ 2.556.802.354 (AS 2.560)
DECEMBER 16, 2010 ~ 2.779.024.576 (AS 2.8B)
DECEMBER 22, 2010 ~ 2.779.024.576 (AS 2.8B)
DECEMBER 28, 2010 ~ 2.779.024.576 (AS NV 3.1B TA 2.8B)
DECEMBER 31, 2010 ~ 2.779.024.576 (AS NV 3.1B TA 2.8B)
JANUARY 07, 2011 ~ 2.779.024.576 (AS NV 3.1B TA 2.8B)
JANUARY 10, 2011 ~ 2.779.024.576 (AS NV 3.1B TA 2.8B)
JANUARY 11, 2011 ~ 3.052.997.178 (AS 3.1B)
JANUARY 12, 2011 ~ 3.052.997.178 (AS 3.1B)
JANUARY 13, 2011 ~ 3.052.997.178 (AS 3.1B)
JANUARY 21, 2011 ~ 3.052.997.178 (AS 3.1B)
FEBRUARY 1, 2011 ~ 3.053.997.178 (AS NV 3.33B TA 3.1B)
FEBRUARY 2, 2011 ~ 3.053.997.178 (AS NV 3.33B TA 3.1B)
FEBRUARY 3, 2011 ~ 3.325.724.450 (AS 3.33B)
FEBRUARY 7, 2011 ~ 3.325.724.450 (AS 3.33B)
FEBRUARY 11, 2011 ~ 3.325.724.450 (AS 3.33B)
FEBRUARY 18, 2011 ~ 3.325.724.450 (AS 3.33B)
FEBRUARY 25, 2011 ~ 3.325.724.450 (AS 3.33B)
MARCH 04, 2011 ~ 3.325.724.450 (AS 3.33B)
============
and one last bit of data .. epxh's closing pps/volume from
9/30/2009 ~ 02/28/2011 or how a stock
gets cellar boxed *regardless* of volume :0
Date Open High Low Close Volume
02/28/11 0.0001 0.0001 0.0001 0.0001 1,200,240
01/31/11 0.0001 0.0002 0.0001 0.0001 2,446,000
12/31/10 0.0001 0.0002 0.0001 0.0002 9,560,295
11/30/10 0.0002 0.0002 0.0001 0.0002 20,434,477
10/29/10 0.0004 0.0006 0.0004 0.0006 30,848,954
09/30/10 0.0006 0.0008 0.0006 0.0008 19,117,500
08/31/10 0.0017 0.0019 0.0015 0.0018 17,006,717
07/30/10 0.0005 0.0005 0.0004 0.0005 22,767,174
06/30/10 0.0005 0.0005 0.0004 0.0005 19,336,500
05/28/10 0.0006 0.0007 0.0005 0.0006 7,963,785
04/30/10 0.001 0.0011 0.0009 0.001 67,856,017
03/31/10 0.0012 0.0012 0.001 0.0012 9,820,090
02/26/10 0.0022 0.0026 0.002 0.0026 2,671,150
01/29/10 0.0029 0.0031 0.0028 0.0029 2,823,606
12/31/09 0.004 0.004 0.0035 0.0035 2,678,990
11/30/09 0.0073 0.0074 0.0069 0.0072 4,771,260
10/30/09 0.0067 0.0082 0.0066 0.0078 28,627,473
09/30/09 0.01 0.0104 0.0095 0.0098 26,320,045
link back for prior month's trading stats on EXPH if interested
===
4kids
all jmo
New FINRA 4320 Short Sale Delivery Requirements
FINRA 4320. Short Sale Delivery Requirements
(a) If a participant of a registered clearing agency has a fail to deliver position at a registered clearing agency in a non-reporting threshold security for 13 consecutive settlement days, the participant shall immediately thereafter close out the fail to deliver position by purchasing securities of like kind and quantity.
(1) Provided, however, if a participant of a registered clearing agency has a fail to deliver position at a registered clearing agency for thirty-five consecutive settlement days in a non-reporting threshold security that was sold pursuant to SEC Rule 144, the participant shall immediately thereafter close out the fail to deliver position in the security by purchasing securities of like kind and quantity. The requirements in paragraph (b) shall apply to all such fails to deliver that are not closed out in conformance with this paragraph (a)(1).
(b) If a participant of a registered clearing agency has a fail to deliver position at a registered clearing agency in a non-reporting threshold security for 13 consecutive settlement days (or 35 consecutive settlement days if entitled to rely on paragraph (a)(1)), the participant and any broker or dealer for which it clears transactions, including any market maker that would otherwise be entitled to rely on the exception provided in paragraph (b)(2)(iii) of Rule 203 of SEC Regulation SHO, may not accept a short sale order in the non-reporting threshold security from another person, or effect a short sale in the non-reporting threshold security for its own account, without borrowing the security or entering into a bona-fide arrangement to borrow the security, until the participant closes out the fail to deliver position by purchasing securities of like kind and quantity and that purchase has cleared and settled at a registered clearing agency.
(c) If a participant of a registered clearing agency reasonably allocates a portion of a fail to deliver position to another registered broker or dealer for which it clears trades or for which it is responsible for settlement, based on such broker or dealer's short position, then the provisions of this Rule relating to such fail to deliver position shall apply to the portion of the fail to deliver position allocated to such registered broker or dealer, and not to the participant.
(d) A participant of a registered clearing agency shall not be deemed to have fulfilled the requirements of this Rule where the participant enters into an arrangement with another person to purchase securities as required by this Rule, and the participant knows or has reason to know that the other person will not deliver securities in settlement of the purchase.
(e) For the purposes of this Rule, the following terms shall have the meanings below:
(1) the term “market maker” has the same meaning as in Section 3(a)(38) of the Exchange Act.
(2) the term “non-reporting threshold security” means any equity security of an issuer that is not registered pursuant to Section 12 of the Exchange Act and for which the issuer is not required to file reports pursuant to Section 15(d) of the Exchange Act:
(A) for which there is an aggregate fail to deliver position for five consecutive settlement days at a registered clearing agency of 10,000 shares or more and for which on each settlement day during the five consecutive settlement day period, the reported last sale during normal market hours for the security on that settlement day that would value the aggregate fail to deliver position at $50,000 or more, provided that if there is no reported last sale on a particular settlement day, then the price used to value the position on such settlement day would be the previously reported last sale; and
(B) is included on a list published by FINRA.
A security shall cease to be a non-reporting threshold security if the aggregate fail to deliver position at a registered clearing agency does not meet or exceed either of the threshold tests specified in paragraph (e)(2)(A) of this Rule for five consecutive settlement days.
(3) the term “participant” means a participant as defined in Section 3(a)(24) of the Exchange Act, that is a FINRA member. The term “registered clearing agency” means a clearing agency, as defined in Section 3(a)(23)(A) of the Exchange Act, that is registered with the SEC pursuant to Section 17A of the Exchange Act.
(This is 3(a)(23)(A): The term "clearing agency" means any person who acts as an intermediary in making payments or deliveries or both in connection with transactions in securities or who provides facilities for comparison of data respecting the terms of settlement of securities transactions, to reduce the number of settlements of securities transactions, or for the allocation of securities settlement responsibilities. Such term also means any person, such as a securities depository, who (i) acts as a custodian of securities in connection with a system for the central handling of securities whereby all securities of a particular class or series of any issuer deposited within the system are treated as fungible and may be transferred, loaned, or pledged by bookkeeping entry without physical delivery of securities certificates, or (ii) otherwise permits or facilitates the settlement of securities transactions or the hypothecation or lending of securities without physical delivery of securities certificates.
(5) the term “settlement day” means any business day on which deliveries of securities and payments of money may be made through the facilities of a registered clearing agency.
==========================================
WHY IS FINRA 4320 SO EXCITING TO THE SECURITIES LAWYERS AND THE CORPORATIONS THAT HAVE SURVVIVED THESE NSS ATTACKS?
1) It finally addresses abusive naked short selling in non-reporting issuers. Up until now the regulators and SROs have found that the investors in development stage corporations somehow did not deserve the provision of investor protection.
2) Even though it is entitled “short sale delivery requirements” it covers the failures to deliver (FTDs) involved with intentionally mislabeled “long sales”. One way to bypass the newer short selling rules is to illegal mislabel your short sale as a “long sale” and just voluntarily fail to deliver the shares.
3) It affects FTDs held in “ex-clearing” because all (approximately 1,000) clearing firms that are “participants” of the NSCC/DTCC are indeed “registered clearing agencies” in and of themselves. (see 3(a)(23)(A) in the smaller print above.)
4) It addresses the FTDs of even market makers held at registered clearing agencies. The bona fide MM exemption from needing to pre-borrow or “locate” shares before making admittedly naked short sales is the main loophole being abused. THIS IS A VERY BIG DEAL.
5) It expressly forbids a crooked clearing firm from “crossing” failed to be delivered shares to a co-conspiring clearing firm in order to reset the 13-day clock. These illegal “wash sales” are pandemic.
6) There is no “grandfathering” in of old delivery failures held in illegal “ex-clearing arrangements” as these are still FTDs as nothing ever got delivered. The mere marking to market of the monetary value of failed delivery obligations has nothing whatsoever to do with making the “good form delivery” of the securities sold needed to accomplish the “settlement” of a trade.
7) In the abusive naked short selling world there are very, very bad guys and other semi-bad guys. The semi-bad guys will probably voluntarily cover their not so huge naked short positions BEFORE the really bad guys will have time to. They may even go net long after covering knowing that their bigger brother bad guys might be in deep doo-doo.
8) All of the crooks are not going to run willy-nilly tomorrow morning and cover BUT THOSE CORPORATIONS WITH IMMENSE NAKED SHORT POSITIONS THAT ARE ABLE TO PULL OFF SOME SORT OF LARGE CORPORATE ACCOMPLISHMENT WILL BE GREATLY BENEFITTED AND THEIR NAKED SHORT POSITIONS MIGHT RISE TO THE TOP OF THE “SHORT POSITIONS TO IMMEDIATELY COVER” LIST.
=============================================================
From HookMeister:
Doc, I've posted this question previously and haven't heard any response from anyone so I thought I'd ask you if you don't mind.
With respect to the NSS issue and the new regulations starting Monday, will MMs who already hold short positions prior to the new regulations be required to now comply with the new regs concerning their already existing short positions or will it only apply to new short positions going forward??
Hi HookMeister,
It’s actually the combination of all of the various new rules kicking in right now that will FINALLY make a difference as they all block some of the various loopholes in existence. The weak link has always been that the old rules only applied to delivery failures held at “registered clearing agencies” like the NSCC. The crooked clearing firms simply “paired off” outside of the NSCC, entered into illegal “ex-clearing arrangements” and forgave each other’s delivery obligations. Instead they chose to merely mark to market the monetary value of their failed delivery obligations and hide them in a “side pocket”. As a result, U.S. investors have no clue as to the damaged nature of the corporation they are investing in.
What the various “securities cops” were just reminded of is that these crooked clearing firms are indeed “registered clearing agencies” in and of themselves as per the ’34 Exchange Act. Up until now, nobody has been tallying the delivery failures hiding in these illegal “ex-clearing arrangements”. The new FINRA 4320 as of tomorrow mandates the buying in of 13 day old delivery failures of non-reporting issuers (like Medinah) IF MEDINAH’S NAME APPEARS ON THE FINRA THRESHOLD LIST. Medinah’s name is to appear on this list if both their delivery failures exceed 10,000 shares and are worth over $50,000 in the aggregate. Although Medinah’s approximately 1.3 billion shares of failed delivery failures are currently (@12-cents) worth approximately $156 million MEDINAH IS STILL NOT ON THE LIST. This is a testimony to the pandemic nature of these illegal “ex-clearing arrangements”
Why is this? FINRA leaves the tallying of the delivery failures up to the NSCC. The NSCC only tallies the delivery failures officially held at the NSCC which the crooks now avoid like the plague as the hiding spot for their delivery failures. The NSCC management, which operates as an “SRO” or “self-regulatory organization”, insanely holds that the delivery failures held by their “participants/bosses” outside of the NSCC in “ex-clearing arrangements” are of a “contractual” nature which is none of their business.
Wait a minute, the SEC has said that the SROs like FINRA and the NSCC are to provide “the first line of defense against market abuses”. Congress in Section 17A of the’34 Exchange Act mandated that its parent the DTCC “promptly settle” all securities transactions. This means that the sellers of securities must promptly deliver that which they sold on or near T+3. Illegal “ex-clearing arrangements” intentionally circumvent the “prompt settlement” of securities transactions. By definition, an SRO like the NSCC is mandated to “draft and enforce rules and regulations and to monitor the “BUSINESS CONDUCT” of its co-owning “participants.”
How can the management of an SRO like the NSCC with that SRO mandate as well as that congressional mandate as well as acting as the party acting in the capacity of providing “the first line of defense against market abuses” claim that it has no authority to address the efforts of their bosses to intentionally circumvent the “prompt settlement” of securities transactions? How can you claim to be “powerless” to follow a congressional mandate?
Forced buy-ins of 13-day old delivery failures are critical as they represent the only source of meaningful DETERRENCE to these crimes and they are the only treatment available when the sellers of securities absolutely refuse to deliver that which they sell. With FINRA 4320 in effect, non-reporting issuers are FINALLY afforded protection via mandated buy-ins but only if that 10,000 shares and $50,000 worth of delivery failures metric is reached. If the NSCC management continues to refuse to tally the delivery failures held in these “regulated clearing agencies” known as “clearing firms” in these “ex-clearing arrangements” in order to keep their bosses from being bought-in then the issue of a “securities cop” with all of these various mandates acting to directly aid and abet as well as cover up these frauds comes front and center.
The gist of it is that the mere marking to market of the monetary value of a failed delivery obligation has nothing to do whatsoever with the congressionally mandated “prompt settlement” of a securities transaction. In fact, although from a distance it serves to lend an air of legitimacy it actually is the ideal COVER UP FRAUD used to mask the fact that “prompt settlement” is not occurring.
Most securities lawyers I work with predict that FINRA 4320 will force the NSCC management to pull a “Pontius Pilate” and wash its hands of this aiding and abetting role and providing this cover up fraud and buy-in these previously unaddressed delivery failures which they theoretically had no idea existed. No doubt they will say WE ARE SHOCKED, SHOCKED and shame on you abusive bosses of ours. We had no idea these crimes were being committed on our watch.
The concept of a “securities cop” like the NSCC intentionally MANIPULATING downwards the metric needing to be reached so that investor protection is provided in order to look after the financial interests of its misbehaving bosses is unconscionable and the investing public will not tolerate these thefts any longer.
source
original post from camper9
POST
=============================================================
1) WHY DO ABUSIVE NAKED SHORT SELLERS NEVER, NEVER, NEVER VOLUNTARILY COVER THEIR NAKED SHORT POSITIONS?
ANSWER:
A) They can easily gain access to the funds of uneducated investors without ever delivering anything to them. All they’re asked by the NSCC to do is to collateralize the monetary value of the failed delivery obligation on a marked to market basis. As the readily sellable share price depressing “security entitlements” resulting from all of these intentional delivery failures pile up the share price and therefore the collat. requirements drop allowing the investor’s money to flow to the party refusing to deliver that which they sold.
B) Until 4320 came along there was no deterrence, no forced buy-ins, no perp walks and no meaningful fines levied.
C) There’s a huge bonus available for bankrupting a company i.e. no taxable capital gains.
D) Often they run up so high of a naked short position that they can’t even stop their daily NSS-ing lest the share price go up and the collateralization requirements of the immense uncovered position become unbearable.
E) This is their turf and they know the loopholes better than uninformed investors (excepting of course the average Medinah investor that will soon be omniscient in these matters or die trying.)
F) These crooks have high paid lobbyists that keep convincing the politicians that the injecting of liquidity by even abusive MMs is critical to allow our markets to function smoothly.
G) The delivery failures were invisible to the investing public and the “securities cops” until 4320 came along as well as the new DTCC “obligation warehouses”.
2) What is the direct result of this phenomenon?
A) Companies that have been under attack for as many as 14 years are going to have accumulated enormous open naked short positions if the crooks have failed to bankrupt them before the world learned that they were MISDIAGNOSED as “scammy pump and dumps”.
3) What is the biggest benefit of 4320 once a company under attack gets onto the “nonreporting threshold list”?
A) Mandated buy-ins on day 13 by a party (clearing firm) that doesn’t particularly care what he pays for the stock because he gets to hand the bill to the guilty party.
4) What is the main truly meaningful deterrent to committing these crimes?
A) The fear of being bought-in at an inopportune time by a party that doesn’t care what he pays.
5) What is the ONLY cure available when the seller of securities absolutely refuses to EVER deliver the securities that it sold after contracting to deliver them by T+3?
A) Mandated buy-in.
(from www.theminingplay.com, posted by Brecciaboy)
==============================================================
A DIFFERENT WAY OF LEARNING THE HEINOUS NATURE OF “EX-CLEARING” CRIMES
Your brokerage firm uses a clearing firm to “clear” the trades you make. Corrupt clearing firms have a metaphorical backroom known (metaphorically) as a “sponsor table” room. When you buy Medinah shares let’s pretend you pay with a bucket full of silver dollars. If the clearing firm of the MM that sold you shares refuses to deliver that which you purchased your bucket of coins goes into your clearing firm’s “sponsor table” firm. Your coins are dumped onto the table that the clearing firm of the MM “sponsored”.
These “sponsor tables” are unique in that that have netting around them. The floor of the “sponsor table” room is unique in that it tips as share prices drop. Since nothing was delivered your coins exist in a state of limbo UNTIL delivery occurs if it ever occurs. As the share price predictably tanks and the floor tips from naked short sales which open up more and more “sponsor tables” the clearing firm of the crooked MM as well as the crooked MM itself get to collect all of your coins that slipped into the netting EVEN THOUGH THAT WHICH THE MM SOLD NEVER EVEN EXISTED. Your coins “collateralize” the debt of the crooked MM.
The interest that your coins earn is split by your clearing firm and the crooked MM IF AND ONLY IF YOUR CLEARING FIRM REFUSES TO YELL AT THE MM AND ASK HIM TO DELIVER THAT WHICH HE SOLD TO HIS CLIENT i.e. you. In other words if he is willing to throw your financial interests under the bus he gets to share in the interest earnings. “Sponsoring” tables is easy, all you have to do is to refuse to deliver the securities that you sell.
Every night the crooked MM that sold you nonexistent shares gets to go into the “sponsor table” room and collect whatever coins fell into the netting from all of the tables he sponsored which might be in the thousands or tens of thousands after 14 years. If the crooked MM “recruits” other MMs and various hedge funds to sponsor tables the coins will flow into the netting very rapidly FROM ALL “SPONSORED” TABLES as the share price plummets. If they succeed in bankrupting the company they targeted to destroy all of your coins will be gone and in the possession of the crooked MM despite the fact that he still hasn’t delivered anything and what he sold to you doesn’t even exist.
After you bought the shares you got a monthly brokerage statement that “implied” that your clearing firm was “holding long” your shares. You probably assumed they were in some type of vault at the DTC depository. Two corrupt clearing firms can easily “pair up” outside of the NSCC (ex-clearing) and offer each other and each other’s clients the use of their “sponsor table” rooms. This amounts to allowing a bunch of crooks to sell a given clearing firm’s clients fake shares and never deliver them if and only if the other clearing firm extends the same courtesy. The NSCC management mandated to regulate the “business conduct” of its “participating clearing firms” that co-own the NSCC holds that what their bosses do outside of the NSCC proper is none of their business.
(from www.theminingplay.com, posted by Brecciaboy)
=================================================================
My most popular question du jour has to do with historically when do the naked short sellers typically cover. The answer is usually never or about as often as a tiny junior explorer makes a discovery like that at Lipangue which is next to never.
First of all, you have to qualify which type of short sellers you’re referring to-the jet skiers or the aircraft carriers.
The jet skiers are the smaller market makers, broker/dealers, hedge funds, prime brokers, etc. that might be short only perhaps 30 million shares. They have a lesser ability to collateralize their naked short position as the PPS advances. They’ll typically cover first but they’re actually in the catbird seat because they can cover and then go net long if they know that an aircraft carrier that’s short maybe 400 million shares is in deep doo-doo. When there’s blood in the water on Wall Street all bets are off.
Aircraft carriers can’t turn on a dime and cover and go net long like the jet skiers can. At this point in the battle the jet skiers are ticked off at the aircraft carriers because they were probably “recruited” by the aircraft carriers to help finish off this “scammy” PinkSheet piece of gradu that turned out to be a little feistier than anticipated.
One thing about abusive naked short sellers is that they have discipline. They’ll cover when they know their goose is cooked. When you’re naked short thousands of development stage U.S. corporations the aircraft carriers only have “X” amount of net capital reserves to spread around to collateralize these “open positions”. If you “accidentally” ran up an immense naked short position but failed to kill your target you’re typically left with 3 options to still win the war. You can do whatever is needed to get your target delisted, bankrupt them or get their registration revoked. If Medinah lands a generous JV arrangement then all 3 of those options are gone.
Since abusive naked short sellers never really know how many other crooks are naked short the target then it sometimes becomes a race to beat the others to cover. Oftentimes the jet skiers have no choice in covering because the clearing firm they operate through starts sweating bullets because it is eventually on the hook for the failed delivery obligation. If the jet skiers do not supply much order flow to the clearing firm then they’re apt to be thrown under the bus. Clearing agreements always spell out that the clearing firm can buy-in those “open positions” whenever they so choose. Since the monetary value of all open naked short positions needs to be collateralized on a daily marked to market basis it’s usually financial constraints that lead to the covering.
When the goose is indeed cooked, a powerful option is lost to the crooks. When under duress the crooks can always transfer a naked short position “across the street” like a hot potato until the heat is off. Then it’s transferred back by another illegal “wash sale”. When the goose is cooked and everybody knows it there won’t be any willing co-conspirators to accept that transfer. The new FINRA Rule 4320 kicking in soon looks really nice. For the first time the CLEARING FIRM of the bad guys is handcuffed from misbehaving.
(from www.theminingplay.com, posted by Brecciaboy)
=================================================================
IS NSS TECHNICALLY “UNLAWFUL” OR “ILLEGAL”?
In regards to issues of “unlawfulness” or “illegalities” in the securities markets one has to go to the all encompassing anti-fraud rule within the ‘34 Exchange Act namely Rule 10b-5.
Rule 10b-5 -- Employment of Manipulative and Deceptive Devices
It shall be unlawful for any person, directly or indirectly, by the use of any means or instrumentality of interstate commerce, or of the mails or of any facility of any national securities exchange,
a. To employ any device, scheme, or artifice to defraud,
b. To make any untrue statement of a material fact or to omit to state a material fact necessary in order to make the statements made, in the light of the circumstances under which they were made, not misleading, or
c. To engage in any act, practice, or course of business which operates or would operate as a fraud or deceit upon any person,
in connection with the purchase or sale of any security.
=============================================================
The first concept to keep straight is that a technically “unlawful” act has nothing to do with whether or not that act is regularly prosecuted by the authorities. The DOJ or FBI usually need a referral from the SEC before they come on the scene. When it comes to abusive naked short selling crimes the SEC, FINRA, and the DTC and NSCC subdivisions of the DTCC are squarely in “cover up” mode. The last folks the regulators and the SROs want sniffing around is the DOJ, FBI or the FFETF [Financial Fraud Enforcement Task Force] with the power to put people in jail.
IS WHAT IS DESCRIBED BELOW AN “UNLAWFUL” SCHEME TO DEFRAUD DONE IN CONNECTION WITH THE SALE OF A SECURITY?
1) A corrupt MM illegally accesses the universally abused bona fide MM exemption from needing to effect a pre-borrow or “locate” before making admittedly naked short sales. He has no intent to ever deliver that which he is selling. Note that a truly bona fide MM that legally accesses that exemption would cover that naked short position on the very next downtick in share prices when the injection of buy-side liquidity is needed.
2) He sells nonexistent shares to a buyer but refuses to either deliver them or buy them back when the share price drops.
3) The buyer’s account is credited with a readily sellable share price depressing “security entitlement” as per UCC Article 8. Because of this the buyer is blindfolded to the deceit/fraud.
4) As these “refusals to deliver” and the “security entitlements” they spawn accumulate invisibly in the share structure of the corporation targeted for destruction the share price predictably tanks because the “supply” of that which must be treated as being readily sellable (shares and/or “security entitlements”) is knowingly and intentionally being manipulated upwards (scienter).
5) Since the NSCC only mandates that its “participants” collateralize the monetary value of failed delivery obligations on a daily marked to market basis as the share price drops (gets MANIPULATED downwards-a crime) so too do the collateralization requirements.
6) This results in the funds of the investor flowing to the MM that illegally accessed the bona fide MM exemption but refused to cover his naked short position on the very next downtick after the naked short sale was made as a truly bona fide MM would have. This flow of investor funds occurs despite the fact that what was sold never existed and never got delivered. With this being the NSCC policy, imagine the checks and balances that would be in place in a clearance and settlement system with integrity should abusive participants access this gold-plated invitation to defraud investors. The alarm bells would start sounding on about T+6 or so and forced buy-ins would rapidly occur.
Quite clearly this is an “unlawful scheme to defraud investors done in connection with the purchase and sale of a security”.
WHAT IS THE “SCHEME” TO DEFRAUD?
The “scheme” is to be able to sell nonexistent securities via illegally accessing the bona fide MM exemption and avoid the costs or potential unavailability associated with making legitimate pre-borrows in order to gain access to the funds of the investor without ever having to deliver the nonexistent shares you sold.
WAS THE BUYER OF THE SHARES DECEIVED OR DEFRAUDED?
The buyer was under the impression that he was buying and getting delivery of SEC-registered units of equity ownership (“shares”) in a corporation of which there are a finite amount “outstanding” as indicated on that company’s financials. He was deceived. He thought he was acquiring a voting power equal to the amount of shares he purchased divided by the number of shares advertised as being “outstanding” in the company’s 10-K. He didn’t get this. He thought he would earn preferential tax treatment for all of his shares on any “qualified dividend” the company issued. He will not get this as per IRS policies limiting the tax preferential treatment only to the number of shares legally “outstanding”.
He thought that the amount of shares readily sellable at any given time were just the number of shares “outstanding” plus any shares borrowed for the sake of legitimate short sales and subsequently sold. He was wrong. He thought that in the case of insolvency he had a valid claim to the percentage of assets calculated by dividing the number of shares “outstanding” by the number he purchased (dissolution rights). He was wrong. He thought that there were no parties on Wall Street heavily financially incentivized to bankrupt this company. He was mistaken. He thought that the DTCC was going to follow its congressional mandate to make sure that his trade would “promptly settle” i.e. buy-in the delivery failure on perhaps T+6 when it became obvious that the seller had no intent to deliver that which he sold. Again, he was deceived/defrauded.
AS PER SECTION “C” OF 10B-5 DOES THIS “COURSE OF BUSINESS…OPERATE AS A FRAUD OR DECEIT UPON ANY PERSON IN CONNECTION WITH THE PURCHASE OF A SECURITY”?
Of course it does.
WALL STREET’S REBUTTAL: STEALING THE FUNDS OF INVESTORS IN DEVELOPMENT STAGE U.S. CORPORATION ACTUALLY HAS ALTRUISTIC UNDERPINNINGS.
FACT: The most readily available supply of shares to borrow and then legally short sell come from margin accounts and institutional shareholders trying to earn a little margin interest to increase their “alpha”.
FACT: The nonmarginable “penny stocks” typically attacked do not have many if any shares in either location and are thus difficult or extremely expensive to legally short sell.
FACT: The best way to circumvent this reality is to work with crooked MMs willing to illegally access their bona fide MM exemption. Access is typically attainable by directing cash generating order flow in the direction of a willing MM.
THE MINDSET OF SOME ABUSIVE NAKED SHORT SELLERS: The destruction of certain U.S. corporations and the stealing of the funds of investors in companies that we abusive naked short sellers deem (in our infinite wisdom) to be “scams” is actually a good way to “hasten the demise” of these “scammy pump and dumps” so that future investors don’t get swindled by these scamsters. In other words, stealing from investors is a good way to address assumed stealing from investors and perpetrating a heinous form of securities fraud is the proper way to address suspected frauds.
The question arises; why not just file a complaint with the SEC in order to perform your “shareholder advocate” role.
Possible answer: That doesn’t pay as well.
ISSUES REGARDING SECTION b OF 10b-5 AND THOS MANDATED TO KEEP TALLIES OF DELIVERY FAILURES
Section b deals with facts of a “material” nature. It deems it unlawful to EITHER “make any untrue statement of a material fact or to omit to state a material fact necessary in order to make the statements made, in the light of the circumstances under which they were made, not misleading in connection with the purchase or sale of any security”.
In connection with the “full disclosure” of all “material” facts to prospective investors what fact could possibly be more “material” to the prognosis for the success of a potential investment then the presence of an enormous amount of share price depressing “security entitlements” poisoning the share structure and prognosis for success of a corporation?
Note that Section b makes it unlawful to omit to state a material fact. Who is or should be in possession of the combined number of delivery failures residing in either the DTCC or in “ex-clearing arrangements”? The answer is BOTH the NSCC as the party keeping the tally as well as FINRA mandated to receive the reports of the NSCC and construct and maintain the “threshold lists”.
The question arises as to how these 2 SROs mandated to act as “the first line of defense against market abuses” (as per the SEC) and also acting with the mandate to create and enforce laws associated with the “business conduct” of its “participants” in the case of the NSCC and “members” in the case of FINRA can refuse to keep this most “material” of all information secret from prospective investors.
The answer is simple, due to the levels of historical abuses our SROs and regulators are stuck in “cover up” mode and by definition you cannot be acting in robust investor protection mode and cover up mode simultaneously. What is at stake here is millions of U.S. citizens learning that many of the investments they have made throughout history in development stage corporations never had a chance to succeed. Instead the fates of these corporations, the jobs they could have provided and the investments made therein were thrown under the bus in exchange for some type of corrupt vigilante type service.
It is extremely obvious that in order to move from cover up mode where investors have no clue how damaged the corporation is that they are buying shares of back into robust investor protection mode an embarrassingly obvious event must occur. The sellers of nonexistent shares caught gaming the system must be FORCED to go into their wallet, retrieve the stolen money and buy back and deliver the shares they promised to deliver on T+3 but refused to.
The obviousness of this only solution and the refusal to demand it up until now has forever tarnished the integrity of our markets. Once the share price depressing “security entitlements” are forcibly removed from these corporate share structures then an unmanipulated “supply” variable can finally interact with an unmanipulated “demand” variable to “discover” an unmanipulated share price through the price discovery process. What could possibly be a more obvious remedy to finally reroute our SROs and regulators away from cover up mode and back into investor protection mode.
SUMMARY
Relatively defenseless nonmarginable “penny stocks” are the easiest for short sellers to bankrupt. The problem is that they are the most difficult to LEGALLY short sell since very few shares are held in margin accounts or by institutions willing to loan them out. Short sellers not afraid to act outside of the securities laws can easily find corrupt MMs to ILLEGALLY “rent out” space under their “bona fide MM” umbrella of immunity from having to pre-borrow or make a “locate” before making naked short sales. Avoiding either expensive or unavailable “pre-borrows” is often the inducement to break the law. The corrupt MMs are rewarded for their breaking of the law by cash generating order flow from the criminals refusing to play by the rules.
The added expense and difficulty to legally short sell development stage securities in a sense should add protection to these corporations that are relatively defenseless during their particular stage of development in these “corporate incubators” known as the PinkSheets and the OTCBB. It is also true that these circumstances could foster and promote “pump and dumps”. The concept that abusive naked short sellers justify stealing the funds of today’s investors in order to hasten the demise of corporations in order to protect future investors in that (allegedly) “scammy” corporation from being defrauded by corrupt management teams represents a pathological mindset beyond comprehension. At the very least, these criminals should carry some form of billion dollar “malpractice” insurance when their diagnosis that “X” U.S. corporation is a “scam” proves to be unfounded.
(from www.theminingplay.com, posted by Brecciaboy) Emphasis above is mine.
============================================================
thanks to camper9 .. brecciaboy and the miningplay.com for
the above posts .. wanted to combine all of the posts into
one for ease of access and reading on the NSS board
thanks to greg for the request :)
==
4kids
all jmo
DTCC Set To Launch Service To Automate Matching Of Broker-To-Broker Ex-Clearing Trades
-- Service Will Also Offer Real-Time Access to Track, Manage and Resolve Fails
New York, February 16, 2011- The Depository Trust & Clearing Corporation (DTCC) announced today plans to launch Obligation Warehouse (OW) to automate the matching and confirmation of broker-to-broker trades that are currently confirmed and settled directly between the trading parties rather than through DTCC (known as ex-clearing), and to give Member firms real-time access to track, manage and resolve their failed obligations.
The service, an offering of DTCC’s clearing agency subsidiary, National Securities Clearing Corporation (NSCC), is expected to be fully functional by June 2011, with implementation beginning in March 2011 following the Securities and Exchange Commission’s (SEC) recent approval of NSCC’s related rule filing.
“The OW represents a giant leap forward in helping financial firms better manage and address the operational risks and costs associated with processing broker-to-broker ex-clearing trades, as well as failed obligations,” said Susan Cosgrove, DTCC managing director, Clearance and Settlement/Equities. “It will create a more efficient and cost-effective system that will transform the processing of these transactions, while also delivering real-time capabilities to view virtually all failed trading activity in the U.S. marketplace for equities, corporates, municipals and unit investment trust securities.”
While most equity, bond and UIT trades are fed directly to NSCC for clearing from the various U.S. marketplaces and trading platforms, currently amounting to an average of more than 80 million daily transactions, there are an unknown number of trades that brokerage firms confirm and settle directly with their counterparties. Fails in those trades have never been tracked in a central location prior to the development of OW.
A Real-Time Automated Service
OW leverages NSCC’s existing systems and enhances its current fail clearance system, known as the Reconfirmation and Pricing Service (RECAPS), to automate the matching and confirmation of broker-to-broker ex-clearing trades, replacing the highly manual and error-prone processes, including phone calls and faxes, currently used by financial firms to manage these transactions.
In addition, OW will track, store and maintain certain unsettled obligations in a central location, and make these obligations available for RECAPS processing until they are settled, cancelled or otherwise closed in the system. Transactions eligible to be tracked, stored and maintained in OW include failed or unsettled broker-to-broker obligations that are compared through OW and obligations forwarded to OW from other NSCC services, including securities exited from NSCC’s Continuous Net Settlement (CNS), Non-CNS Automated Customer Account Transfer Service (ACATS) items and NSCC Balance Order transactions.
RECAPS processing of these transactions, which includes re-pricing, re-netting and allotting, will take place initially on a monthly basis instead of the current quarterly schedule. A new daily maintenance function will check the obligations stored in OW for CNS eligibility and will make adjustments for certain corporate actions. In addition, Member firms will no longer have to resubmit certain open obligations to RECAPS because OW will process RECAPS on all matched fails in OW aged greater than two days.
As part of the service, firms will also receive real-time updates, as well as an end-of-day report, that reflect their positions in OW.
A Collaborative Approach
NSCC worked closely with Member firms, service bureaus as well as the Securities Industry and Financial Markets Association’s (SIFMA) Securities Operations and Data Management Sections to help formulate the business requirements and development of OW.
“This collaborative approach allowed us to drill down to learn the unique needs of the industry and develop an enhanced service that closes the chapter on the manual processing of broker-to-broker trades and the management of open obligations,” Cosgrove said. “We added new functionality and features to further mitigate risk from the system, enhance transparency for financial firms and provide a comprehensive view to better understand these obligations in their totality.”
About DTCC
DTCC, through its subsidiaries, provides clearance, settlement and information services for equities, corporate and municipal bonds, government and mortgage-backed securities, money market instruments and over-the-counter derivatives. In addition, DTCC is a leading processor of mutual funds and insurance transactions, linking funds and carriers with their distribution networks. DTCC's depository provides custody and asset servicing for more than 3.6 million securities issues from the United States and 121 other countries and territories, valued at US$36.5 trillion. In 2010, DTCC settled nearly US$1.66 quadrillion in securities transactions. DTCC has operating facilities and data centers in multiple locations in the United States and overseas. For more information, please visit www.dtcc.com.
www.dtcc.com/news/press/releases/2011/press_release_obligation_whse.php
==
original post courtesy of janice shell
==
4kids
all jmo
NENE .. trading stats .. week ending 2/11/2011 Date Open High Low Close Volume SHORT % LATEST ROUND OF *SHORT* DATA FOR NENE 20110211|NENE|39687|141436|O 28% =================
02/11/11 1.70 1.72 1.60 1.64 141,436 28%
02/10/11 1.69 1.73 1.66 1.72 132,325 43.4%
02/09/11 1.71 1.71 1.60 1.66 211,967 21.5%
02/08/11 1.70 1.79 1.65 1.70 194,686 25.5%
02/07/11 1.71 1.75 1.70 1.73 204,065 45.9%
02/04/11 1.62 1.70 1.62 1.70 139,792 37.6%
02/03/11 1.77 1.78 1.57 1.63 280,121 35.8%
02/02/11 1.67 1.79 1.65 1.76 538,194 38.2%
02/01/11 1.34 1.75 1.15 1.68 1,987,715 21%
01/31/11 1.57 1.669 1.36 1.40 995,884 10.9%
01/28/11 1.78 1.79 1.65 1.68 617,297 22.5%
01/27/11 1.765 1.79 1.75 1.79 276,107 20.7%
01/26/11 1.86 1.89 1.75 1.77 522,264 28.7%
01/25/11 2.00 2.00 1.79 1.86 742,284 25.1%
01/24/11 2.05 2.06 2.00 2.02 332,633 15.1%
01/21/11 2.1025 2.11 2.03 2.05 153,489 27.2%
01/20/11 2.15 2.20 2.03 2.11 274,838 24.8%
01/19/11 2.10 2.20 2.07 2.17 265,925 43.7%
01/18/11 2.015 2.14 2.015 2.08 432,763 39%
01/14/11 2.04 2.07 2.00 2.02 267,878 31.3%
01/13/11 2.06 2.09 2.00 2.04 213,821 21.4%
01/12/11 2.09 2.16 2.05 2.07 165,025 41.3%
01/11/11 2.40 2.40 2.05 2.09 294,192 22%
01/10/11 2.055 2.07 2.00 2.02 297,399 36.3%
01/07/11 2.04 2.10 2.02 2.08 189,718 22.8%
01/06/11 2.24 2.25 2.03 2.09 440,742 37.8%
01/05/11 2.225 2.25 2.165 2.24 542,666 40.3%
01/04/11 2.08 2.25 2.02 2.18 1,383,723 30.8%
01/03/11 1.895 2.08 1.89 2.00 963,655 34.2%
Jan 31, 2011 758,528
Jan 14, 2011 826,245
Dec 31, 2010 794,921
Dec 15, 2010 604,319
Nov 30, 2010 592,026
Nov 15, 2010 449,963
Oct 29, 2010 176,110
Oct 15, 2010 63,935
20110210|NENE|57480|132325|O 43.4% =================
20110209|NENE|45754|211967|O 21.5% =================
20110208|NENE|47454|185686|O 25.5% (t trades = 9,000 shares)
20110207|NENE|93739|203965|O 45.9% (t trades = 100 shares)
20110204|NENE|52617|139792|O 37.6% =================
20110203|NENE|99980|279121|O 35.8% (t trades = 1,000 shares)
20110202|NENE|202808|530694|O 38.2% (t trades = 7,500 shares)
20110201|NENE|416663|1975665|O 21% (t trades = 12,050 shares)
20110131|NENE|108674|995884|O 10.9% ================
     20110128|NENE|137373|609697|O   22.5%  (t trades = 7,600 shares)
     20110127|NENE|57342|276107|O    20.7%  =================
     20110126|NENE|150236|522264|O   28.7%  =================
     20110125|NENE|186556|742284|O   25.1%  =================
     20110124|NENE|50284|332133|O    15.1%  (t trades = 500 shares)

     20110121|NENE|41881|153489|O    27.2%  =================
     20110120|NENE|68325|274838|O    24.8%  =================
     20110119|NENE|116428|265925|O   43.7%  =================
     20110118|NENE|168638|432563|O   39%    (t trades = 200 shares)

     20110114|NENE|83876|267878|O    31.3%   =================
     20110113|NENE|45786|213821|O    21.4%   =================
     20110112|NENE|68298|165025|O    41.3%   =================
     20110111|NENE|64558|294192|O    22%     =================
     20110110|NENE|107722|296299|O   36.3%  (t trades = 1,100 shares)

     20110107|NENE|43409|189718|O    22.8%   =================
     20110106|NENE|165767|437742|O   37.8%  (t trades = 3,000 shares)
     20110105|NENE|215149|533666|O   40.3%  (t trades = 9,000 shares)
     20110104|NENE|423286|1371923|O  30.8%  (t trades = 11,800 shares)
     20110103|NENE|329138|960155|O   34.2%  (t trades = 3,500 shares)
==
4kids
all jmo
HHWW .. trading stats .. week ending 2/11/2011 Date Open High Low Close Volume SHORT % Jan 31, 2011 996,675
02/11/11 0.92 0.95 0.92 0.94 106,359 17.2% ** again least volume since first 2 weeks newly trading
02/10/11 0.96 0.97 0.92 0.93 108,870 32% ** least volume since newly public 11/10
02/09/11 0.92 0.96 0.90 0.96 291,368 39% ** LAS VEGAS FASHION SHOW PR
02/08/11 0.955 0.96 0.90 0.91 587,423 28.1%
02/07/11 1.01 1.01 0.95 0.96 565,617 22.1%
02/04/11 1.04 1.04 1.00 1.00 692,390 26%
02/03/11 0.9075 1.04 0.90 1.039 1,803,367 40.6% ** PARIS UPDATE PR
02/02/11 1.225 1.225 0.84 0.9001 3,704,919 17.4%
02/01/11 1.205 1.23 1.19 1.21 915,942 13%
01/31/11 1.44 1.47 1.20 1.25 2,139,689 22.3%
01/28/11 1.83 1.83 1.33 1.44 1,949,870 18.3% ** most *volume* since 12/20/2010
01/27/11 1.845 1.85 1.84 1.85 630,928 9%
01/26/11 1.85 1.85 1.84 1.85 408,540 10.1%
01/25/11 1.845 1.86 1.84 1.85 511,230 14.2%
01/24/11 1.86 1.865 1.83 1.84 609,558 26.1%
01/21/11 1.865 1.87 1.83 1.85 559,578 40%
01/20/11 1.875 1.88 1.85 1.86 539,353 29.2%
01/19/11 1.895 1.90 1.82 1.855 1,548,765 30% ** PARIS FASHION WEEK PR
01/18/11 1.875 1.89 1.84 1.89 1,042,343 38.3%
01/14/11 1.81 1.85 1.80 1.85 936,455 56.2%
01/13/11 1.765 1.81 1.76 1.81 1,061,850 50.5%
01/12/11 1.95 1.99* 1.72 1.76 667,294 40%
01/11/11 1.725 1.73 1.72 1.725 425,165 14.6%
01/10/11 1.735 1.75 1.72 1.72 516,306 31.6%
01/07/11 1.71 1.74 1.71 1.74 529,874 40.2%
01/06/11 1.725 1.73 1.71 1.71 488,093 16.5%
01/05/11 1.715 1.73 1.71 1.72 440,097 29.2%
01/04/11 1.72 1.74 1.70 1.71 339,358 29.6%
01/03/11 1.71 1.74 1.70 1.72 668,092 32.1%
fyi .. and just one of the reasons why bear raid was done
which is why i posted a few weeks back to expect *volatility*
JAN 2011 ~ VOLUME TOTAL ~ 15,939,934
DEC 2010 ~ VOLUME TOTAL ~ 84,683,635
NOV 2010 ~ VOLUME TOTAL ~ 23,184,381
last but definitely not least .. HHWW's *short* info
Jan 14, 2011 960,333
Dec 31, 2010 1,102,058
Dec 15, 2010 1,372,531
Nov 30, 2010 373,131
Nov 15, 2010 17,500
http://www.otcbb.com/asp/OTCE_Short_Interest.asp
===
4kids
all jmo
JBII .. trading stats .. week ending ..2/11/2011 Date Open High Low Close Volume SHORT %
02/11/11 0.77 0.8788 0.77 0.85 47,806 29%
02/10/11 0.824 0.888 0.77 0.8388 77,249 29.3%
02/09/11 0.76 0.8498 0.76 0.77 117,105 40.1%
02/08/11 0.78 0.82 0.72 0.76 87,250 24.1%
02/07/11 0.80 0.888 0.76 0.80 36,205 59.3%
02/04/11 0.87 0.87 0.80 0.85 93,475 23.3%
02/03/11 0.895 0.90 0.845 0.8799 109,875 53.7%
02/02/11 0.92 0.94 0.87 0.88 225,396 17.7%
02/01/11 0.83 0.87 0.8031 0.87 99,279 29.2%
FEB 2011 ~ currently total shares traded ~ 893,640
01/31/11 0.82 0.83 0.80 0.83 53,733 35.7%
01/28/11 0.81 0.82 0.785 0.82 161,153 52%
01/27/11 0.815 0.83 0.80 0.81 22,610 79.3%
01/26/11 0.82 0.83 0.78 0.82 37,543 ===
01/25/11 0.80 0.82 0.791 0.82 108,230 28.2%
01/24/11 0.815 0.815 0.775 0.80 61,130 40.6%
01/21/11 0.794 0.82 0.771 0.815 78,942 30%
01/20/11 0.79 0.80 0.77 0.795 132,149 18.5%
01/19/11 0.77 0.79 0.761 0.79 100,943 33.5%
01/18/11 0.75 0.79 0.72 0.77 153,578 30.8%
01/14/11 0.68 0.75 0.68 0.75 89,264 71.2%
01/13/11 0.79 0.79 0.66 0.68 102,498 32.2%
01/12/11 0.69 0.69 0.66 0.675 45,961 24.5%
01/11/11 0.74 0.74 0.662 0.69 91,237 54.7%
01/10/11 0.80 0.80 0.70 0.7399 48,062 44.3%
01/07/11 0.74 0.74 0.70 0.719 89,455 10.2%
01/06/11 0.70 0.77 0.70 0.74 109,155 28.6%
01/05/11 0.77 0.80 0.71 0.73 64,338 22.6%
01/04/11 0.67 0.75 0.67 0.71 85,065 25.4%
01/03/11 0.65 0.67 0.65 0.67 96,008 12.2%
JAN 2011 ~ TOTAL VOLUME TRADED ~ 1,731,054 shares
12/31/10 0.57 0.66 0.54 0.65 325,552 22.7%
12/30/10 0.60 0.60 0.55 0.56 225,954 30.3%
12/29/10 0.60 0.60 0.54 0.58 219,868 23.4%
12/28/10 0.615 0.65 0.585 0.60 219,392 9.2%
12/27/10 0.70 0.70 0.605 0.69 112,852 3.2%
12/23/10 0.8475 0.895 0.65 0.70 356,969 33.3%
12/22/10 0.83 0.86 0.79 0.85 279,657 37.8%
12/21/10 0.86 0.86 0.77 0.7711 301,917 29.6%
12/20/10 0.89 0.89 0.76 0.76 184,651 34.7%
12/17/10 0.94 1.01 0.77 0.83 473,413 28.5%
12/16/10 0.86 1.35 0.78 0.92 1,546,137 33.3%
12/15/10 0.52 0.77 0.51 0.77 895,815 32.0%
DEC 2010 ~ TOTAL VOLUME TRADED ~ 6,242,313 shares
==
4kids
all jmo
EXPH trading stats .. week ending 2/11/2011 Date Open High Low Close Volume SHORT % EXPH OCT 2010 - FEB 2011 ~ OS & AS INFO
02/11/11 0.0001 0.0001 0.0001 0.0001 77,798,340 49.2% (RS 2nd full day NO BID 2.3M shares at .00089)
02/10/11 0.0001 0.0001 0.0001 0.0001 26,509,999 96.6% (RS first full day exph NO BID .. all trades at .0001)
02/09/11 0.0002 0.0002 0.0001 0.0001 49,104,998 69.8% (RS only 1M shares were done at ask .0002)
02/08/11 0.0001 0.0002 0.0001 0.0002 8,125,000 61.5% (RS only 125,000 shares were done at ask .0002)
02/07/11 0.0001 0.0002 0.0001 0.0002 280,764,272 58.6% (RS only 250,000 shares were done at ask .0002)
02/04/11 0.0001 0.0001 0.0001 0.0001 37,000,000 91.8% (RS every trade at bid .0001 except 3M at bid .0001)
02/03/11 0.0002 0.0002 0.0001 0.0001 13,193,000 93.6% (RS every trade at the ask .0002 except one duped 500k trade)
02/02/11 0.0001 0.0002 0.0001 0.0001 10,982,300 27.1% (RS every trade at ask .0002)
02/01/11 0.0002 0.0002 0.0001 0.0001 2,126,000 53% (RS every trade at ask .0002)
01/31/11 0.0001 0.0002 0.0001 0.0001 2,446,000 62.7% (RS every trade at ask .0002 except 10k signal trade)
01/28/11 0.0001 0.0002 0.0001 0.0001 7,159,780 34.2% (RS every trade at ask .0002)
01/27/11 0.0002 0.0002 0.0001 0.0001 22,950,00 95.8% (RS every trade at ask .0002)
01/26/11 0.0001 0.0001 0.0001 0.0001 3,155,040 === (all trades done at .0001)
01/25/11 0.0002 0.0002 0.0002 0.0002 500,000 100% (RS every trade at ask .0002)
01/24/11 0.0001 0.0002 0.0001 0.0002 18,160,250 97.6% (RS every trade at ask .0002)
01/21/11 0.0002 0.0002 0.0002 0.0002 13,708,692 100%
01/20/11 0.0002 0.0002 0.0001 0.0001 4,401,000 99.97%
01/19/11 0.0002 0.0002 0.0001 0.0001 29,952,130 99.3%
01/18/11 0.0001 0.0002 0.0001 0.0001 4,051,175 98.7%
01/14/11 0.0001 0.0002 0.0001 0.0002 21,385,260 96.7%
01/13/11 0.0001 0.0002 0.0001 0.0001 182,580,710 96.6%
01/12/11 0.0001 0.0001 0.0001 0.0001 101,407,556 98.6%
01/11/11 0.0002 0.0002 0.0001 0.0002 9,145,556 99.5%
01/10/11 0.0002 0.0002 0.0002 0.0002 30,000 100%
01/07/11 0.0002 0.0002 0.0002 0.0002 9,947,750 100%
01/06/11 0.0001 0.0002 0.0001 0.0002 10,685,500 2.8% **
01/05/11 0.0001 0.0001 0.0001 0.0001 4,999,995 ===
01/04/11 0.0001 0.0002 0.0001 0.0002 157,006 79.6%
01/03/11 0.0002 0.0002 0.0001 0.0001 6,371,724 97.3%
for JAN 2011 ~ 20 days traded .. TOTAL VOLUME = 453,195,124
exph closes *even* = 11 days
exph closes *down* = 5 days
exph closes *up* = 4 days
RS days running 62% + = 16
RS days running below 35% = 4
====
OCTOBER 21, 2010 ~ 1.973.987.656 (AS = 2B)
OCTOBER 22, 2010 ~ 2.047.945.311 (AS = 2.050B)
NOVEMBER 03, 2010 ~ 2.047.945.311 (AS = 2.050B)
NOVEMBER 04, 2010 ~ 2.189.048.732 (AS = 2.2B)
NOVEMBER 16, 2010 ~ 2.189.048.732 (AS = 2.2B)
NOVEMBER 17, 2010 ~ 2.355.715.398 (AS = 2.4B)
NOVEMBER 26, 2010 ~ 2.355.715.398 (AS = 2.4B)
NOVEMBER 29, 2010 ~ 2.355.715.398 (AS NV 2.560 TA 2.4B)
DECEMBER 03, 2010 ~ 2.355.715.398 (AS NV 2.560 TA 2.4B)
DECEMBER 07, 2010 ~ 2.355.715.398 (AS NV 2.560 TA 2.4B)
DECEMBER 08, 2010 ~ 2.556.802.354 (AS 2.560)
DECEMBER 10, 2010 ~ 2.556.802.354 (AS 2.560)
DECEMBER 15, 2010 ~ 2.556.802.354 (AS 2.560)
DECEMBER 16, 2010 ~ 2.779.024.576 (AS 2.8B)
DECEMBER 22, 2010 ~ 2.779.024.576 (AS 2.8B)
DECEMBER 28, 2010 ~ 2.779.024.576 (AS NV 3.1B TA 2.8B)
DECEMBER 31, 2010 ~ 2.779.024.576 (AS NV 3.1B TA 2.8B)
JANUARY 07, 2011 ~ 2.779.024.576 (AS NV 3.1B TA 2.8B)
JANUARY 10, 2011 ~ 2.779.024.576 (AS NV 3.1B TA 2.8B)
JANUARY 11, 2011 ~ 3.052.997.178 (AS 3.1B)
JANUARY 12, 2011 ~ 3.052.997.178 (AS 3.1B)
JANUARY 13, 2011 ~ 3.052.997.178 (AS 3.1B)
JANUARY 21, 2011 ~ 3.052.997.178 (AS 3.1B)
FEBRUARY 1, 2011 ~ 3.053.997.178 (AS NV 3.33B TA 3.1B)
FEBRUARY 2, 2011 ~ 3.053.997.178 (AS NV 3.33B TA 3.1B)
FEBRUARY 3, 2011 ~ 3.325.724.450 (AS 3.33B)
FEBRUARY 7, 2011 ~ 3.325.724.450 (AS 3.33B)
FEBRUARY 11, 2011 ~ 3.325.724.450 (AS 3.33B)
============
and one last bit of data .. epxh's closing pps/volume since
9/30/2009 ~ 01/31/2011
Date Open High Low Close Volume
01/31/11 0.0001 0.0002 0.0001 0.0001 2,446,000
12/31/10 0.0001 0.0002 0.0001 0.0002 9,560,295
11/30/10 0.0002 0.0002 0.0001 0.0002 20,434,477
10/29/10 0.0004 0.0006 0.0004 0.0006 30,848,954
09/30/10 0.0006 0.0008 0.0006 0.0008 19,117,500
08/31/10 0.0017 0.0019 0.0015 0.0018 17,006,717
07/30/10 0.0005 0.0005 0.0004 0.0005 22,767,174
06/30/10 0.0005 0.0005 0.0004 0.0005 19,336,500
05/28/10 0.0006 0.0007 0.0005 0.0006 7,963,785
04/30/10 0.001 0.0011 0.0009 0.001 67,856,017
03/31/10 0.0012 0.0012 0.001 0.0012 9,820,090
02/26/10 0.0022 0.0026 0.002 0.0026 2,671,150
01/29/10 0.0029 0.0031 0.0028 0.0029 2,823,606
12/31/09 0.004 0.004 0.0035 0.0035 2,678,990
11/30/09 0.0073 0.0074 0.0069 0.0072 4,771,260
10/30/09 0.0067 0.0082 0.0066 0.0078 28,627,473
09/30/09 0.01 0.0104 0.0095 0.0098 26,320,045
link back for prior month's trading stats on EXPH if interested
===
4kids
all jmo
NENE .. trading stats .. week ending 1/28/2011 Date Open High Low Close Volume SHORT % LATEST ROUND OF *SHORT* DATA FOR NENE 20110128|NENE|137373|609697|O 22.5% (t trades = 7,600 shares)
01/28/11 1.78 1.79 1.65 1.68 617,297 22.5%
01/27/11 1.765 1.79 1.75 1.79 276,107 20.7%
01/26/11 1.86 1.89 1.75 1.77 522,264 28.7%
01/25/11 2.00 2.00 1.79 1.86 742,284 25.1%
01/24/11 2.05 2.06 2.00 2.02 332,633 15.1%
01/21/11 2.1025 2.11 2.03 2.05 153,489 27.2%
01/20/11 2.15 2.20 2.03 2.11 274,838 24.8%
01/19/11 2.10 2.20 2.07 2.17 265,925 43.7%
01/18/11 2.015 2.14 2.015 2.08 432,763 39%
01/14/11 2.04 2.07 2.00 2.02 267,878 31.3%
01/13/11 2.06 2.09 2.00 2.04 213,821 21.4%
01/12/11 2.09 2.16 2.05 2.07 165,025 41.3%
01/11/11 2.40 2.40 2.05 2.09 294,192 22%
01/10/11 2.055 2.07 2.00 2.02 297,399 36.3%
01/07/11 2.04 2.10 2.02 2.08 189,718 22.8%
01/06/11 2.24 2.25 2.03 2.09 440,742 37.8%
01/05/11 2.225 2.25 2.165 2.24 542,666 40.3%
01/04/11 2.08 2.25 2.02 2.18 1,383,723 30.8%
01/03/11 1.895 2.08 1.89 2.00 963,655 34.2%
Jan 14, 2011 826,245
Dec 31, 2010 794,921
Dec 15, 2010 604,319
Nov 30, 2010 592,026
Nov 15, 2010 449,963
Oct 29, 2010 176,110
Oct 15, 2010 63,935
nothing like having the *ability* to *trade* smoke and mirrors
total *illusion* being done on NENE .. next round of *short* data
is due out on 2/9/2011 for trades settled as of 1/31/2011
LINK
20110127|NENE|57342|276107|O 20.7% =================
20110126|NENE|150236|522264|O 28.7% =================
20110125|NENE|186556|742284|O 25.1% =================
20110124|NENE|50284|332133|O 15.1% (t trades = 500 shares)
20110121|NENE|41881|153489|O 27.2% =================
20110120|NENE|68325|274838|O 24.8% =================
20110119|NENE|116428|265925|O 43.7% =================
20110118|NENE|168638|432563|O 39% (t trades = 200 shares)
20110114|NENE|83876|267878|O 31.3% =================
20110113|NENE|45786|213821|O 21.4% =================
20110112|NENE|68298|165025|O 41.3% =================
20110111|NENE|64558|294192|O 22% =================
20110110|NENE|107722|296299|O 36.3% (t trades = 1,100 shares)
20110107|NENE|43409|189718|O 22.8% =================
20110106|NENE|165767|437742|O 37.8% (t trades = 3,000 shares)
20110105|NENE|215149|533666|O 40.3% (t trades = 9,000 shares)
20110104|NENE|423286|1371923|O 30.8% (t trades = 11,800 shares)
20110103|NENE|329138|960155|O 34.2% (t trades = 3,500 shares)
==
4kids
all jmo
HHWW trading stats .. week ending 1/28/2011 Date Open High Low Close Volume SHORT %
first *short* info put out 2X a month (courtesy of finra)
sadly 2 weeks in arrears .. which is why i show the daily
reg sho data out of finra .. 'cos patterns are clearly visible
when coupled with *volume* and pps ranges :)
Jan 15, 2011 ~ 960,333
Dec 31, 2010 ~ 1,102,058
Dec 15, 2010 ~ 1,372,531
Nov 30, 2010 ~ 373,131
Nov 15, 2010 ~ 17,500
POST WITH LINK
second .. this week's stats followed by prior JAN 2011 data
link back to see december's data and november's data
as i've mentioned HHWW is so easy to track since it's so new
notice the churn (ie the stock's pps holds an incredibly tight
channel) for well over a week of approx 4 cents or less *regardless*
of what volume shows .. notice specifically from the 20th
of jan onwards .. now this is where understanding why *what*
is done .. matters
a few points .. MGMT pr'd that they were attending the paris fashion show .. that was on the JAN 19th
PR LINK
now why does that matter .. google that event and it becomes clear
couple that event with co.s *legitimacy* and an *ungagged* TA
who will email SS upon request (here's a hint it hasn't changed
since the co. came public in NOV 2010 .. filings show *float*
is just over 31M+ shares and *HHWW* investors fully understand
that 28M+ *traded* in just 2 days by the cretins who illegally
manipulate stock) .. however since there has been zero by way
of dilution .. that can't be *posted* about repeatedly
TA's INFO 1/28/2011
one last aspect .. there is a 3 day *settlement* (presuming these
trades are just the usual garbage of ex-clearing and *resets*)
which imo *most* indeed were
which means yesterday's *trades* won't even show until late FEB
on that oh so *current* data put out by FINRA LINK
meaning they can bear raid at any point in time ~ BUT they give and
leave clues re: intent .. plus the clock is always ticking
they have zero knowledge of what MGMT will execute and when
beyond basics (fins filed)
there is no trick ever missed in this rigged game ... which is why
i had a GTC set and will have another one in place within 2 weeks
01/28/11 1.83 1.83 1.33 1.44 1,949,870 18.3% ** most *volume* since 12/20/2010
01/27/11 1.845 1.85 1.84 1.85 630,928 9%
01/26/11 1.85 1.85 1.84 1.85 408,540 10.1%
01/25/11 1.845 1.86 1.84 1.85 511,230 14.2%
01/24/11 1.86 1.865 1.83 1.84 609,558 26.1%
01/21/11 1.865 1.87 1.83 1.85 559,578 40%
01/20/11 1.875 1.88 1.85 1.86 539,353 29.2%
01/19/11 1.895 1.90 1.82 1.855 1,548,765 30% PR issued re: PARIS
01/18/11 1.875 1.89 1.84 1.89 1,042,343 38.3%
01/14/11 1.81 1.85 1.80 1.85 936,455 56.2%
01/13/11 1.765 1.81 1.76 1.81 1,061,850 50.5%
01/12/11 1.95 1.99* 1.72 1.76 667,294 40%
01/11/11 1.725 1.73 1.72 1.725 425,165 14.6%
01/10/11 1.735 1.75 1.72 1.72 516,306 31.6%
01/07/11 1.71 1.74 1.71 1.74 529,874 40.2%
01/06/11 1.725 1.73 1.71 1.71 488,093 16.5%
01/05/11 1.715 1.73 1.71 1.72 440,097 29.2%
01/04/11 1.72 1.74 1.70 1.71 339,358 29.6%
01/03/11 1.71 1.74 1.70 1.72 668,092 32.1%
* the open and high on 1/12/11 were done at open and
the *high* of 1.99 was on 100 shares .. there were 3
trades done (for a total of 800 shares) right at mkt open
09:30:00 200 1.95
09:30:00 500 1.97
09:30:00 100 1.99
===
link back for prior data/stats
==
4kids
all jmo
JBII .. trading stats .. week ending 1/28/2011 Date Open High Low Close Volume SHORT %
JBI appoints Ernst & Young LINK
01/28/11 0.81 0.82 0.785 0.82 161,153 52%
01/27/11 0.815 0.83 0.80 0.81 22,610 79.3%
01/26/11 0.82 0.83 0.78 0.82 37,543 ===
01/25/11 0.80 0.82 0.791 0.82 108,230 28.2%
01/24/11 0.815 0.815 0.775 0.80 61,130 40.6%
01/21/11 0.794 0.82 0.771 0.815 78,942 30%
01/20/11 0.79 0.80 0.77 0.795 132,149 18.5%
01/19/11 0.77 0.79 0.761 0.79 100,943 33.5%
01/18/11 0.75 0.79 0.72 0.77 153,578 30.8%
01/14/11 0.68 0.75 0.68 0.75 89,264 71.2%
01/13/11 0.79 0.79 0.66 0.68 102,498 32.2%
01/12/11 0.69 0.69 0.66 0.675 45,961 24.5%
01/11/11 0.74 0.74 0.662 0.69 91,237 54.7%
01/10/11 0.80 0.80 0.70 0.7399 48,062 44.3%
01/07/11 0.74 0.74 0.70 0.719 89,455 10.2%
01/06/11 0.70 0.77 0.70 0.74 109,155 28.6%
01/05/11 0.77 0.80 0.71 0.73 64,338 22.6%
01/04/11 0.67 0.75 0.67 0.71 85,065 25.4%
01/03/11 0.65 0.67 0.65 0.67 96,008 12.2%
12/31/10 0.57 0.66 0.54 0.65 325,552 22.7%
12/30/10 0.60 0.60 0.55 0.56 225,954 30.3%
12/29/10 0.60 0.60 0.54 0.58 219,868 23.4%
12/28/10 0.615 0.65 0.585 0.60 219,392 9.2%
12/27/10 0.70 0.70 0.605 0.69 112,852 3.2%
12/23/10 0.8475 0.895 0.65 0.70 356,969 33.3%
12/22/10 0.83 0.86 0.79 0.85 279,657 37.8%
12/21/10 0.86 0.86 0.77 0.7711 301,917 29.6%
12/20/10 0.89 0.89 0.76 0.76 184,651 34.7%
12/17/10 0.94 1.01 0.77 0.83 473,413 28.5%
12/16/10 0.86 1.35 0.78 0.92 1,546,137 33.3%
12/15/10 0.52 0.77 0.51 0.77 895,815 32.0%
===
20110128|JBII|83746|161153|O 52%
0110127|JBII|17950|22610|O 79.3%
20110126|JBII|100|34495|O imo statistically irrelevant
20110125|JBII|30525|108230|O 28.2%
20110124|JBII|24860|61130|O 40.6%
20110121|JBII|23750|78942|O 30%
20110120|JBII|24038|129649|O 18.5% (2500 bypassed t trades)
20110119|JBII|33890|100943|O 33.5%
20110118|JBII|47339|153578|O 30.8%
20110114|JBII|63556|89264|O 71.2%
20110113|JBII|32325|100098|O 32.2% (2400 bypassed t trades)
20110112|JBII|11277|45961|O 24.5%
20110111|JBII|49943|91237|O 54.7%
20110110|JBII|21327|48062|O 44.3%
20110107|JBII|9068|88455|O 10.2% (1000 bypassed t trades)
20110106|JBII|31229|109155|O 28.6%
20110105|JBII|14583|64338|O 22.6%
20110104|JBII|21635|85065|O 25.4%
20110103|JBII|11730|96008|O 12.2%
20101231|JBII|73477|323552|O 22.7%
20101230|JBII|68650|225954|O 30.3%
20101229|JBII|51506|219868|O 23.4%
20101228|JBII|20273|219392|O 9.2%
20101227|JBII|3700|112852|O 3.2%
20101223|JBII|118145|354469|O 33.3% (2500 bypassed t trades)
20101222|JBII|105926|279657|O 37.8%
20101221|JBII|89667|301917|O 29.6%
20101220|JBII|64089|184651|O 34.7%
20101217|JBII|133036|465913|O 28.5% (7500 bypased t trades)
20101216|JBII|514025|1539032|O 33.3% (7105 bypassed t trades)
20101215|JBII|285529|889815|O 32.0% (6000 bypassed t trades)
link back for prior data/stats/info
==
have a good weekend jbii longs :)
==
4kids
all jmo
EXPH trading stats .. week ending 1/28/2011 Date Open High Low Close Volume SHORT %
01/28/11 0.0001 0.0002 0.0001 0.0001 7,159,780 34.2% (RS every trade at ask .0002)
01/27/11 0.0002 0.0002 0.0001 0.0001 22,950,00 95.8% (RS every trade at ask .0002)
01/26/11 0.0001 0.0001 0.0001 0.0001 3,155,040 === (all trades done at .0001)
01/25/11 0.0002 0.0002 0.0002 0.0002 500,000 100% (RS every trade at ask .0002)
01/24/11 0.0001 0.0002 0.0001 0.0002 18,160,250 97.6% (RS every trade at ask .0002)
01/21/11 0.0002 0.0002 0.0002 0.0002 13,708,692 100%
01/20/11 0.0002 0.0002 0.0001 0.0001 4,401,000 99.97%
01/19/11 0.0002 0.0002 0.0001 0.0001 29,952,130 99.3%
01/18/11 0.0001 0.0002 0.0001 0.0001 4,051,175 98.7%
01/14/11 0.0001 0.0002 0.0001 0.0002 21,385,260 96.7%
01/13/11 0.0001 0.0002 0.0001 0.0001 182,580,710 96.6%
01/12/11 0.0001 0.0001 0.0001 0.0001 101,407,556 98.6%
01/11/11 0.0002 0.0002 0.0001 0.0002 9,145,556 99.5%
01/10/11 0.0002 0.0002 0.0002 0.0002 30,000 100%
01/07/11 0.0002 0.0002 0.0002 0.0002 9,947,750 100%
01/06/11 0.0001 0.0002 0.0001 0.0002 10,685,500 2.8% **
01/05/11 0.0001 0.0001 0.0001 0.0001 4,999,995 ===
01/04/11 0.0001 0.0002 0.0001 0.0002 157,006 79.6%
01/03/11 0.0002 0.0002 0.0001 0.0001 6,371,724 97.3%
19 days trading so far JAN 2011//IS IT OBVIOUS YET
exph closes *even* = 10 days
exph closes *down* = 5 days
exph closes *up* = 4 days
days running 79% + = 15
days running below 35% = 4
can't wait to see what *shows* for volume on monday
either *volume* will be high as in 200M or so .. or
if *none* per se .. data shown at end of february
will be telling
link back for prior data if interested
==
4kids
all jmo
follow on re: GBOE
==
tom favata
Share
Wednesday, January 26, 2011 1:14:51 PM
Re: tom favata post# 15502 Post # of 15507
7. Holders of GeoBio shares correctly inferred from this information that a mistake had been made and that someone had mistakenly sold vastly more GeoBio shares than they could possibly have been held, and as a result was in a large, naked short position. In response to that information, the market price of GeoBio shares skyrocketed. In the 10 trading days subsequent to Scottrade’s mistaken offer, GeoBio shares have traded at prices more than 150 times greater than the prices at which the sales resulting from Scottrade’s mistaken offers were effected. Case 4:10-cv-02380-HEA Document 1 Filed 12/20/10 Page 2 of 11
- 3 -
8. When Knight accepted Scottrade’s mistaken offers, either (a) both Scottrade and Knight were mistaken about material facts concerning their transactions or (b) Scottrade was unilaterally mistaken concerning such matters and Knight knew or reasonably should have known of Scottrade’s mistaken belief.
9. In all events, as a matter of equity the transactions in question should be rescinded.
II. Jurisdiction and Venue
10. This Court has subject matter jurisdiction over the matter pursuant to 28 U.S.C. §1332 in that the matter in controversy exceeds the sum or value of $75,000, exclusive of interest and costs, and is between citizens of different states.
11. Venue is proper in this District pursuant to 28 U.S.C. §1391(a)(2), in that a substantial part of the events giving rise to the claim occurred in this District.
12. This Court has personal jurisdiction over Knight because Knight is registered in Missouri as a broker-dealer of securities, and this action arises out of Knight’s business as a securities broker-dealer.
III. The Parties
13. Scottrade is an online broker-dealer of securities. It is a corporation organized under the laws of the State of Arizona and has its corporate headquarters and principal place of business in St. Louis, Missouri.
14. Knight is also a securities broker-dealer. It is a limited partnership organized under the laws of the State of Delaware, and has its headquarters and principal place of business in Jersey City, New Jersey. Knight’s general partner, Knight Securities General, Inc., is a corporation organized under Delaware law having its principal offices and place of business in
Case 4:10-cv-02380-HEA Document 1 Filed 12/20/10 Page 3 of 11
- 4 -
New Jersey. Knight’s limited partner, Knight Securities Operations, Inc., is likewise a corporation organized under Delaware law having its headquarters and principal place of business in New Jersey. Neither Knight nor its partners are citizens of Missouri or Arizona. Knight is a market maker for the common shares of GeoBio, and one of the leading market makers, if not the leading market maker, for ?Pink Sheets? stocks generally.
IV. Facts
15. GeoBio is a corporation organized under the laws of Colorado having its principal offices and place of business in Seattle, Washington. It is reportedly a ?development stage company? which ?operates as a biodiesel supply and distribution company in the United States.?
16. In fact, GeoBio has no meaningful business operations at the present time. It has not reported even $1 in sales during any of the last three years, and has reportedly accumulated losses in excess of $20 million. Its reported shareholders’ equity (as of June 30, 2010) was negative $2.18 million.
17. Prior to December 1, 2010, GeoBio reportedly had issued and outstanding at least 11,573,807,619 common shares. These shares were publicly traded in the over-the-counter securities market commonly known as the ?Pink Sheets.?
18. In September, 2010, GeoBio announced that it was effecting a ?reverse recapitalization?—i.e., a reverse stock split . GeoBio subsequently reported in a Definitive Schedule 14-C filed with the U.S. Securities and Exchange Commission on October 20, 2010, that one effect of the reverse recapitalization would be to reduce the total number of issued and outstanding common shares by a factor of 5,500 – i.e., from 11,573,807,619 shares to 2,104,329 shares. Case 4:10-cv-02380-HEA Document 1 Filed 12/20/10 Page 4 of 11
- 5 -
19. According to a press release issued by GeoBio (Ex. 1, annexed hereto), the reverse recapitalization was completed on December 1, 2010, and upon completion, GeoBio had 2,486,314 common shares issued and outstanding.
20. GeoBio’s press release describes the transaction as a ?5,500:1 reverse recapitalization.?
21. Most commonly, when stock splits are described by use of a numeric ratio, the first number stated in the ratio represents the number of ?new? shares to be exchanged for the quantity of ?old? shares, and the second number stated represents the number of ?old? shares to be exchanged for ?new? shares. Thus, when a company engages in a forward split in which shareholders will end up with two shares for each currently held share, the split is usually described as a ?2:1? or a ?2 for 1? split. When a company engages in a reverse split in which shares holders will receive one new share for each five thousand five hundred old shares, the split would usually be described as a ?1:5,500? or a ?1 for 5,500? split.
22. Between August 20, 2010 (i.e., shortly before the announcement of GeoBio’s reverse recapitalization) and November 30, 2010 (the day preceding the effective date of the reverse recapitalization) the highest volume of trading in GeoBio common shares on any given day was less than 110,000 (split adjusted) shares.
23. No transactions in GeoBio shares were reported on Wednesday, December 1, 2010 or Friday, December 3, 2010. On Thursday, December 2, 2010, transactions involving 3,534 (post-split) GeoBio shares were reported. The closing price of GeoBio shares on December 2, 2010 was $0.065/share.
24. Immediately prior to the effective date of the recapitalization, Scottrade held 1,937,654,280 common shares of GeoBio for the accounts of Scottrade customers. The actual
Case 4:10-cv-02380-HEA Document 1 Filed 12/20/10 Page 5 of 11
- 6 -
effect of the reverse recapitalization was to reduce the number of GeoBio common shares held by Scottrade for its customer’s accounts to approximately 352,300 shares.
25. At approximately 11 a.m. Central Standard Time on Monday, December 6, 2010, a Scottrade employee responsible for making entries in Scottrade’s data processing system to reflect the changes in Scottrade’s customers’ holdings of GeoBio shares due to the reverse recapitalization mistakenly entered data in a way that caused Scottrade’s records to indicate that such holdings had increased by a factor of 5,500, rather than decreased by a factor of 5,500.
26. Due to this mistake, at approximately 11:01 a.m. (CST) on December 6, 2010, Scottrade’s records reflected that it held over ten trillion GeoBio shares (specifically, 10,657,098,540,000), Scottrade’s customers whose accounts held GeoBio common shares who viewed their accounts on line at that time would have seen data indicating that their account now held 5,500 times more GeoBio common shares than were reflected pre-reverse split. The displayed quantity of shares was over thirty million times greater than the actual quantity of GeoBio shares held for the customer’s accounts (post-split).
27. There were no reported trades in GeoBio common shares on December 6, 2010 until after 11:05 a.m. (CST).
28. Between 11:02 a.m. and 11:18 a.m. on December 6, a number of Scottrade customers entered limit orders to sell some or all of their holdings of GeoBio shares. In the aggregate, Scottrade received customer orders to sell nearly three billion GeoBio common shares during this period.
29. Based on these orders, between 11:05 a.m. (CST) and 11:18 a.m. on December 6, 2010, Scottrade delivered to Knight offers to sell approximately 2.85 billion GeoBio common shares in six lots. Each lot was offered to Knight on terms such that a person knowledgeable
Case 4:10-cv-02380-HEA Document 1 Filed 12/20/10 Page 6 of 11
- 7 -
about GeoBio and the market for its shares should have known that either or both the quantity or the price at which the offer was made was wildly inconsistent with the market for GeoBio shares.
30. When Scottrade tendered and Knight received those offers, there were less than 2.5 million shares of GeoBio common stock issued and outstanding.
31. Between 11:05 a.m. and 11:18 a.m. (CST) on December 6, 2010, Knight accepted Scottrade’s offers to sell approximately 3.38 million GeoBio common shares.
32. Knight agreed to ?bust? (i.e., to rescind) one trade involving 726,110 GeoBio common shares.
33. At present, the contracts apparently formed when Knight accepted Scottrade’s mistaken offers on December 6, 2010 (and not otherwise resolved since then) oblige Scottrade to deliver to Knight approximately 2.6 million GeoBio common shares at an average price of $0.0068/share.
34. Scottrade’s transactions with Knight and another GeoBio market maker resulted in sales of approximately 19 million GeoBio common shares, or roughly eight times the quantity of GeoBio common shares actually issued and outstanding, being reported as occurring during a time span of roughly 13 minutes on December 6, 2010.
35. Since learning of its mistake and initiating corrective action, Scottrade has been able to resolve the apparent obligations arising from the acceptances of its offers to sell many of the GeoBio common shares involved in the reported transactions.
36. Knight has, however, issued ?buy-in? notices to Scottrade respecting the unresolved transactions. Knight’s most recent buy-in notices indicate that Scottrade is obliged to deliver 2,599,427 GeoBio common shares to Knight, and, failing such delivery, that Knight intends to ?buy-in? the shares. Case 4:10-cv-02380-HEA Document 1 Filed 12/20/10 Page 7 of 11
- 8 -
37. The market has learned of the apparent short position in GeoBio shares resulting from the acceptances of Scottrade’s offers to sell. Some market participants have attempted to capitalize upon the obviously mistaken trades that occurred between 11:05 a.m. and 11:18 am (CST) on December 6, 2010. Since 11:18 a.m. (CST), the market price for GeoBio shares has been extremely volatile, with prices ranging from $0.0051 per share to $1.15 per share.
38. Knight is actively participating in the market for GeoBio common shares.
COUNT I
39. Scottrade incorporates by reference the allegations of paragraphs 1 – 38, above, as though the same were fully set forth herein.
40. At the times Scottrade offered GeoBio shares for sale on behalf of its customers on December 6, 2010, it was operating under a mistaken belief as to the following material facts:
a. That it held for its customers accounts common shares of GeoBio in quantities that were more than sufficient to enable Scottrade to settle any trades resulting from acceptance of its offers by delivering GeoBio shares already held by Scottrade for the accounts of its customers;
b. That its offers to sell GeoBio shares on December 6, 2010, involved fewer shares than the quantity of GeoBio shares issued and outstanding on December 6, 2010; and
c. That the price at which it offered to sell the shares was reasonable in light of the prevailing market prices for such shares.
41. Scottrade is informed and believes that when Knight accepted Scottrade’s offers to sell GeoBio common shares on December 6, 2010, Knight either:
a. Was likewise mistaken concerning: (1) the relationships between and among (i) the numbers of GeoBio common shares offered for sale by Scottrade (2.85 billion), (ii)
the number of shares then held by Scottrade for the accounts of its customers, and (iii) the number of GeoBio common shares then issued and outstanding (2.5 million), and (2) the relationship between the prevailing market prices for GeoBio common shares and the prices at which Scottrade was offering to sell such shares; or
b. Knew or should have known that Scottrade was operating under a mistaken belief concerning: (1) the relationships between (i) the numbers of GeoBio common shares offered for sale by Scottrade, (ii) the number of shares Scottrade could have conceivably then held for the accounts of its customers, and (iii) the number of GeoBio common shares then issued and outstanding, as well as (2) the relationships between the prevailing market prices for GeoBio common shares and the prices at which Scottrade was offering to sell such shares.
42. Missouri courts have long recognized that relief may be granted in a court of equity in rescission cases where a unilateral mistake has been made. In such instances, rescission is appropriate where the opposite party either knew of the mistake by the other party or the mistake was of such a nature that it must have been known to the other party.
43. Scottrade’s mistakes as to the quantity of shares it was offering to sell and the price at which it was offering to sell those shares were so out of proportion to the quantities of GeoBio common stock actually issued and outstanding and the price at which such shares had recently traded that Knight must either have been, like Scottrade, mistaken concerning such matters or knowledgeable of Scottrade’s mistake and intending to take unfair and unreasonable advantage of that mistake, such that equity will intervene and prevent enforcement of the contract seemingly reached by the offers and acceptances exchanged between the parties. Case 4:10-cv-02380-HEA Document 1 Filed 12/20/10 Page 9 of 11
- 10 -
44. Alternatively, because of the obvious disparities between (A) the quantities of GeoBio common shares Scottrade offered to sell to Knight and the quantity of GeoBio common shares issued and outstanding, and (B) the price at which GeoBio shares had last traded and the price at which Scottrade was offering to sell GeoBio shares to Knight, there was no actual meeting of the minds between Scottrade and Knight on the terms of sale. Consequently, no contract of sale was actually formed.
45. Alternatively, if any contracts were formed, enforcement of such contracts would unjustly enrich Knight or others acting through Knight in the market, given the circumstances surrounding their formation.
46. In all events it would be inequitable (and disruptive of the market for GeoBio common shares) to enforce any presently executory contract apparently formed between Scottrade and Knight on December 6, 2010, when Knight accepted Scottrade’s mistaken offers to sell GeoBio shares.
WHEREFORE, Scottrade prays that this Court enter judgment in favor of Scottrade and against Knight either (a) declaring that no contract was made between Scottrade and Knight when Knight purported to accept Scottrade’s offers to sell Knight 2,599,427 shares of GeoBio common stock made December 6, 2010, or (b) rescinding any contract(s) that did result from such acceptance, and for such other and further relief as is appropriate under the circumstances. Case 4:10-cv-02380-HEA Document 1 Filed 12/20/10 Page 10 of 11
- 11 -
Respectfully submitted,
THOMPSON COBURN LLP
By: /s/ / Kenton E. Knickmeyer
Thomas E. Douglass, #3008
Kenton E. Knickmeyer, #3577
One US Bank Plaza
St. Louis, Missouri 63101
314-552-6000
FAX 314-552-7000
Attorneys for Plaintiff Scottrade, Inc.
===
4kids
all jmo
|
Followers
|
35
|
Posters
|
|
|
Posts (Today)
|
0
|
Posts (Total)
|
823
|
|
Created
|
08/19/10
|
Type
|
Premium
|
| Moderators fourkids_9pets Montana Wildhack tom favata | |||
Welome to Dooley's stock plays.
Dooley's stock plays is a subsidary of
FUKD Investments.
FUKD Investments has many operational subsidaries.
DISCLAIMER: SPAM is a TOU violation and will be deleted from this board.
http://en.wikipedia.org/wiki/Spam_(electronic)
Forum spam is the creating of messages that are advertisements, abusive, or otherwise unwanted on Internet forums.
|
Posts Today
|
0
|
|
Posts (Total)
|
823
|
|
Posters
|
|
|
Moderators
|
| Volume | |
| Day Range: | |
| Bid Price | |
| Ask Price | |
| Last Trade Time: |


