 News
News  Market Data
  Discover
Support: 888-992-3836
Copyright © 2023 InvestorsHub Inc.


Register for free to join our community of investors and share your ideas. You will also get access to streaming quotes, interactive charts, trades, portfolio, live options flow and more tools.
BMAS -
On November 4, 2015, the U.S. Attorney for the Eastern District of New York announced that Darren Ofsink, a Manhattan attorney and founder of Ofsink LLC; Michael Morris, a registered broker and managing director of Halcyon Cabot Partners, Ltd. (Halcyon); and Darren Goodrich, a registered broker for fourteen years at BMA Securities, a firm controlled by Burt Martin Arnold were arrested earlier today on charges of securities fraud, wire fraud, and conspiracy to commit securities fraud, mail fraud, and wire fraud in connection with a $300 million market manipulation scheme. In addition to the three defendants arrested today, the eleven-count superseding indictment unsealed this morning charges four additional defendants who were arrested in July 20
14: Abraxas J. Discala, also known as “AJ Discala,” the Chief Executive Officer of OmniView Capital Advisors LLC; Ira Shapiro, the Chief Executive Officer of CodeSmart Holdings, Inc., a publicly traded company; and Craig Josephberg, a registered broker. Three defendants, Marc Wexler, Matthew Bell, and Victor Azrak, who were charged in the underlying indictment, have pleaded guilty and are awaiting sentencing.
Ofsink and Morris will be arraigned later today. Darren Goodrich’s initial appearance for removal proceedings to the Eastern District of New York is scheduled for this afternoon at the United States Courthouse, 312 North Spring Street, Los Angeles, California. Discala, Shapiro and Josephberg will be arraigned on the superseding indictment at a later date.
A couple of GameStop articles that deal with NSS and share registration:
https://www.nasdaq.com/articles/all-about-failing-trades-2021-04-08
https://www.thestreet.com/memestocks/gme/gamestop-investors-are-turning-to-direct-registration-why-that-could-be-a-good-idea
On the significance and mechanics of FTD:
https://www.nasdaq.com/articles/all-about-failing-trades-2021-04-08
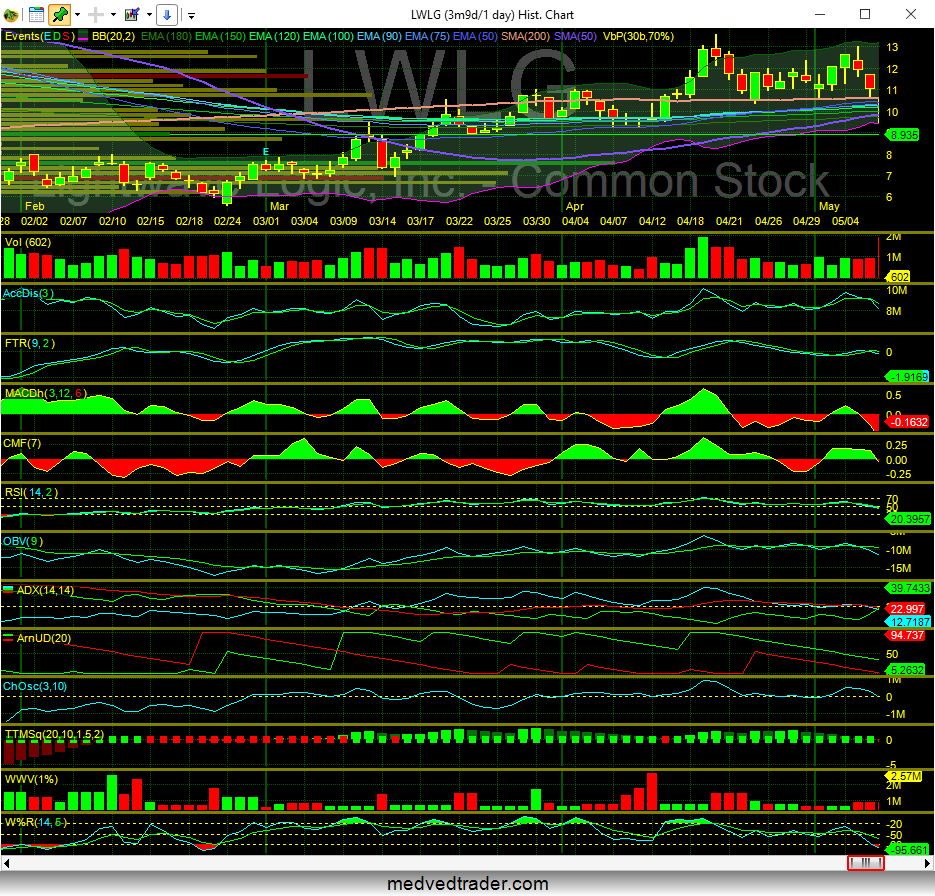
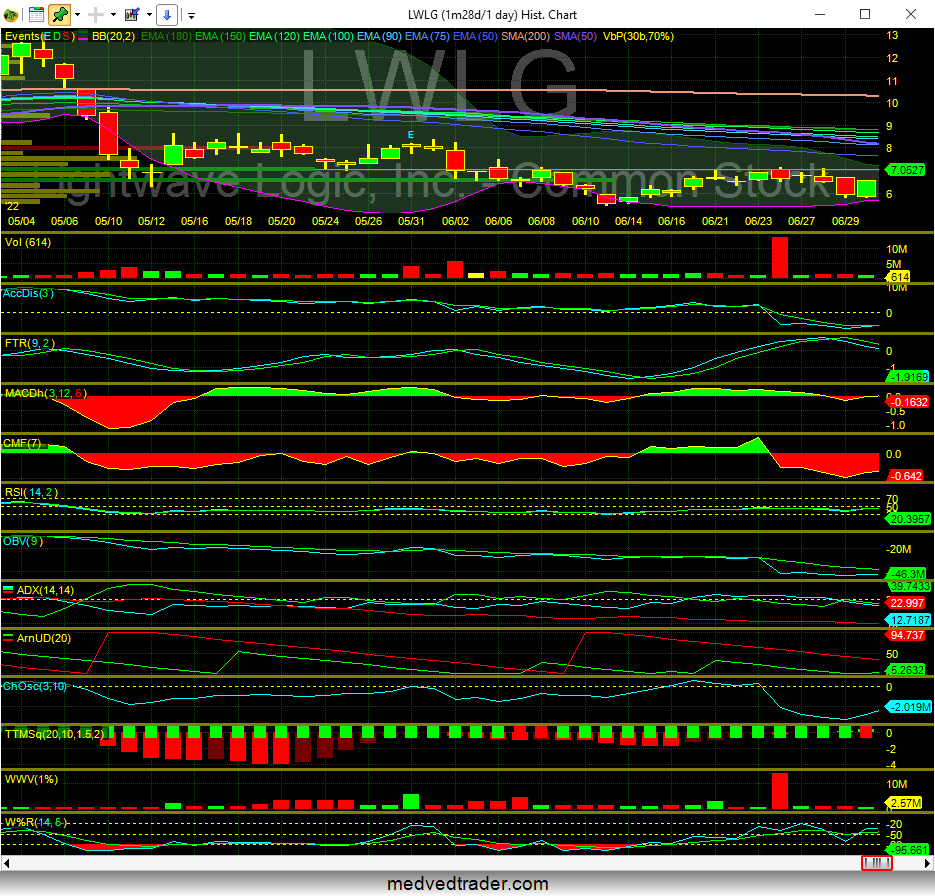
I don't think those stats are available but comparing short interest to VBP should give some clues.
In edit = 5/13 to 6/30 seems to be where most of the damage was done, days to cover have tripled since then.
Order of data:
Settlement Date/Short Interest/Percent Change/ Average Daily Share Volume/Days to Cover

                       01/31/2022	 8,224,272	67.06	1,996,611	4.12
                       01/14/2022	 4,922,847	 9.97	1,113,918	4.42
                       12/31/2021	 4,476,575     102.34	1,842,236	2.43
                       12/15/2021	 2,212,448	28.67	1,649,231	1.34
                       11/30/2021	 1,719,480	(5.48)	  944,571	1.82
                       11/15/2021	 1,819,143	(5.38)	  715,036	2.54
                       10/29/2021	 1,922,613	(9.60) 	  403,339	4.77
                       10/15/2021	 2,126,831	38.81	  477,119	4.40
                       04/29/2022	14,881,642	12.40	1,063,592      13.99
                       04/14/2022	13,239,579	 3.50	  678,095      19.52
                       03/31/2022	12,791,395	10.45	  875,640      14.61
                       03/15/2022	11,580,686	 5.05	  890,355      13.01
                       02/28/2022	11,023,861	 4.63	  872,453      12.64
                       02/15/2022	10,536,146	28.11	  977,195      10.78
                      06/30/2022	20,807,845	6.79	2,426,677	8.57
                       06/15/2022	19,485,684	10.05	1,865,235      10.45
                       05/31/2022	17,706,834	  9.34	1,427,860      12.40
                       05/13/2022	16,194,010	  8.82 	1,715,225       9.40
You have three types of short sale numbers..
1) The quantity of shorted shares traded each day.
https://www.finra.org/finra-data/browse-catalog/short-sale-volume-data
Which probably correlates with dark pool activity:
https://chartexchange.com/symbol/nasdaq-lwlg/exchange-volume/
2) The number of short shares in circulation that have been reported which would of course not include NSS:
https://investorshub.advfn.com/boards/read_msg.aspx?message_id=170921173
Discussion of short interest with charts below. Over the weekend I will try to revive my DBXL skills and do some analysis of the data item 1, correlating it with the chart:
https://investorshub.advfn.com/boards/replies.aspx?msg=170799662
3) FTD data:
https://www.sec.gov/data/foiadocsfailsdatahtm
Institutional interest and control is increasing because of market wide manipulation - STUDY:

GFS owned Mubadala Investment Co PJSC 88 per cent


GameStop is a red herring IMO...
I strongly suspect that the Reddit thing was used as cover for a pump and dump setup in the general market. I also believe that BlackRock was a key player.
Why First Majestic Silver, Hecla Mining, and Other Silver Stocks Rallied out of the Gate Today
JAN 29, 2021 12:48PM EST
Uncertainty is definitely high right now, with all the hype surrounding GameStop, AMC Entertainment, and other names caught up in short squeezes. The CBOE Volatility Index (or VIX for short), which specifically measures investors' expectations of market volatility, is clearly spiking, as the chart above shows. In fact, it isn't at all shocking that investors would view the short squeeze feeding frenzy as a sign that the market has become frothy. After all, stocks are near all-time highs, and the short squeeze issue has caught the attention of the mainstream media and even some prominent politicians. With that background, buying some silver and gold to protect against downside risk makes logical sense.
https://www.nasdaq.com/articles/why-first-majestic-silver-hecla-mining-and-other-silver-stocks-rallied-out-of-the-gate
First Majestic Silver Says It’s Unaware Of Reason For Share Gain
JAN 29, 2021 1:29AM EST
Shares of First Majestic Silver popped by 13% in Thursday's extended market session after closing 22% higher on the day. The stock has gained about 67% over the past three months.
https://www.nasdaq.com/articles/first-majestic-silver-says-its-unaware-of-reason-for-share-gain-2021-01-29
The Next GameStop: Silver Bullion?
JAN 29, 2021 5:44PM EST
Data source: Yahoo! Finance.
The entire investing community has been fixated on what's been happening with shares of stocks that have high short interest. GameStop (NYSE: GME) and others have seen their share prices gyrate wildly, and at least in some people's eyes, it's turned into a battle between Wall Street and average investors. With some brokers having temporarily suspended trading in GameStop on Thursday, some investors are looking for other areas where short squeezes might occur. Even as many of those brokers allowed investors to buy GameStop stock again on Friday, some looked instead to silver stocks -- and the precious metal itself -- as possibilities for a similar short squeeze.
https://www.nasdaq.com/articles/the-next-gamestop%3A-silver-bullion-2021-01-29
courtesy of that for profit site .. ;) Share Structure Share Structure
and why NR (non retail) has a such a dilemma with
P2O's first sale/s' funds' conveyed
security details .. for comparison re: 2 OTC targets PTOI & IPIX and 2020 YTD *Volume* ..
note *Shareholders of Record & what is held via DTC*
IPIX YTD thru EO Nov 2020 ~ 576,394,226
IPIX SECURITY DETAILS
Market Cap Market Cap
70,289,578
12/28/2020
Authorized Shares
600,000,000
11/30/2020
Outstanding Shares
357,616,780
11/30/2020
Restricted
14,505,340
11/30/2020
Unrestricted
343,111,440
11/30/2020
Held at DTC
341,561,335
11/30/2020
Float
302,360,872
06/30/2020
Par Value
0.0001
Shareholders
Shareholders of Record 68
PTOI YTD thru EO Nov 2020 ~ 11,651,243
PTOI SECURITY DETAILS
Market Cap Market Cap
3,393,367
12/29/2020
Authorized Shares
250,000,000
12/29/2020
Outstanding Shares
124,756,158
12/29/2020
Restricted
31,893,743
12/29/2020
Unrestricted
92,862,415
12/29/2020
Held at DTC
87,509,624
12/29/2020
Float
90,809,215
05/30/2018
Par Value
0.001
Shareholders
Shareholders of Record 478
 Total shares authorized: 250,000,000 as of date: 12/14/20
 Total shares outstanding: 124,756,158 as of date: 12/14/20
 Number of shares in the Public Float(2): 90,809,215 as of date: 12/14/20
 Total number of shareholders of record: 478 as of date 12/14/20
SOR is a Shareholder of record---SOR are those entities that hold shares in certificate form or are registered on the companie's register thru the Transfer Agent...if your shares are held in a brokerage account, CEDE is the nominee SOR of your shares of which you are the beneficial owner...
the DTCC holds, clears, and settles trades electronically---see subsidiaries here for DTC and CEDE
https://en.wikipedia.org/wiki/Depository_Trust_%26_Clearing_Corporation
BMA was involved in the GOSY IPO.
UBS is using Dominion to generate fake locates and borrows...
Wonder who else is using this software to generate air shares???
Tic Toc
https://mb.ntd.com/400-million-sec-filing-links-dominion-ubs-and-china_536295.html
ever notice how the SEC goes for the low hanging fruit
years after the fact ..
BMA Fails to Close Out FTDs BMA’s Clearing Firm Properly Allocated to BMA
7. From January 2015 through at least August 2016, BMA’s clearing firm (the
“Clearing Firm”) reasonably allocated FTDs to BMA. BMA was responsible for closing out such
FTDs, per Rule 204.
8. In many instances, BMA simply ignored the allocated FTDs, and took no steps
whatsoever to close out those FTDs.
PTOI ~ Volume October 2020
interesting to see where NN *reported* to Finra
in NRs' giant *shell* game re: PTOI
6 out of 6 .. behind the *re-activated* ARCA (July 2020)
note the %s for NRs' washed efforts of 42%~ (first 3)
 PTOI    866,511   1,032,195   10,479,789   CDEL   364,953  1  42.12%

 PTOI    866,511   1,032,195   10,479,789   GTSM   223,413  2  25.78%
 PTOI    866,511   1,032,195   10,479,789   ETRF   141,110  3  16.28%

 PTOI    866,511   1,032,195   10,479,789   CSTI    82,262  4   9.49%
 PTOI    866,511   1,032,195   10,479,789   ARCA    37,774  5   4.36%
 PTOI    866,511   1,032,195   10,479,789   NITE    16,999  6   1.96%
https://otce.finra.org/otce/marketStatistics/monthlyShareVolume
back half (rough) ~ 301,607 .. of which known P2O investors picked off approx 200k (66%)
(haven't had the time to do % for back half of the month re: investors' buys)
PTOI ~ October 2020 Volume
  10/30/2020	$0.019	2,375	$0.017	$0.019	$0.017
  10/29/2020	$0.0209	N/A	$0.0209	$0.0209	$0.0209
  10/28/2020	$0.0209	2,735	$0.0209	$0.0209	$0.0209
  10/27/2020	$0.016	116,534	$0.018	$0.0209	$0.016
  10/26/2020	$0.019	11,520	$0.0209	$0.0209	$0.0187
  10/23/2020	$0.0162	12,770	$0.021	$0.021	$0.0162
  10/22/2020	$0.0172	34,868	$0.0164	$0.0187	$0.0164
  10/21/2020	$0.0186	30,200	$0.0164	$0.0186	$0.0162
  10/20/2020	$0.0161	5,000	$0.0185	$0.0185	$0.0161
  10/19/2020	$0.0153	58,605	$0.02	$0.02	$0.0153
  10/16/2020	$0.0181	27,000	$0.021	$0.021	$0.0151

  10/15/2020	$0.015	299,684	$0.0162	$0.0162	$0.015
  10/14/2020	$0.021	2,700	$0.021	$0.021	$0.021
  10/13/2020	$0.0162	10,732	$0.016	$0.0162	$0.016
  10/12/2020	$0.0161	53,817	$0.0209	$0.021	$0.016
  10/09/2020	$0.016	8,200	$0.0209	$0.0209	$0.016
  10/08/2020	$0.015	18,357	$0.015	$0.015	$0.015
  10/07/2020	$0.015	30,600	$0.016	$0.021	$0.015
  10/06/2020	$0.016	2,051	$0.021	$0.021	$0.016
  10/05/2020	$0.0212	3,333	$0.0212	$0.0212	$0.0212
  10/02/2020	$0.0204	111,450	$0.016	$0.025	$0.016
  10/01/2020	$0.022	23,979	$0.016	$0.022	$0.016
  Historical Short Volume Data for PTOI
  Date	Close	High	Low	Volume	Sht Vol	% of Vol Shtd
  Oct 29	NA	NA	NA	1	1	100.00%
  Oct 28	NA	NA	NA	2,735	2,735	100.00%
  Oct 27	NA	NA	NA	116,534	48,651	41.75%
  Oct 23	NA	NA	NA	12,770	6,700	52.47%
  Oct 21	NA	NA	NA	30,200	13,700	45.36%
  Oct 20	NA	NA	NA	5,000	5,000	100.00%
  Oct 19	NA	NA	NA	58,605	4,500	7.68%
  Oct 16	NA	NA	NA	27,000	6,000	22.22%

  Oct 15	NA	NA	NA	299,684	156,484	52.22%
  Oct 13	NA	NA	NA	10,732	10,732	100.00%
  Oct 12	NA	NA	NA	53,817	13,817	25.67%
  Oct 07	NA	NA	NA	30,600	17,501	57.19%
  Oct 06	NA	NA	NA	2,051	1,750	85.32%
  Oct 02	NA	NA	NA	111,450	99,000	88.83%
  Oct 01	NA	NA	NA	23,979	14,813	61.77%
*confirmation* via Finra makes PTOI's October 2020's *volume* of 866,511 the 2nd lowest for 2020 .. hmmm
    OCT 2020 ~   866,511
    SEP 2020 ~ 1,032,195
    AUG 2020 ~   917,618
    JUL 2020 ~ 1,025,276
    JUN 2020 ~ 1,052,205
    MAY 2020 ~   600,356
    APR 2020 ~ 1,561,699
    MAR 2020 ~ 1,066,784
    FEB 2020 ~   993,682
    JAN 2020 ~ 1,363,463
https://investorshub.advfn.com/boards/read_msg.aspx?message_id=159243723
NR (non retail) = just a few probs
4kids
PTOI ~ (rough) October 2020 *volume*
CEs' reported data for October to Finra .. due out *shortly*
https://otce.finra.org/otce/marketStatistics/monthlyShareVolume
back half (rough) ~ 301,607 .. of which known P2O investors picked off approx 200k (66%)
first half (rough) ~ 564,903
PTOI ~ October 2020 *volume* (rough) = 866,510
 10/30/2020	$0.019	2,375	$0.017	$0.019	$0.017
 10/29/2020	$0.0209	N/A	$0.0209	$0.0209	$0.0209
 10/28/2020	$0.0209	2,735	$0.0209	$0.0209	$0.0209
 10/27/2020	$0.016	116,534	$0.018	$0.0209	$0.016
 10/26/2020	$0.019	11,520	$0.0209	$0.0209	$0.0187
 10/23/2020	$0.0162	12,770	$0.021	$0.021	$0.0162
 10/22/2020	$0.0172	34,868	$0.0164	$0.0187	$0.0164
 10/21/2020	$0.0186	30,200	$0.0164	$0.0186	$0.0162
 10/20/2020	$0.0161	5,000	$0.0185	$0.0185	$0.0161
 10/19/2020	$0.0153	58,605	$0.02	$0.02	$0.0153
 10/16/2020	$0.0181	27,000	$0.021	$0.021	$0.0151

 10/15/2020	$0.015	299,684	$0.0162	$0.0162	$0.015
 10/14/2020	$0.021	2,700	$0.021	$0.021	$0.021
 10/13/2020	$0.0162	10,732	$0.016	$0.0162	$0.016
 10/12/2020	$0.0161	53,817	$0.0209	$0.021	$0.016
 10/09/2020	$0.016	8,200	$0.0209	$0.0209	$0.016
 10/08/2020	$0.015	18,357	$0.015	$0.015	$0.015
 10/07/2020	$0.015	30,600	$0.016	$0.021	$0.015
 10/06/2020	$0.016	2,051	$0.021	$0.021	$0.016
 10/05/2020	$0.0212	3,333	$0.0212	$0.0212	$0.0212
 10/02/2020	$0.0204	111,450	$0.016	$0.025	$0.016
 10/01/2020	$0.022	23,979	$0.016	$0.022	$0.016
 Historical Short Volume Data for PTOI
 Date	Close	High	Low	Volume	Sht Vol	% of Vol Shtd
 Oct 29	NA	NA	NA	1	1	100.00%
 Oct 28	NA	NA	NA	2,735	2,735	100.00%
 Oct 27	NA	NA	NA	116,534	48,651	41.75%
 Oct 23	NA	NA	NA	12,770	6,700	52.47%
 Oct 21	NA	NA	NA	30,200	13,700	45.36%
 Oct 20	NA	NA	NA	5,000	5,000	100.00%
 Oct 19	NA	NA	NA	58,605	4,500	7.68%
 Oct 16	NA	NA	NA	27,000	6,000	22.22%
 Oct 15	NA	NA	NA	299,684	156,484	52.22%
 Oct 13	NA	NA	NA	10,732	10,732	100.00%
 Oct 12	NA	NA	NA	53,817	13,817	25.67%
 Oct 07	NA	NA	NA	30,600	17,501	57.19%
 Oct 06	NA	NA	NA	2,051	1,750	85.32%
 Oct 02	NA	NA	NA	111,450	99,000	88.83%
 Oct 01	NA	NA	NA	23,979	14,813	61.77%
with *confirmation* (FINRA) .. that would make PTOI's October 2020's *volume* of 866,510 the 2nd lowest for 2020 .. hmmm
   SEP 2020 ~ 1,032,195
   AUG 2020 ~   917,618
   JUL 2020 ~ 1,025,276
   JUN 2020 ~ 1,052,205
   MAY 2020 ~   600,356
   APR 2020 ~ 1,561,699
   MAR 2020 ~ 1,066,784
   FEB 2020 ~   993,682
   JAN 2020 ~ 1,363,463
https://investorshub.advfn.com/boards/read_msg.aspx?message_id=159243723
NR (non retail) = just a few probs
4kids
PTOI ~ Volume by Month ~ 2020
PTOI ~ YTD Volume @ EO September 2020 = 9,613,278
  SEP 2020 ~ 1,032,195
  AUG 2020 ~   917,618
  JUL 2020 ~ 1,025,276
  JUN 2020 ~ 1,052,205
  MAY 2020 ~   600,356
  APR 2020 ~ 1,561,699
  MAR 2020 ~ 1,066,784
  FEB 2020 ~   993,682
  JAN 2020 ~ 1,363,463
PTOI ~ Volume by Month ~ 2019
PTOI ~ YTD Volume ~ 2019 = 23,994,633
PTOI ~ YTD Volume @ EO September 2019 = 11,515,439
        JAN 2019 ~ 1,651,632 .. 604,990 sans 1.29.19's *volume*
        FEB 2019 ~ 2,076,767 .. note 2M + 400k = 2.4M~
        MAR 2019 ~ 1,612,549 .. note 1.6M identical to Jan 2019 (washed effort)
        APR 2019 ~ 2,499,579 .. note 2.4M - 400k  = 2M
        MAY 2019 ~ 858,637 .. 2019 YTD Volume ~ 8,699,164
        JUN 2019 ~ 491,063 .. 2019 YTD Volume ~ 9,190,227
        JUL 2019 ~ 445,451 .. lowest volume month in 2019 .. 2019 YTD Volume ~ 9,635,678
        AUG 2019 ~ 772,572 .. 2019 YTD Volume ~ 10,408,250
        SEP 2019 ~ 1,107,189 .. 2019 YTD Volume ~ 11,515,439
        OCT 2019 ~ 2,189,307 .. 2019 YTD Volume ~ 13,704,746
        NOV 2019 ~ 8,847,829 .. *record* vol by NR breaks April 2011's *efforts/set up*
        DEC 2019 ~ 1,442,058 .. 2019 YTD Volume ~ 23,994,633
PTOI ~ Annual Volume Totals: April 2009 - September 2020
            2009 ~ 7,188,642  ** (mid April start)
            2010 ~ 20,478,838 ** CSTI imported/first hit piece & complicit *letter* of 9/28/2010
            2011 ~ 37,204,277 ** NON RETAILs' *set up* ..  (includes April's record setting *volume* month of 8M~)
            2012 ~ 26,989,328 ** aromatics & mgmt change out  May 2012 .. set up for Jan 2013
            2013 ~ 36,808,995. ** P2O wrested back mid August 2013 .. wash trading 101 with 2014
            2014 ~ 36,381,060 ** wash trading 101 with 2013   .. note lower than 2013 and Jan 2014 6c reset and *volume*
            2015 ~ 22,275,997 ** note *volume* significantly lower than 2014  .. PPS relentlessly compressed
            2016 ~ 19,759,799 ** note still the lowest YTD volume for PTOI with lowest PPS
            2017 ~ 13,540,583 ** down approx 6M and change from 2016's record setting low *volume*
            2018 ~ 13,924,427 .. slight increase over 2017's 13M~ *volume* .. first turn since 2013
            2019 ~ 23,994,633 ** includes November 2019's *record volume* of 8,847,829 surpassing NRs' effort of April 2011 *
            2020 ~ 9,613,278 @ the EO September **
* April 2011 .. PPS range 80c to 3.00$ (8M~ x $2.00 = $16M)
** November 2019 .. PPS range 2c to 11c (8M~ x $.06c = $480,000)
from memory .. with receipts available
 01.31.13 .. NRs' last illegal orchestration of significance $1.49/622k *volume*
 09.30.13 .. CEO injects $2M (PPS 35c)
 12.31.13 .. PPS *reset* 52 week low 10c
 01.13.14 .. PPS *reset* 52 week low 06c
 10.13.14 .. PPS *reset* 52 week low 05c memorable due to last aromatic flushed by burying ACC release on *volume*
so for 6 years and 1 month PTOI's PPS has been mostly held @ sub 5c
PTOI's I/O for the past 5 years~ 124,756,158
As of May 15, 2015, there were 121,246,158 shares of the Registrant’s common stock, $0.001 par value, outstanding.
https://www.sec.gov/Archives/edgar/data/1381105/000149315215002006/form10-q.htm
As of November 14, 2014, there were 116,861,535 shares of Common Stock, $0.001 par value per share, issued and outstanding.
https://www.sec.gov/Archives/edgar/data/1381105/000126493114000474/plastic2oil10q.htm
and in the last year .. holders increased from 450 to 478
Approximate number of holders of record as of the certification or notice date: 478
https://www.sec.gov/Archives/edgar/data/1381105/000149315220019558/form15-12ga.htm
and courtesy of that for profit site (with all that that implies)
 PTOI Share Structure
 Market Cap Market Cap
 2,364,129
 10/30/2020
 Authorized Shares
 250,000,000
 10/30/2020
 Outstanding Shares
 124,756,158
 10/30/2020
 Restricted
 31,893,743
 10/30/2020
 Unrestricted
 92,862,415
 10/30/2020
 Held at DTC
 87,509,624
 10/30/2020
 Float
 90,809,215
 05/30/2018
NR (non retail) has 10 years and 100 MILLION *reasons* for wanting P2O *to fail*
4kids
IPIX ..
If you look at the summary at the end of the 4kids post ... some of the numbers and events jump off the page.
2015 – IPIX SP begins year at $3.66 after peaking at $4.93 in December 2014
8/6/15 Mako hit piece immediately followed by bogus Rosen Class Action
2016 – IPIX SP begins year at $1.28
2017 – IPIX SP begins the year at $1.16 and closes year end at .73
2018 - 88M shares traded
-A then record amount of 55M or about 63% of the entire year total was traded in the last 4 months which was needed to compress IPIX SP from .53 to .07
2019 – 124M (almost a 50% increase in volume from 2018)
- May 2019 alone was 23M to negate the Alfasigma announcement
- YTD through October was 94M and 30M in the last 3 months to compress further down to .05 SP. NR had successfully crippled IPIX down to 5 cents a share making capital extremely expensive and dilutive for any science advancement.
2020 – A successful Phase 1 on B-IBD UC using BDD delivery system gives hope of a future licensing deal into a huge IBD market but then…….A worldwide pandemic strikes that no one saw coming INCLUDING the criminal cabal (also referred to as Non Retail or NR). An even bigger surprise is that our little baby bio investment IPIX’s Brilacidin, turns out to have far superior antiviral capabilities versus ANY other drug known to mankind against the CV19 virus and it not only reduces the overall viral load but kills the CV19 virus on contact, reduces inflammation and modulates the human immune response. Now back to the numbers!
2020 first 9 month volume is 524M. Note at this rate IPIX volume will be 699M in 2020 or ALMOST 6 TIMES THE VOLUME OF 2019. I personally believe that the last 10 weeks of volume in 2020 will be far greater than this rate due to milestone achievements discussed below.
Note that September of 2019 IPIX shareholders voted 90% in FAVOR of approving an increase in Authorized Shares from 300M to 600M. IMO this was an extremely strong vote of confidence that a vast majority of IPIX shareholders were in for the LONG haul. This shareholder confidence in IPIX science and management made it clear that very few IPIX investors were selling any of their position at these artificially compressed prices and by knowing what the own would not be selling under a several dollar SP. The criminals/NR know this very well and thus the comment that they are between a rock and a hard place.
A couple of examples of criminally compressed stocks that saw a sudden increase as NR lost control of SP and their naked position was forced into a squeeze.
- AMRN SP went from $3 to $26 in a very short period of time.
- OSTK SP was $2.23 this March and hit a peak of $123.00 this August. Does anyone on this board believe OSTK improved their business model by a factor of 55X over a brief few month period?
The entire contents above are simply proof points of criminal manipulation by NR but IMO IPIX will ultimately be valued based on their science making it through FDA trials and ultimately distributed successfully to the market to treat disease. My track record on predicting timing of events has not been great as I continue to be surprised at how long it takes to advance the science through FDA trials but with that said I believe we are getting very close to hitting some very huge milestones that will continue to de-risk our investment and bring life-saving drugs to the market. I am expecting to see:
In 30 days or less – FDA IND Approval and separately a Preprint of the RBL Peer Review paper.
In 45 days or less – Initiation of B-CV19 Human Trials
In 60-90 days – Interim Human Trial Results, Emergency Use and Compassionate Use approval. Major industry and investor exposure. Multiple media exposure in print, social media, television, radio discussing the treatment that kills CV19.
1stH 2021 – Large government order and/or government grant for volume shipment of Brilacidin for the masses in parallel with a Phase3 B-CV19 trial. International distribution partnership for B-CV19 to cover non-US demand. Separately a B-IBD UC Phase 2 trial kicks off as Brilacidin is further positioned as a franchise drug used for many different instances.
2ndH 2021 – IPIX will most likely have been already Up Listed off of the criminally controlled OTX to a legitimate exchange. Throughout 2021 the criminals will be scrambling to cover their naked position as an EPIC SHORT SQUEEZE takes place starting in the $2-4/share range but really kicking in the $5-$20 range. Remember that the criminals need REAL LONGS to sell REAL SHARES for them to cover their naked positions. IMO it will not be uncommon to see trading days where IPIX is trading at 10M+ shares daily and go up in $1 plus increments on days where no announcements are made. See the above OSTK example for both the magnitude of the SP increase and the short period of time that this could take place.
=====
the above post was written by another Innovation Pharma investor
who incorporated some of my *data* re: IPIX/CTIX .. publicly posted over the years *here and there*
courtesy of that for profit site (with all that that implies)
 IPIX SECURITY DETAILS
 Share Structure
 Market Cap Market Cap
 72,275,663
 10/16/2020
 Authorized Shares
 600,000,000
 09/30/2020
 Outstanding Shares
 349,579,992
 09/30/2020
 Restricted
 14,468,552
 09/30/2020
 Unrestricted
 335,111,440
 09/30/2020
 Held at DTC
 333,561,335
 09/30/2020
 Float
 302,360,872
 06/30/2020
 Par Value
 0.0001
 Market Value calculated only for respective security
 Transfer Agent
 West Coast Stock Transfer Inc.
 Shareholders
 Shareholders of Record   68
 06/30/2020
quotes from this very venue (PTOI) .. re: *authoritative expertise* on the very subject of the DTC (CEDE) .. ;)
On April 7, 2017, there were 482 holders of record of our common stock, $0.001 par value per share.
Well, 481 who were crazy enough to give them their name and all the others with street name are in CEDE.
every public company has a shareholder of record named CEDE that counts as 1 in the # of shareholders of record...that "entity" is the nominee owner of all shares held by all beneficial owners at various brokerages who may number in the thousands...
CEDE, who is the nominee holder of every share held in a brokerage account and counts as 1 shareholder of record
One of those "entities"---the nominee holder of every share held in brokerage accounts called CEDE---counts as 1 and represents thousands of shareholders...
incredible how, with ~500 shareholders of record, (one of whom is CEDE, the nominee of the DTC that is the legal owner of every street named shareholder's shares) anyone could even fathom a guess on this...
curious to see how today's 3 PTOI *trades* are marked
PTOI 8K Filed
Section 8 – Other Events
Item 8.01 Other Events
In light of the circumstances and uncertainty surrounding the effects of the COVID-19 coronavirus pandemic on the business, employees, consultants and service providers of Plastic2Oil, Inc. (the “Company”), the Company’s Board of Directors and management have determined that it will delay the filing of its quarterly report on Form 10-Q for the three months ended March 31, 2020 (the “Quarterly Report”) by up to 45 days in accordance with the SEC’s March 4, 2020 Order (Release No. 34-88318) (the “Order”), which allows for the delay of certain filings required under the Securities and Exchange Act of 1934, as amended. The Company’s operations and business have experienced disruption due to the unprecedented conditions surrounding the COVID-19 pandemic spreading throughout the United States and the world and thus the Company’s business operations have been disrupted and it is unable to timely review and prepare the Company’s financial statements for the 2019 fiscal year. As such, the Company will be making use of the 45-day grace period provided by the SEC’s Order to delay filing of its Annual Report. The Company plans to file its Quarterly Report by no later than June 29, 2020, 45 days after the original grace period due date (May 14, 2020) of its Quarterly Report.
https://www.sec.gov/Archives/edgar/data/13811...-index.htm
News News Alert: Current Report Filing (8-k) 05/14/2020 05:01:19 PM
SEC Charges Marijuana Stock Investors With Fraud
By Bill Alpert
April 17, 2020 11:52 am ET
A Massachusetts financier arranged to bring public a cannabis social-media company and then manipulated trading in its stock so he could unload his shares, a complaint by the Securities and Exchange Commission alleged last week. Douglas H. Leighton and a group of friends made more than $3 million when they later sold their shares of the stock, MassRoots, alleged the commission, with the group accounting for more than 60% of MassRoots trading in the week it came public in 2015.
The 51-year-old Leighton and his six co-defendants agreed to settle the SEC fraud charges, without admitting or denying them, by paying about $1.5 million in disgorgement and penalties. Subject to approval by the federal court in Boston, the agreement calls for Leighton to be barred from the securities industry, from holding office at a public company, or from trading in penny stocks.
“Over the past year, we have fully cooperated with the SEC’s civil inquiry into the trading of MassRoots’ securities,” Leighton’s lawyer Alan Rose Jr. told Barron’s in an email.
MassRoots (ticker: MSRT) described itself as “a semi-anonymous mobile network” where people could discuss cannabis use. While it said it had one million users for its software app, its securities filings showed that its business model of selling ads has never yielded more than a few hundred thousand dollars in cumulative revenue while producing tens of millions in losses. In its first month of trading in April 2015, MassRoots stock price briefly topped $7, giving the company a market value of $350 million. At that point, its cumulative revenue had totaled $1,465.
Today, MassRoots shares go for 0.14 cent each in over-the-counter trading, and the company‘s last securities filing in March 2020 said it lacked the funds needed to complete its accounting for the 2019 year. Barron’s queries to the company went unanswered.
Starting in the mid-1990s, Leighton had been a prolific penny-stock financier who found tiny companies, became their consultant, and got millions of shares in their stock before helping them come public. His firm Dutchess Capital claimed it had helped more than 400 companies raise $1 billion in all.
As more states began to legalize marijuana under their own laws in the past decade, penny-stock promoters sensed a new story to pitch retail investors. The major U.S. exchanges wouldn’t list cannabis stocks because of the weed’s federal illegality, but micro-cap stock names began trading over-the-counter in the U.S. and Canada several years before the marijuana stock bubble that accompanied Canada’s 2018 legalization.
The SEC’s complaint said that MassRoots came to Leighton’s attention in 2013. He invested $50,000 in the business and became its consultant for coming public, said the SEC. In return, Leighton and his firms received the rights to 23% of MassRoots stock, the complaint said. He instructed the company to hire certain brokers, lawyers, auditors, and stock promoters, while putting additional shares in the hands of associates through a private offering, the SEC added.
The complaint alleges that Leighton orchestrated his associates’ trading to artificially boost the stock’s price before unloading his own shares. The SEC alleged that Leighton and his confederates should have made Form 13-D filings that showed they were acting as a group.
According to the SEC’s suit, Leighton’s trading group made most of its money in the year after MassRoots’ public listing in April 2015, but it continued to profit from its alleged scheme through 2018, By then, the company had come to the attention of better-known investors in the accelerating marijuana industry.
A July 2018 securities filing by MassRoots registered 51 million shares the company had sold in the previous year to a number of investors.
Write to Bill Alpert at william.alpert@barrons.com
https://www.barrons.com/articles/sec-charges-marijuana-stock-investors-with-fraud-51587138778
SEC Charges Seven in Microcap Fraud Scheme
Litigation Release No. 24791 / April 8, 2020
Securities and Exchange Commission v. Douglas Leighton et al., No. 1:20-cv-10686 (D. Mass. filed April 7, 2020)
The Securities and Exchange Commission charged Massachusetts resident Douglas Leighton for a scheme in which he allegedly acquired discounted shares in a microcap company, knowingly failed to disclose his holdings and sales, and manipulated the public market for those shares. Leighton, two entities he controlled, and six investors he directed agreed to settlements ordering them to pay nearly $1.5 million in civil penalties, disgorgement, and prejudgment interest.
The SEC's complaint, filed in federal court in Boston, alleges that Leighton orchestrated the fraud after acquiring millions of shares in MassRoots, Inc., a cannabis-social-media company now based in Los Angeles, California. As alleged, when MassRoots began selling its shares to the public in April 2015, Leighton directed Michael Sullivan, David Hall, Zachary Harvey, Paul Dutra, Jason Harman, and Jessica Geran to manipulate the public market for MassRoots stock, including by making open-market purchases at specific volumes and prices to create an appearance of active trading in and increase the price of MassRoots stock. According to the complaint, Sullivan also used accounts at two separate broker dealers to further create an appearance of volume in and affect the price of MassRoots stock. The complaint further alleges that Leighton acquired and sold shares through Dutchess Opportunity Fund II LP, Azure Capital Corp., and Bass Point Capital LLC, which along with Leighton and the other defendants never disclosed to the investing public, through required SEC filings, their sales and significant ownership of MassRoots stock.
Leighton, Azure Capital, Bass Point, Sullivan, Hall, Harvey, Dutra, Harman, and Geran have agreed to settle the matter by consenting, without admitting or denying the SEC's allegations, to the entry of final judgments, which are subject to court approval. The judgments would permanently enjoin all of the defendants from violating the beneficial ownership reporting provisions of Sections 13(d) and 16(a) of the Securities Exchange Act of 1934 and Rules 13d-3 and 16a-1 thereunder; Leighton, Bass Point, Azure, and Sullivan from violating the antifraud provisions of Section 17(a) of the Securities Act of 1933; Leighton, Bass Point, and Azure from violating the antifraud provisions Section 10(b) of the Exchange Act and Rule 10b-5 thereunder; and Leighton and Sullivan from violating the market manipulation provisions of Section 9(a)(2) of the Exchange Act. In addition, the judgment would bar Leighton from serving as an officer or director of a public company and order him to pay a civil penalty of $160,000, and would bar Leighton, Azure Capital, and Bass Point from trading in penny stocks, impose a conduct-based junction restricting their future trading in any stock, and order them jointly and severally to pay disgorgement plus prejudgment interest of nearly $1 million. Leighton has also agreed to settle a follow-on administrative proceeding that bars him from the securities industry. Sullivan has agreed to be barred from trading in penny stocks for five years and to pay a civil penalty of $40,000 and disgorgement plus prejudgment interest of $63,228. The final judgments would order Hall, Harvey, Dutra, Harman, and Geran to pay civil penalties of $15,000 each, and would order payments of disgorgement plus prejudgment interest of $67,080 by Hall, $32,720 by Harvey, and $28,906 by Dutra.
The SEC's investigation was conducted by Jonathan Allen, Sofia Hussain, Alexander Pevzner, Rachel Hershfang, and Amy Gwiazda of the Boston Regional Office, with assistance from Robert Nesbitt in the SEC's Office of Market Intelligence. The investigation originated from an examination conducted out the Boston Regional Office by Marie Hagelstein, Kenneth Leung, and Mayeti Gametchu of the SEC's Office of Compliance Inspections and Examinations.
https://www.sec.gov/litigation/litreleases/2020/lr24791.htm
Unfortunately for you, part of that judgment involved a finding of proven falsity.
So, denying ENSSFM fantasies won't cut it as something to file a lawsuit over.
PTOI Historical ~ 11.25.19 - 2.28.20
PTOI ~ rough *volume* count for FEB 2020 ~ 993,682
NR = Just A Few Probs
 02/28/2020	0.039	0.0423	0.036	0.036	45,953
 02/27/2020	0.0381	0.0491	0.0381	0.041	244,505
 02/26/2020	0.0488	0.0491	0.045	0.045	39,994
 02/25/2020	0.05	0.05	0.0401	0.046	143,791
 02/24/2020	0.051	0.053	0.0401	0.05	92,128
 02/21/2020	0.05	0.054	0.05	0.051	63,673
 02/20/2020	0.0595	0.0595	0.0595	0.0595	2,600
 02/19/2020	0.0531	0.0531	0.052	0.0529	19,300
 02/18/2020	0.052	0.06	0.052	0.059	23,380

 02/14/2020	0.0625	0.0625	0.0516	0.0585	59,105
 02/13/2020	0.0617	0.0617	0.0515	0.061	92,480
 02/12/2020	0.052	0.061	0.052	0.061	5,750
 02/11/2020	0.0523	0.0581	0.0523	0.0581	23,500
 02/10/2020	0.061	0.061	0.0531	0.06	18,903
 02/07/2020	0.053	0.0613	0.053	0.0532	21,650
 02/06/2020	0.053	0.0615	0.053	0.053	29,755
 02/05/2020	0.054	0.06	0.054	0.058	12,066
 02/04/2020	0.059	0.06	0.053	0.0597	43,000
 02/03/2020	0.054	0.0622	0.054	0.0622	12,149
PTOI ~ MM Monthly JAN 2020 ~ 1,363,463
 01/31/2020	0.05	0.0595	0.05	0.0595	7,715
 01/30/2020	0.05	0.06	0.05	0.0595	11,550
 01/29/2020	0.05	0.0565	0.05	0.0565	9,516
 01/28/2020	0.055	0.06	0.054	0.054	112,100
 01/27/2020	0.065	0.065	0.0554	0.057	105,385
 01/24/2020	0.06	0.06	0.0578	0.0578	3,188
 01/23/2020	0.0555	0.0624	0.0555	0.0578	34,020
 01/22/2020	0.0599	0.0599	0.0564	0.0599	28,460
 01/21/2020	0.0625	0.067	0.0555	0.0595	113,278
 01/17/2020	0.06	0.0685	0.059	0.059	71,716
 01/16/2020	0.06	0.062	0.057	0.06	120,945

 01/15/2020	0.063	0.0679	0.0594	0.06	18,104
 01/14/2020	0.0645	0.0684	0.0585	0.0684	66,115
 01/13/2020	0.07	0.07	0.0658	0.0675	91,272
 01/10/2020	0.0512	0.084	0.0512	0.075	261,951
 01/09/2020	0.0525	0.087	0.0525	0.086	58,112
 01/08/2020	0.052	0.058	0.0466	0.0506	208,632
 01/07/2020	0.0412	0.052	0.0412	0.052	16,000
 01/06/2020	0.0525	0.0525	0.0466	0.052	15,700
 01/03/2020	0.047	0.053	0.047	0.053	1,504
 01/02/2020	0.0425	0.0465	0.039	0.0465	8,200
PTOI ~ MM Monthly DEC 2019 ~ 1,442,058
 12/31/2019	0.0368	0.0455	0.0368	0.0425	56,072
 12/30/2019	0.037	0.0434	0.037	0.0408	50,230
 12/27/2019	0.037	0.0402	0.037	0.0402	24,160
 12/26/2019	0.0445	0.0445	0.037	0.0415	174,849
 12/24/2019	0.0485	0.0485	0.0422	0.0434	31,192
 12/23/2019	0.0485	0.0485	0.0451	0.0485	9,338
 12/20/2019	0.0427	0.0485	0.0426	0.0485	11,500
 12/19/2019	0.048	0.048	0.0436	0.0436	36,150
 12/18/2019	0.0508	0.0508	0.0495	0.0495	3,911
 12/17/2019	0.05	0.063	0.0445	0.0512	38,775
 12/16/2019	0.05	0.056	0.05	0.05	28,789

 12/13/2019	0.057	0.057	0.0483	0.057	927
 12/12/2019	0.057	0.057	0.057	0.057	45,000
 12/11/2019	0.0532	0.06	0.05	0.0554	179,885
 12/10/2019	0.06	0.065	0.05	0.0527	419,955
 12/09/2019	0.058	0.065	0.058	0.065	43,050
 12/06/2019	0.065	0.065	0.057	0.06	30,399
 12/05/2019	0.065	0.065	0.056	0.0605	25,903
 12/04/2019	0.06	0.0621	0.0553	0.06	37,595
 12/03/2019	0.0595	0.0598	0.0471	0.0598	166,412
 12/02/2019	0.05	0.0565	0.05	0.0565	27,966
PTOI ~ MM Monthly NOV 2019 ~ 8,847,829
 11/29/2019	0.0486	0.06	0.0431	0.05	88,673
 11/27/2019	0.056	0.06	0.05	0.0555	103,310
 11/26/2019	0.0594	0.0595	0.056	0.0595	32,248
 11/25/2019	0.05	0.06	0.05	0.0585	159,641
to reiterate .. as of the 10K (annual) filed last year
PTOI has 450 holders of record .. 1 of which is a CE (colluding entity)
that is the DTC .. that leaves 449 with certs not deposited in a brokerage firm
how prescient
suspect after NRs' set up of November 2019 .. which imo would have worked had NR been able to *run*
PTOI as they did back in April 2011 (80c to 3.00) to garner CONnections' interest back then .. this time
around NRs' set up fizzled .. all that effort for a *run* from 035c to 11c .. which would be *laughable* to the
CONnections NR desperately needed .. more revealing and rather ironic .. is the clamp that appears to have
come down from various CEs (colluding entities aka brokerage firms) .. re: *access* to P2O investors' shares
always telling to see *NRs' patterns* change out
 Date	Close	High	Low	Volume	Sht Vol	% of Vol Shtd
 Feb 28	NA	NA	NA	45,953	35,132	76.45%
 Feb 27	NA	NA	NA	244,505	48,160	19.70%
 Feb 26	NA	NA	NA	39,994	11,000	27.50%
 Feb 25	NA	NA	NA	143,791	107,672	74.88%
 Feb 24	NA	NA	NA	92,128	41,508	45.05%
 Feb 21	NA	NA	NA	63,673	12,700	19.95%
 Feb 20	NA	NA	NA	2,600	2,600	100.00%
 Feb 19	NA	NA	NA	19,300	1,700	8.81%
 Feb 18	NA	NA	NA	23,380	6,690	28.61%

 Feb 14	NA	NA	NA	59,105	16,105	27.25%
 Feb 13	NA	NA	NA	92,480	76,355	82.56%
 Feb 12	NA	NA	NA	5,750	750	13.04%
 Feb 11	NA	NA	NA	23,500	22,313	94.95%
 Feb 10	NA	NA	NA	18,903	18,651	98.67%
 Feb 07	NA	NA	NA	21,650	15,050	69.52%
 Feb 06	NA	NA	NA	29,755	6,720	22.58%
 Feb 04	NA	NA	NA	43,000	10,000	23.26%
 Feb 03	NA	NA	NA	12,149	700	5.76%

 Jan 31	NA	NA	NA	7,715	6,000	77.77%
suspect *CEs* (colluding entities) are wash trading (resetting) for *volume*
90 day volume avgs cliff dive @ EOM (NR loses November's set up effort)
 PTOI     1,363,463     1,442,058     1,363,463     CDEL     593,406     1     43.52%
 PTOI     1,363,463     1,442,058     1,363,463     ETRF     298,939     2     21.92%
 PTOI     1,363,463     1,442,058     1,363,463     NITE     203,031     3     14.89%

 PTOI     1,363,463     1,442,058     1,363,463     GTSM     134,110     4       9.84%
 PTOI     1,363,463     1,442,058    1,363,463      CSTI     133,977     5       9.83%
P2O/PTOI .. this scenario may be helpful in understanding why Non Retail
embedded for over a decade in PTOI (stock) .. has angst
with P2O's ability to execute
first unlike many OTC targets (OTC is totally fungible)
P2O's founder originally accessed non toxic capital
to fund something many of us still deem jaw dropping
.. table top to Flagship in mere years .. this is significant
(far more so today than even 6 years or so ago)
it's why noting actual shareholder certs (449) vs the 1 held
via a CE .. aka colluding entities (DTC) .. matters ..
more on those CEs in a bit
the one and only time access to toxic capital came to
pass (aromatics) .. all with interest saw how their efforts'
played out .. shorting against their own certs .. seemingly
deliberate sabotage @ NF and padding certain like minded
entities' pockets over and over again
P2O was wrested back in mid August 2013 .. the newly installed
CEO infused Multiple Millions on 9.30.13 .. NRs' response to
that .. relentlessly compressing PTOI (stock) from 35c (9.30.13)
to 10c on 12.31.13
This is NRs' MO .. it is a very specific playbook Non Retail follows
in approximate order ..
NR works OTC target for cycles of money .. UP & DOWN
NR eventually goes UPSIDE DOWN
NR sanctions hit pieces .. usually in alignment with the
importation of a new *MM* (Market maker/market manipulator) to aid/abet (resetting)
Atty Firms' on hedgies' speed dial start trawling/trolling for *retail* lead plaintiff
and when that didn't *part* actual investors from their *shares* ..
NR works CONnections .. but to do that .. NR has to *expend effort*
that is what April 2011's then *record* setting volume (8M~ and change) was done for
that effort by NR took PTOI's PPS from approx 80c at the start of the month to 3.00 by EOM
by CONtrast .. NRs' recent *effort* (and set up) of November 2019 (new record setting volume month)
took PTOI from approx 035c to 11c .. which of course is why NR then focused effort against Nulixo specifically
NR works cycles of money .. making $ on the way and on the resets
back down .. this can work for weeks/months or years .. until it *CANT*
then NR brutalizes the stock
and why NR has such *angst* re: P2O/PTOI .. compressing X OTC target down to sub 1c
(again for most of the past many years .. PTOI has been held @ sub 6c) almost always
is successful in NR getting actual targets' shareholders to sell
so *extra effort* kicked in back in July 2010 .. it began the first of many *set ups*
that NR would inflict on P2O and her retail investors
then think about what happens when that doesn't work
for the most part .. my focus remains on what has come to pass since mid August 2013
a *clean slate* for NR so to speak .. re: PTOI (stock)
remember the 1 *cert* held out of the 450 total .. that 1 cert is the DTC (a CE)
the DTC holds every *share* traded on the open market via other CEs (colluding entities)
brokerage firms/insurance companies/banks .. any *entity* that trades *equities*
realize too what 450 works out to (avgs) for 125M~ (I/O) .. about 277,777 *shares* per
now we know that is *nonsense* because some actual P2O investors hold *respectively*
500k .. 750k .. 1.2M .. 1.5M .. 2M .. 2.5M .. 3M .. 3.3M .. and of course the CE (DTC) holds the
1 cert for every *NR entity* that holds equities ..
think about that .. er .. *imbalance* if X OTC target .. executes
so here is what *imo* has *changed* in the last 18 months .. give or take a month or two
for years various CEs (brokerage firms) loaned out (allowed NR to access for a $fee) ..
PTOI *shares* held in retail clients' cash accounts
now even tho' *various CE charters may say they don't allow for that* .. remember the adage
embedded for decades .. the OTC is fungible and no retail entity would ever know that
because the *more aware* brokerage firms/CEs .. would only be loaning out a % of the firms total held
so say for example .. one well known X CE/brokerage firm holds 16M PTOI *shares* in various retail accounts
software analysis reveals that for years only 1M of the 16M place GTCs to sell .. leaving 15M just sitting there
NRs' clients respective cash accounts
X brokerage isn't stupid .. they won't loan out (allow NR to access) PTOI for more than say 20%
of the 15M balance not set via GTCs (3M total *shares*) .. so this is done for years for a $fee ..
and this scheme works .. until something changes .. and various X brokerage firms (CEs) want the 20%
loan out *reduced* to 10%
now say the embedded NR entity having wiped their abusive slate clean with aromatics' flushed
out of P2O by EO 2014 .. (imo they didn't but for this example we'll say they did) .. went back to
their habit and systematically accumulated an abusive tally .. since 2015 .. so over the last 5 years or so ..
that abusive tally gets added to .. slowly/steadily .. even tho' PTOI saw *decreasing* volume YOY
from 2015 to 2016 to 2017 .. 2018 saw a slight volume increase over 2017 .. and of course we all know
what 2019's *volume* was (smidge under 24M~)
the volume done on PTOI over 4 years (2015 to 2018) comes in @ just under 70M
factor in 2019 and rounding down that volume (for simplicity's sake) the 5 year total = 92M
 69,500,806  (2015/2016/2017/2018)
 23,994,633 (2019)
 --------------------
 93,495,439 (2015 to 2019)
 JUN 2019 ~ 491,063
 JUL 2019 ~ 445,451
 PTOI ~ NOV 2019 ~ 8,847,829
 PTOI ~ DEC 2019 ~ 1,442,058
 PTOI ~ JAN 2020 ~ 1,363,463
 11/20/2019	0.07	0.0701	0.0503	0.0623	1,227,466
 11/15/2019	0.094	0.11	0.076	0.095	1,423,292
 11/14/2019	0.071	0.109	0.0675	0.0749	1,574,854
 11/13/2019	0.053	0.0704	0.053	0.07	1,208,504

 01/29/2019	0.0113	0.08	0.0103	0.02	1,046,642

 06/22/2017	0.0176	0.0202	0.0112	0.019	1,143,831
first unlike many OTC targets (OTC is totally fungible)
P2O's founder originally accessed non toxic capital
to fund something many of us still deem jaw dropping
.. table top to Flagship in mere years .. this is significant
(far more so today than even 6 years or so ago)
Hoping for success with Nulixo amid opposition
I think Steve Price never foresaw the battle going on between pro and con within P2O. Why should he update into this toxic garbage dump. There is a lot of money to be made in this emerging market as we have seen with the recent 260 million dollar investment and I would bet he has encountered strong opposition from those trying to malign their own agenda. He and his team know what they’re doing. I think he is better off to get his ducks in a row then let the world in on his successful enterprise. Also plastic waste is a nuisance of disgust on our beautiful planet and the world will applaud the riddance of it. Good luck to the believers! Hang in there!
nice to see ..
of course it's not surprising it's out of Canada ..
may that migrate to the US b4 too much longer
just last week watched a NR entity working an SMB @ this site
illegally hack into a company's website to alter content
the DESPERATION by an UPSIDE DOWN NR (non retail) entity
after trying to control said OTC's target's *outcome* for over a decade now ..
is off the charts these days .. hmmm
thx for the link/read 7/10/11
4kids
Changes coming!!!
Anonymous internet trolls cannot hide behind a forum that encourages, enables, and empowers behavior as listed below...
https://www.blogto.com/city/2020/01/toronto-company-just-successfully-sued-some-anonymous-internet-trolls-over-100k/
Changes coming!!!
Anonymous internet trolls cannot hide behind a forum that encourages, enables, and empowers behavior as listed below...
https://www.blogto.com/city/2020/01/toronto-company-just-successfully-sued-some-anonymous-internet-trolls-over-100k/
PTOI >> MM Monthly November 2019
====================
PTOI *Volume by Month* 2019
     JAN 2019 ~ PTOI   1,651,632   797,034     1,651,632    NITE  998,043    1    60.43% (7 reporting)
     FEB 2019 ~ PTOI   2,076,767   1,651,632   3,728,399    NITE  918,349    1    44.22% (6 reporting)
     MAR 2019 ~ PTOI   1,612,549   2,076,767   5,340,948    CDEL  670,739    1    41.59% (7 reporting)
     APR 2019 ~ PTOI   2,499,579   1,612,549   7,840,527    NITE  1,049,696  1    41.99% (7 reporting)
     MAY 2019 ~ PTOI   858,637     2,499,579   8,699,164    NITE  387,319    1    45.11% (7 reporting)
     JUN 2019 ~ PTOI   491,063     858,637     9,190,227    CDEL  244,292    1    49.75% (6 reporting)
     JUL 2019 ~ PTOI   445,451     491,063     9,635,678    ETRF  172,229    1    38.66% (5 reporting)
     AUG 2019 ~ PTOI   772,572     445,451    10,408,250    CDEL  565,950    1    73.26% (6 reporting)
     SEP 2019 ~ PTOI   1,107,189   772,572    11,515,439    ETRF  276,054    1    24.93% (7 reporting)
     OCT 2019 ~ PTOI   2,189,307   1,107,189  13,704,746    CDEL  863,594    1    39.45% (6 reporting)
     NOV 2019 ~ PTOI   8,847,829   2,189,307  22,580,375    CDEL 3,429,608   1    38.76% (9 reporting)
https://otce.finra.org/otce/marketStatistics/monthlyShareVolume
PTOI ~ November 2019 .. MM Monthly
 PTOI   8,847,829   2,189,307   22,580,375   CDEL   3,429,608   1  38.76%

 PTOI   8,847,829   2,189,307   22,580,375   NITE   2,199,843   2  24.86%

 PTOI   8,847,829   2,189,307   22,580,375   ETRF   876,858     3  9.91%
 PTOI   8,847,829   2,189,307   22,580,375   GTSM   831,542     4  9.40%

 PTOI   8,847,829   2,189,307   22,580,375   ASCM   787,895     5  8.90%

 PTOI   8,847,829   2,189,307   22,580,375   CSTI   494,365     6  5.59%
 PTOI   8,847,829   2,189,307   22,580,375   CFGN   188,518     7  2.13%

 PTOI   8,847,829   2,189,307   22,580,375   OTCX   38,000      8  0.43%

 PTOI   8,847,829   2,189,307   22,580,375   INTL   1,200       9  0.01%
duly noted ~ ASCM/CFGN/INTL ~ importation for PTOI's *record* setting volume
month of November 2019 (which replaced April 2011's *set up* by NR) and of course CANT/GTSM
the given is the obvious .. timing tho' intriguing
PTOI Historical November 2019
(8,847,829) .. 0351c to 11c
 11/29/2019	0.0486	0.06	0.0431	0.05	88,673
 11/27/2019	0.056	0.06	0.05	0.0555	103,310
 11/26/2019	0.0594	0.0595	0.056	0.0595	32,248
 11/25/2019	0.05	0.06	0.05	0.0585	159,641
 11/22/2019	0.06	0.0647	0.0545	0.0642	44,177
 11/21/2019	0.0624	0.0639	0.055	0.059	125,735
 11/20/2019	0.07	0.0701	0.0503	0.0623	1,227,466
 11/19/2019	0.098	0.098	0.07	0.077	338,612
 11/18/2019	0.09	0.109	0.0885	0.095	525,765
 11/15/2019	0.094	0.11	0.076	0.095	1,423,292
 11/14/2019	0.071	0.109	0.0675	0.0749	1,574,854
 11/13/2019	0.053	0.0704	0.053	0.07	1,208,504
 11/12/2019	0.047	0.059	0.047	0.059	451,420
 11/11/2019	0.049	0.05	0.046	0.049	250,083
 11/08/2019	0.036	0.046	0.036	0.045	444,222
 11/07/2019	0.0372	0.0375	0.0372	0.0372	48,327
 11/06/2019	0.0371	0.0371	0.0358	0.0371	41,378
 11/05/2019	0.0352	0.0375	0.0352	0.0356	357,077
 11/04/2019	0.036	0.0375	0.0354	0.0355	400,141
 11/01/2019	0.0351	0.0351	0.0351	0.0351	2,904
PTOI Historical April 2011
APR ~ Total Share Volume 8,093,592/to this day PTOI's *record* setting volume .. $set up .. 82c to 3.00
https://investorshub.advfn.com/boards/read_msg.aspx?message_id=128315021
 04/29/2011	2.24	3.00	2.05	2.78	417,170
 04/28/2011	1.96	2.25	1.94	2.25	174,529
 04/27/2011	1.57	2.05	1.55	1.92	392,824
 04/26/2011	1.59	1.64	1.52	1.61	285,316
 04/25/2011	1.87	1.87	1.68	1.68	286,864
 04/21/2011	1.22	1.84	1.05	1.84	736,234
 04/20/2011	1.96	2.08	1.17	1.26	949,402
 04/19/2011	2.15	2.15	2.00	2.14	171,325
 04/18/2011	2.05	2.17	2.05	2.14	131,592
 04/15/2011	2.20	2.25	2.00	2.17	234,742
 04/14/2011	2.10	2.32	1.90	2.25	375,545
 04/13/2011	2.21	2.38	1.88	2.3	692,446
 04/12/2011	1.80	2.12	1.78	2.12	686,209
 04/11/2011	1.40	1.93	1.30	1.75	907,578
 04/08/2011	1.10	1.24	1.04	1.24	220,368
 04/07/2011	1.05	1.14	0.96	1.11	160,793
 04/06/2011	1.01	1.10	0.98	1.05	155,038
 04/05/2011	1.07	1.07	0.95	1.00	322,332
 04/04/2011	0.88	1.13	0.85	1.04	658,574
 04/01/2011	0.84	0.85	0.82	0.85	138,711
https://investorshub.advfn.com/boards/read_msg.aspx?message_id=145949296
4kids
PTOI 10Q Filed News Alert: Quarterly Report (10-q) 12/16/2019 04:32:48 PM
https://www.sec.gov/Archives/edgar/data/1381105/000149315219019294/form10-q.htm
World's largest pension fund halts stock lending to short sellers
Reuters By Tim Kelly
TOKYO (Reuters) - Japan's Government Pension Investment Fund (GPIF), the world's largest pension fund, has suspended stock lending for short selling, calling the practice inconsistent with its responsibilities as a long-term investor.
The move, announced by the GPIF on Tuesday, is a blow for short sellers, who rely on securities lending to bet against companies and who are facing renewed moves in a number of countries to curb their activities.
"The current stock lending scheme lacks transparency in terms of who is the ultimate borrower and for what purpose they are borrowing," the GPIF said on its website.
The move by the fund will affect shares in its 42.5 trillion yen ($391.20 billion) foreign equities portfolio.
Japanese and overseas shares account for half of the GPIF's 160 trillion yen worth of assets. It said it will continue to lend debt securities and may reconsider the halt to foreign stock lending if it sees an improvement in transparency. It does not lend its holdings of domestic shares.
Short sellers borrow shares and immediately sell them, betting the price will fall before they buy back the shares and return them, pocketing the difference.
Advocates see them as a healthy counterbalance to investor over-confidence and corporate spin. Critics argue they are destabilising because they have an incentive to drive down a company's share price.
Elon Musk, the chief executive of Tesla, a popular target for short sellers, was quick to applaud the GPIF's move.
"Bravo, right thing to do! Short selling should be illegal," the high tech entrepreneur said in a tweet.
Musk has previously criticised fund managers for lending shares for hedge funds to short, saying the fund firms made "excessive profit" from the practice.
Securities lending has emerged as a small but significant source of extra returns for funds. GPIF earned 37.58 billion yen ($345.91 million) in fees from lending shares from its foreign equity portfolio over three years to the end of its 2018 financial year.
BlackRock, the world’s largest asset manager, reported total securities lending revenue of $597 million in 2017, compared with $579 million in 2016, according to a securities filing.
In the July-September quarter, GPIF reported a profit of 1.8 trillion yen. Amid Japan's ultra-low interest rates, the fund, which is closely watched by global investors, has retreated from unprofitable domestic bonds in favour of foreign assets.
($1 = 108.6400 yen)
(Additional reporting by Takashi Umekawa in Tokyo; editing by Andrew Heavens, Larry King and Carmel Crimmins)
https://www.yahoo.com/finance/news/worlds-largest-pension-fund-halts-124400162.html
PTOI >> MM Monthly October 2019 PTOI 1,107,189 772,572 11,515,439 ARCA 16,300 6 1.47% 09:55:20 0.0171 16300 OTO .. targeted trade done below 0185 *bid* 09:30:14 0.0248 16300 OTO .. hidden (B/024/34250 .. A/028/165797)
ah yes .. the *scam* of NR (non retail) who illegally manipulate OTC targets by rote .. ;)
reminder .. GTSM/CANT
reminder .. (July 2019) PTOI had the lowest *volume* reported by Non Retail (NR) in 2019
with the then classic NR ploy of parking decoy OTCX on bid and ask almost daily ..
ECN for hire swapped out in October .. ARCA replaced OTCX for *last position reporting of 16300*
interesting to note the 16300 was also done on 9.24.19 .. and noted in September MM Monthly by ARCA
https://investorshub.advfn.com/boards/read_msg.aspx?message_id=151577734
https://investorshub.advfn.com/boards/read_msg.aspx?message_id=151360381
https://otctransparency.finra.org/otctransparency/AtsIssueData
October's version was done on 10.9.19
https://investorshub.advfn.com/boards/replies.aspx?msg=151596308
====================
PTOI *Volume by Month* 2019
    JAN 2019 ~ PTOI     1,651,632   797,034     1,651,632    NITE    998,043    1    60.43% (7 reporting)
    FEB 2019 ~ PTOI     2,076,767   1,651,632   3,728,399    NITE    918,349    1    44.22% (6 reporting)
    MAR 2019 ~ PTOI     1,612,549   2,076,767   5,340,948    CDEL    670,739    1    41.59% (7 reporting)
    APR 2019 ~ PTOI     2,499,579   1,612,549   7,840,527    NITE    1,049,696  1    41.99% (7 reporting)
    MAY 2019 ~ PTOI     858,637     2,499,579   8,699,164    NITE    387,319    1    45.11% (7 reporting)
    JUN 2019 ~ PTOI     491,063     858,637     9,190,227    CDEL    244,292    1    49.75% (6 reporting)
    JUL 2019 ~ PTOI     445,451     491,063     9,635,678    ETRF    172,229    1    38.66% (5 reporting)
    AUG 2019 ~ PTOI     772,572     445,451    10,408,250    CDEL    565,950    1    73.26% (6 reporting)
    SEP 2019 ~ PTOI     1,107,189   772,572    11,515,439    ETRF    276,054    1    24.93% (7 reporting)
    OCT 2019 ~ PTOI     2,189,307   1,107,189  13,704,746    CDEL    863,594    1    39.45% (6 reporting)
PTOI ~ October 2019 .. MM Monthly
 PTOI    2,189,307    1,107,189    13,704,746    CDEL    863,594    1    39.45%

 PTOI    2,189,307    1,107,189    13,704,746    ETRF    522,017    2    23.84%
 PTOI    2,189,307    1,107,189    13,704,746    NITE    375,484    3    17.15%

 PTOI    2,189,307    1,107,189    13,704,746    GTSM    306,088    4    13.98%
 PTOI    2,189,307    1,107,189    13,704,746    CSTI    105,824    5    4.83%

 PTOI    2,189,307    1,107,189    13,704,746    ARCA    16,300     6    0.74%
https://otce.finra.org/otce/marketStatistics/monthlyShareVolume
PTOI Volume by Month July 2018 ~ October 2019
      JUL 2018 ~ 1,198,826  .. 2018 YTD Volume ~ 7,810,868
      AUG 2018 ~ 2,328,321 .. highest volume month 2018
      SEP 2018 ~ 1,225,259
      OCT 2018 ~ 1,023,420 .. 2018 YTD Volume ~ 12,387,868
      NOV 2018 ~ 739,525
      DEC 2018 ~ 797,034 .. 2018 YTD Volume ~ 13,924,427

      JAN 2019 ~ 1,651,632 .. 604,990 sans 1.29.19's *volume*
      FEB 2019 ~ 2,076,767 .. note 2M + 400k = 2.4M~
      MAR 2019 ~ 1,612,549 .. note 1.6M identical to Jan 2019 (washed effort)
      APR 2019 ~ 2,499,579 .. highest volume in 2019 (note 2.4M - 400k  = 2M)
      MAY 2019 ~ 858,637 .. 2019 YTD Volume ~ 8,699,164
      JUN 2019 ~ 491,063 .. 2019 YTD Volume ~ 9,190,227
      JUL 2019 ~ 445,451 .. lowest volume month in 2019 .. 2019 YTD Volume ~ 9,635,678
      AUG 2019 ~ 772,572 .. 2019 YTD Volume ~ 10,408,250
      SEP 2019 ~ 1,107,189 .. 2019 YTD Volume ~ 11,515,439
      OCT 2019 ~ 2,189,307 .. 2019 YTD Volume ~ 13,704,746
PTOI Volume by Month January 2017 ~ June 2018
             JAN 2017 = 511,955
             FEB 2017 = 507,372
             MAR 2017 = 621,468
             APR 2017 = 341,667 .. lowest volume month 2017
             MAY 2017 = 1,975,943
             JUN 2017 = 3,220,064 .. 1M+ volume day on 6.22.17 .. next 1M+ volume day on  1.29.19
             JUL 2017 = 478,262
             AUG 2017 = 1,167,489
             SEP 2017 = 480,903
             OCT 2017 = 1,848,518
             NOV 2017 = 757,927
             DEC 2017 = 1,629,015

             JAN 2018 = 2,039,578 .. (London Calling front half Jan imo approx 750,000 shares)
             FEB 2018 = 510,679
             MAR 2018 = 404,356 .. lowest volume month 2018
             APR 2018 = 622,409
             MAY 2018 = 1,983,852
             JUN 2018 = 1,051,168
https://investorshub.advfn.com/boards/read_msg.aspx?message_id=145949296
hmmm
4kids
SEC Charges 18 Traders in $31 Million Stock Manipulation Scheme
FOR IMMEDIATE RELEASE
2019-216
Washington D.C., Oct. 16, 2019 —
The Securities and Exchange Commission has filed an emergency action and obtained an asset freeze against 18 traders in a scheme to manipulate more than 3,000 U.S.-listed securities for over $31 million in illicit profits.
The SEC alleges that the traders, who are primarily based in China, manipulated the prices of thousands of thinly traded securities by creating the false appearance of trading interest and activity in those stocks, thereby enabling them to reap illicit profits by artificially boosting or depressing stock prices. For example, according to the SEC's complaint, the traders used multiple accounts to place several small sell orders to drive down a stock’s price before using a different set of accounts to buy larger amounts of the stock at the artificially low prices. After accumulating their position, the traders then flipped the script and placed several small buy orders to push up prices so they could then sell their stock at artificially high prices.
"We allege that defendants engaged in an extensive manipulation scheme and went to great lengths to evade detection, placing trades in over one hundred separate accounts at several different brokerage firms and submitting falsified documents to open new accounts in the names of others," said Joseph G. Sansone, Chief of the SEC's Market Abuse Unit. "Despite their efforts, the SEC staff was able to uncover the connections between these seemingly unrelated accounts and expose the defendants' coordinated pattern of illicit trading."
In a parallel action, the U.S. Attorney's Office for the District of Massachusetts announced criminal charges against two of the traders, Jiali Wang and Xiaosong Wang.
The SEC's complaint filed in federal court in Boston and unsealed today, charges the traders with violating and aiding and abetting violations of the antifraud provisions of the securities laws. In addition to the asset freeze and other emergency relief obtained, the SEC seeks disgorgement of ill-gotten gains plus interest, penalties, and injunctive relief.
The SEC's investigation was conducted by Andrew Palid and Michele T. Perillo of the SEC's Market Abuse Unit in the Boston Regional Office with assistance from John Marino of the Market Abuse Unit, and was supervised by Mr. Sansone. The litigation will be led by Eric Forni of the Boston Regional Office and Mr. Palid. The SEC appreciates the assistance of the U.S. Attorney's Office for the District of Massachusetts, the Federal Bureau of Investigation, and the Financial Industry Regulatory Authority.
https://www.sec.gov/news/press-release/2019-216
original link courtesy of thepennyguru
PTOI 8K FILED News News Alert: Current Report Filing (8-k) 10/08/2019 05:17:38 PM
Item 1.01 Entry into a Material Definitive Agreement.
On October 2, 2019, Plastic2Oil, Inc., a Nevada corporation (the “Company”), entered into an agreement (“Agreement”) with Nulixo, Inc. (the “Buyer”), whereby the Buyer agreed to appoint the Company as the exclusive supplier for plastic to oil processors for a period of twenty (20) years. Specifically, the Buyer agrees to purchase at least eight (8) processors over a period of three (3) years, and at least one (1) to be ordered upon the effectiveness of the Agreement. Pursuant to the first purchase order, for which the company is awaiting initial funding of the purchase order, the Buyer ordered two (2) processors for Six Million Dollars ($6,000,000) with an initial payment of Three Million Dollars ($3,000,000). Any subsequent processor purchased shall be at a fixed rate of ($3,000,000). In addition, the Company has further agreed to provide monitoring and servicing services for a fee to be determined on a case by case basis.
https://www.sec.gov/Archives/edgar/data/1381105/000149315219015252/form8-k.htm
==================
curious to see re: RC's Master Agreement
https://investorshub.advfn.com/boards/read_msg.aspx?message_id=140571930
reminder .. HM
http://heddleshipyards.com/
PTOI >> MM Monthly September 2019
ah yes .. the *scam* of NR (non retail) who illegally manipulate OTC targets by rote .. ;)
interesting to see that 24% for September 2019 .. wash trading 101 by Non Retail .. see below
reminder .. GTSM/CANT
reminder .. (July 2019) PTOI had the lowest *volume* reported by Non Retail (NR) in 2019
with the classic NR ploy of parking decoy OTCX on bid and ask almost daily ..
with nary one trade *reported* by OTCX for the entire month of July .. OCTX mirrored ETRF in August
and last month .. OCTX came in 7th out of 7 (September 2019) .. (5,304 7 0.48%)
   JAN 2019 ~ PTOI     1,651,632   797,034     1,651,632    NITE    998,043    1    60.43% (7 reporting)
   FEB 2019 ~ PTOI     2,076,767   1,651,632   3,728,399    NITE    918,349    1    44.22% (6 reporting)
   MAR 2019 ~ PTOI     1,612,549   2,076,767   5,340,948    CDEL    670,739    1    41.59% (7 reporting)
   APR 2019 ~ PTOI     2,499,579  1,612,549   7,840,527     NITE    1,049,696  1    41.99% (7 reporting)
   MAY 2019 ~ PTOI     858,637     2,499,579   8,699,164    NITE    387,319    1    45.11% (7 reporting)
   JUN 2019 ~ PTOI     491,063     858,637     9,190,227    CDEL    244,292    1    49.75% (6 reporting)
   JUL 2019 ~ PTOI     445,451     491,063     9,635,678    ETRF    172,229    1    38.66% (5 reporting)
   AUG 2019 ~ PTOI     772,572     445,451    10,408,250    CDEL    565,950    1    73.26% (6 reporting)
   SEP 2019 ~ PTOI     1,107,189   772,572    11,515,439    ETRF    276,054    1    24.93% (7 reporting)
note if one adds the first 3 *reporting* to Finra for September 2019 .. % comes to 72.48% .. 73.26 - 72.48 = 0.78 (difference of)
 PTOI    1,107,189    772,572    11,515,439    ETRF    276,054    1    24.93%
 PTOI    1,107,189    772,572    11,515,439    NITE    266,099    2    24.03%

 PTOI    1,107,189    772,572    11,515,439    CDEL    260,456    3    23.52%
 PTOI    1,107,189    772,572    11,515,439    GTSM    239,787    4    21.66%

 PTOI    1,107,189    772,572    11,515,439    CSTI    43,189     5    3.9%
 PTOI    1,107,189    772,572    11,515,439    ARCA    16,300     6    1.47%
 PTOI    1,107,189    772,572    11,515,439    OTCX     5,305     7    0.48%
https://otce.finra.org/otce/marketStatistics/monthlyShareVolume
PTOI Volume July 2018 to September 2019
     JUL 2018 ~ 1,198,826  .. 2018 YTD Volume ~ 7,810,868
     AUG 2018 ~ 2,328,321 .. highest volume month 2018
     SEP 2018 ~ 1,225,259
     OCT 2018 ~ 1,023,420 .. 2018 YTD Volume ~ 12,387,868
     NOV 2018 ~ 739,525
     DEC 2018 ~ 797,034 .. 2018 YTD Volume ~ 13,924,427

     JAN 2019 ~ 1,651,632 .. 604,990 sans 1.29.19's *volume*
     FEB 2019 ~ 2,076,767 .. note 2M + 400k = 2.4M~
     MAR 2019 ~ 1,612,549 .. note 1.6M identical to Jan 2019 (washed effort)
     APR 2019 ~ 2,499,579 .. highest volume in 2019 (note 2.4M - 400k  = 2M)
     MAY 2019 ~ 858,637 .. 2019 YTD Volume ~ 8,699,164
     JUN 2019 ~ 491,063 .. 2019 YTD Volume ~ 9,190,227
     JUL 2019 ~ 445,451 .. lowest volume month in 2019 .. 2019 YTD Volume ~ 9,635,678
     AUG 2018 ~ 772,572 .. 2019 YTD Volume ~ 10,408,250
     SEP 2018 ~ 1,107,189 .. 2019 YTD Volume ~ 11,515,439
PTOI Volume January 2017 to June 2018
            JAN 2017 = 511,955
            FEB 2017 = 507,372
            MAR 2017 = 621,468
            APR 2017 = 341,667 .. lowest volume month 2017
            MAY 2017 = 1,975,943
            JUN 2017 = 3,220,064 .. 1M+ volume day on 6.22.17 .. next 1M+ volume day on  1.29.19
            JUL 2017 = 478,262
            AUG 2017 = 1,167,489
            SEP 2017 = 480,903
            OCT 2017 = 1,848,518
            NOV 2017 = 757,927
            DEC 2017 = 1,629,015

            JAN 2018 = 2,039,578 .. (London Calling front half Jan imo approx 750,000 shares)
            FEB 2018 = 510,679
            MAR 2018 = 404,356 .. lowest volume month 2018
            APR 2018 = 622,409
            MAY 2018 = 1,983,852
            JUN 2018 = 1,051,168
https://investorshub.advfn.com/boards/read_msg.aspx?message_id=145949296
hmmm
4kids
Short Sale Circuit Breaker
The SEC adopted amendments to Regulation SHO with a compliance date of November 10, 2010. Among the rule changes, the SEC introduced Rule 201 (Alternative Uptick Rule), a short sale-related circuit breaker that when triggered, will impose a restriction on prices at which securities may be sold short. The SEC also issued guidance for broker-dealers wishing to mark certain qualifying orders 201cshort exempt.201d For more details, refer to Amendments to Regulation SHO (Release 34-61595).
Trade Date Download Link File Creation Timestamp
Friday, October 4,2019
Download
10/4/2019 4:15:26 AM
Symbol Security Name Market Category Trigger Time
GPRO GoPro, Inc. Class A Common St Q 10/3/2019 9:30:00 AM
TC TuanChe Limited ADS R 10/3/2019 9:30:00 AM
CFFAW CF Finance Acquisition Wt R 10/3/2019 9:30:00 AM
AXTI AXT Inc Q 10/3/2019 9:30:00 AM
ANGO AngioDynamics, Inc. Q 10/3/2019 9:30:00 AM
ENLV Enlivex Therapeutics Ltd. R 10/3/2019 9:30:00 AM
JAGX Jaguar Health, Inc. Cmn R 10/3/2019 9:30:00 AM
MTFB Motif Bio plc ADR R 10/3/2019 9:30:01 AM
RECN Resources Connection Inc Q 10/3/2019 9:30:03 AM
SES Synthesis Energy Sytems Inc R 10/3/2019 9:30:57 AM
PNTG The Pennant Group, Inc. Q 10/3/2019 9:31:15 AM
SQBG Sequential Brands Group Cmn R 10/3/2019 9:31:26 AM
SNNA Sienna Biopharmaceuticals Cmn Q 10/3/2019 9:31:45 AM
PSTVZ PLUS THERAPEUTICS, Wts R 10/3/2019 9:32:43 AM
MESO Mesoblast Limited ADS Q 10/3/2019 9:33:43 AM
OCGN Ocugen, Inc. Common Stock R 10/3/2019 9:33:53 AM
CYRXW CryoPort, Inc. Warrants R 10/3/2019 9:36:06 AM
AMRH Ameri Holdings, Inc. Cm St R 10/3/2019 9:37:35 AM
RVLT Revolution Lighting Tech Cmn R 10/3/2019 9:41:48 AM
QRTEB Qurate Retail Sr B Cm Q 10/3/2019 9:45:00 AM
SCON SUPERCONDUCTOR TECH R 10/3/2019 9:46:07 AM
DEST Destination Maternity Cp Q 10/3/2019 9:46:16 AM
AMRS Amyris, Inc. Q 10/3/2019 9:46:50 AM
MOSY MoSys, Inc. R 10/3/2019 9:48:03 AM
BCYC Bicycle Therapeutics plc ADS Q 10/3/2019 9:52:17 AM
CTXRW Citius Pharmaceuticals Wt R 10/3/2019 9:53:19 AM
DLPNW Dolphin Entertainment, WTS R 10/3/2019 9:59:19 AM
NAKD Naked Brand Group Limited Ord R 10/3/2019 10:00:40 AM
CGIX Cancer Genetics, Inc. R 10/3/2019 10:01:23 AM
NDRAW ENDRA Life Sciences Inc. WT R 10/3/2019 10:02:19 AM
TLGT Teligent, Inc. Common Stock Q 10/3/2019 10:03:55 AM
QUIK QuickLogic Corporation R 10/3/2019 10:03:59 AM
HYACW Haymaker Acq Corp. II Warrant R 10/3/2019 10:09:23 AM
XSPA XpresSpa Group, Inc. R 10/3/2019 10:11:20 AM
DMTKW DermTech, Inc. Warrant R 10/3/2019 10:13:14 AM
GSM Ferroglobe PLC OS Q 10/3/2019 10:13:59 AM
PHIO Phio Pharmaceuticals Corp. R 10/3/2019 10:15:10 AM
BNTC Benitec Biopharma Ltd ADS R 10/3/2019 10:15:57 AM
TROV TrovaGene, Inc. Common Stock R 10/3/2019 10:17:33 AM
BVSN BroadVision Inc R 10/3/2019 10:18:47 AM
LIVX LiveXLive Media, Inc. Cm St R 10/3/2019 10:21:29 AM
STNLW Sentinel Energy Services WT R 10/3/2019 10:23:02 AM
FAMI Farmmi, Inc. Ordinary Shs R 10/3/2019 10:25:27 AM
VXRT Vaxart, Inc. R 10/3/2019 10:38:56 AM
VRML Vermillion, Inc. R 10/3/2019 10:43:40 AM
NNDM Nano Dimension Ltd ADS R 10/3/2019 10:47:31 AM
SAUC Diversified Restaurant Hldgs R 10/3/2019 10:47:43 AM
STKL SunOpta, Inc Q 10/3/2019 11:05:00 AM
OTLKW Outlook Therapeutics Ser A Wt R 10/3/2019 11:06:24 AM
CUR Neuralstem, Inc. Common Stock R 10/3/2019 11:35:13 AM
TKKSW TKK Symphony Acquisition WT R 10/3/2019 11:51:32 AM
APEX Apex Global Brands Inc. R 10/3/2019 11:51:55 AM
ALIM Alimera Sciences Inc Q 10/3/2019 11:57:12 AM
CREX Creative Realities Inc. Cmn R 10/3/2019 12:05:06 PM
THOR Synthorx Inc Cmn Stk Q 10/3/2019 12:05:44 PM
MHLD Maiden Holdings, Ltd. Q 10/3/2019 12:10:35 PM
THCAW Tuscan Holdings Corp. II Wt R 10/3/2019 12:20:11 PM
PETZ TDH Holdings, Inc. Cmn Shrs R 10/3/2019 12:23:19 PM
GNPX Genprex, Inc. CM R 10/3/2019 12:30:18 PM
HSACW Health Sciences Acq Warrants R 10/3/2019 12:46:30 PM
RAVE Rave Restaurant Group, Inc. R 10/3/2019 12:47:31 PM
THWWW Target Hospit Cp Wts R 10/3/2019 12:58:43 PM
KZIA Kazia Therapeutics Limited ADS R 10/3/2019 1:04:41 PM
INPX Inpixon Common Stock R 10/3/2019 1:35:42 PM
TBLTW ToughBuilt Ind Warrant R 10/3/2019 1:50:23 PM
JFU 9F Inc. ADS Q 10/3/2019 1:58:23 PM
EYEGW Eyegate Pharmaceuticals Wts R 10/3/2019 2:01:32 PM
WAFU Wah Fu Education Group Ltd Ord R 10/3/2019 2:15:37 PM
ARTL Artelo Biosciences, Inc. CS R 10/3/2019 2:17:09 PM
EYEG Eyegate Pharmaceuticals Cm R 10/3/2019 2:43:17 PM
USWSW U.S. Well Services, Inc. Wts R 10/3/2019 3:06:05 PM
LKCO Luokung Technology Ord Shs R 10/3/2019 3:24:25 PM
DEACW Diamond Eagle Acquisition WTS R 10/3/2019 3:36:13 PM
HHHHW Wealthbridge Acquisitn Ltd Wts R 10/3/2019 3:40:16 PM
PLL Piedmont Lithium Limited ADS R 10/3/2019 3:44:51 PM
PHUNW Phunware, Inc. Warrants R 10/3/2019 3:53:09 PM
HHHHR Wealthbridge Acquistn Ltd Rts R 10/3/2019 3:59:26 PM
TAST Carrols Restaurant Group, Inc. Q 10/3/2019 3:59:34 PM
IPIX ..
truly worth *digesting* the last week or so of IPIX *trades*
there are a few things that a decade of observation and documentation has revealed to me
first and foremost .. NR/CEs do not want an educated retail investor
a decade ago (b4 2 events in 2010 came to pass .. Finra's live DRS link and May 2010's flash crash
when then SEC Chair had to publicly admit that in May 2010 that the SEC had no way to reconstruct
any trade .. regardless of where *traded* .. but rather the SEC had to rely on the various brokerage firms
yada yada for that info) .. that it was *easy* to CON retail via SMBs .. NRs' embeds and trading crews
had a slick op whereby .. literally very specific *aliases* could show up on a SMB .. and retail would sell first and ask questions second ..
that *controlled outcome* started to change as the rot of the system was revealed from 2008 into 2010
what has been more disgusting to me .. has been to watch those who *normalize* the abnormal ..
(basically trying to condition by rote) legitimize the illegal manipulation .. and those who aid and abet
those specific entities who rig the game by rote (SEC/DTCC the list goes on for a while)
on any given day for years now *imo* .. IPIX has max 20% retail .. 80% non retail
this NR entity *imo* (probably at least 2 maybe 3) .. has for years now tried to kill off the company ..
NRs' hand off from last significant take up @ EO 2014 .. into 2015
when Overstock/OSTK took on GS (and *imo* most of what has been done against targets and retail) has been by a loosely woven network (i used to call it the old
boy network) .. that ran .. if memory serves .. about 5 years and about $20Million in discovery costs .. part of discovery is ascertaining who is behind the trades (clearly excluding retail investors here)
this is why *documentation* is despised by Non Retail and their minions
I get frustrated when folks I respect use words like *slop* or mischief as if this shit
is innocent in nature ..
it is anything but ..
these SOBs don't give a damn about what the *target* does .. it could be life saving science .. or life altering technology ..
they don't care .. literally
to those who illegally rig the game .. it always comes down to being upside down and trying to kill the target .. no matter how long it takes
======
last week an LT IPI investor asked me about *wash trading and resets*
i view them as 2 separate categories that can occasionally overlap ..
this morning another IPI investor sent me this:
some of you may recognize her name .. I watched her for years as a guest on CNBC
Naked, Short and Greedy
Wall Street's Failure to Deliver
By Susanne Trimbath
https://spiramus.com/naked-short-and-greedy
new book due out ..
here is a tweet from Ms. Trimbath
True. NSCC resubmits all fails so they get a new start date the next morning. Fails went dark pool after Reg SHO put them in the spotlight. NYSE member balance sheets still report hundreds of billions in FTDs and FTRs that don't show up in NSCC/SEC numbers.
resubmits all fails so they get a new start date the next morning
Naked, Short and Greedy resubmits all fails so they get a new start date the next morning
Wall Street's Failure to Deliver
By Susanne Trimbath
https://spiramus.com/naked-short-and-greedy
new book due out ..
here is a tweet from Ms. Trimbath (watched her appearances .. years .. on CNBC)
True. NSCC resubmits all fails so they get a new start date the next morning. Fails went dark pool after Reg SHO put them in the spotlight. NYSE member balance sheets still report hundreds of billions in FTDs and FTRs that don't show up in NSCC/SEC numbers.
i refer to this:
as *resets r possible* .. as in CEs' (colluding entities) reset start date ..
it only took 10 years for that CONfirmation
input courtesy of thepennyguru
4kids
IPIX .. 9.27.19 trades .. curious to see if this *pattern* by NR continues on tomorrow and into next week .. ** 76165 = 1965/200/35k combo/21k combo/9k x2 *** NITE 0.11 273,600 10:06
DRS % .. 500993/660343 .. 75.86% .. (61.90% Thursday)
interesting to note *trades* not marked on Friday ~ 660343 - 500993 = 159,350
Hidden trades .. 55855/660343 .. 8.4% .. (32.69% Thursday) .. since 4.26.19 interesting change out
if one adds in the 76165 (hidden?) to 55855 = 132020/Hidden .. 132020/660343 = 19.99%
Liquidity .. .008c .. (HOD .113c/LOD .105c)
NR = Just A Few Probs
10 day & 90 day vol algo maintained @ a cost of 75.86% with an .008c *liquidity* range .. ;)
NRs' CONstant wash trades/resets remains blatant
https://investorshub.advfn.com/boards/read_msg.aspx?message_id=151421752
 15:53:35		0.11	3000	OTO .. @ UC ask .. note 35k = 3k/5k/27k
 15:53:12		0.11	5000	OTO .. @ bid
 15:53:06		0.11	27000	OTO .. @ bid .. note 27k = 6k/21k
 15:47:26		0.11	1500	OTO .. hidden (B/108 .. A/112)
 15:12:28		0.1105	2250	OTO .. hidden .. mirrored ..  9:30:22 .. (B/107 .. A/112)
 15:02:58		0.11	7000	OTO .. hidden .. mirrored  (B/107 .. A/112)
 14:57:28		0.11	6000	OTO .. @ bid .. note 27k = 6k/21k
 14:57:05		0.11	21000	OTO .. @ jumped bid .. note 21k = 13940/6060/1k
 14:48:37		0.109	7000	OTO .. @ bid
 14:47:15		0.109	5100	OTO .. @ jumped bid
 14:47:15		0.11	3000	OTO .. hidden .. mirrored (B/109 .. A/112)
 14:15:07		0.106	13940	OTO .. @ bid .. note 21k = 13940/6060/1k
 14:15:06		0.106	6060	OTO .. @ bid
 13:37:32		0.106	1000	OTO .. @ bid
 13:22:34		0.1102	2300	OTO .. hidden (B/106 .. A/112)
 13:02:36		0.109	7500	OTO .. hidden (B/106 .. A/112)
 12:59:56		0.1117	2000	OTO .. hidden (B/106 .. A/112)
 12:05:00		0.11	11900	OTO .. @ UC ask
 11:46:45		0.109	1965	OTO .. hidden (B/106 .. A/113)
 11:12:26		0.11	20000	OTO .. hidden .. mirrored (B/106 .. A/113)
 11:01:57		0.113	12848	OTO .. @ ask .. 20k = 12848/1202/5950
 11:01:57		0.113	1202	OTO .. @ ask
 11:01:57		0.11	5950	OTO .. @ ask
 10:58:58		0.11	200	OTO .. @ ask
 10:57:27		0.11	200	OTO .. @ ask
 10:50:10		0.11	838	OTO .. @ ask
 10:50:06		0.1084	1000	OTO .. hidden (B/106 .. A/11)
 10:29:44		0.106	32500	OTO .. @ relo/d bid
 10:29:40		0.11	232600	OTO .. @ NITE's bid .. relo/s bid .. note 273600 = 232600/41k
 10:27:04		0.11	41000	OTO .. @ relo/d bid
 10:27:02		0.1101	76165	OTO .. @ jumped bid (Per AT PRO trade @ 11c) .. may be hidden or AON ** mirrored
 10:26:56		0.11	5000	OTO .. @ bid  .. (B size showing 278500) .. only NITE showing .. see below ***
 10:26:52		0.112	835	OTO .. @ bid
 10:26:45		0.112	9000	OTO .. @ bid
 10:26:40		0.112	9000	OTO .. @ bid
 10:26:32		0.113	5000	OTO .. @ ask
 10:26:02		0.112	9000	OTO .. @ bid
 10:24:52		0.113	5000	OTO .. @ UC ask
 10:23:10		0.112	9000	OTO .. @ jumped bid .. note 9k = 1920/7080
 10:18:42		0.113	1920	OTO .. hidden .. 9k = 1920/7080 .. (B/11 .. A/114)
 10:09:37		0.113	7080	OTO .. @ ask
 10:09:18		0.113	5000	OTO .. @ relo/d ask
 10:06:22		0.11	5000	OTO .. @ ask
 09:56:43		0.11	900	OTO .. @ UC ask
 09:54:51		0.113	2920	OTO .. @ ask
 09:54:51		0.1115	2920	OTO .. hidden .. mirrored (B/106 .. A/113)
 09:52:04		0.11	5000	OTO .. @ jumped bid .. 5k = 2500/2500
 09:43:04		0.108	2500	OTO .. @ relo/d bid .. 5k = 2500/2500
 09:43:04		0.11	2500	OTO .. hidden .. mirrored (B/108 .. A/1103)
 09:32:58		0.11	5000	OTO .. @ bid .. 9:30:02
 09:30:22		0.11	2250	OTO .. @ jumped bid
 09:30:02		0.1075	5000	OTO .. @ jumped bid
 09:30:00		0.105	1500 .. @ bid .. relo/s bid
Detailed Quote:IPIX
INNOVATION PHARMACEUTICALS INC
0.11Up 0.0012 (1.10 %)AS OF 3:53:35PM ET 09/27/2019
 Last Trade	0.11
 Trade Time	3:53:35pm ET

 Change	0.0012
 % Change	1.10%

 Bid	0.108
 Bid Size	11000

 Ask	0.11
 Ask Size	35000

 Open	        0.105
 Day High	0.113 ..  .008c *liquidity* .. snicker
 Day Low	0.105
 Previous Close
 09/26/2019	0.1088
 52-Week High
 05/08/2019	0.4351
 52-Week Low
 12/31/2018	0.07

 Price Performance (Last 52 Weeks)
 09/26/2019	-60.90%

 Volume	660,343
 Volume (10 day Average)	357,943
 Volume (90 day Average)	369,593

 Market Capitalization	$22.47M
 Shares Outstanding	206,529,000
B/A .. volume 660343
 NITE	0.108	11,000	15:53
 ETRF	0.107	15,000	14:48
 CSTI	0.106	5,800	15:03
 CDEL	0.105	10,000	14:47
 GTSM	0.1045	10,000	15:54
 VNDM	0.10	5,000	09/26
 CFGN	0.065	10,000	09/26
 STXG	0.06	10,000	02/19
 VERT	0.05	10,000	05/21
 PUMA	0.05	10,000	08:10
 MAXM	0.0001	10,000	08:41
 OTCX	U	0	07:45

 NITE	0.11	35,000	15:53
 CDEL	0.112	7,500	14:47
 ETRF	0.113	17,152	11:01
 CFGN	0.114	5,000	09/26
 GTSM	0.14	5,000	09/26
 CSTI	0.14	5,000	15:02
 MAXM	0.362	2,500	14:57
 PUMA	0.40	2,500	08:10
 VERT	0.45	2,500	05/17
 VNDM	0.45	2,500	09/26
 OTCX	1.00	100	09:30
 STXG	2.00	100	02/19
will reiterate .. the last *reality* an UPSIDE DOWN Non Retail *entity or two or three*
want .. is this data *digested* .. in other words .. educated retail investors aren't required .. it's all about NR
being able to shake out .. on their terms and timing .. (in other words .. controlling outcomes)
Daily Reg Sho %s for IPIX MAY 2019
      May 31 NA NA NA 441,354 291,500 66.05% **** pattern change out on par with March 2019
      May 30 NA NA NA 572,479 228,123 39.85%
      May 29 NA NA NA 251,394 91,766 36.50%
      May 28 NA NA NA 451,622 136,557 30.24%
      May 24 NA NA NA 463,032 135,101 29.18% .. below 30%
      May 23 NA NA NA 670,784 273,558 40.78%
      May 22 NA NA NA 806,712 458,959 56.89%
      May 21 NA NA NA 383,832 221,372 57.67%
      May 20 NA NA NA 611,596 171,455 28.03% .. below 30%
      May 17 NA NA NA 2,644,134 974,430 36.85%
      May 16 NA NA NA 4,413,783 2,423,096 54.90% .. record volume (last seen in Aug 2015 & Dec 2014)
      May 15 NA NA NA 237,776 131,535 55.32%
      May 14 NA NA NA 880,776 285,052 32.36%
      May 13 NA NA NA 668,718 140,210 20.97% .. below 30%
      May 10 NA NA NA 2,377,716 709,931 29.86% .. below 30%
      May 09 NA NA NA 863,112 349,682 40.51%
      May 08 NA NA NA 2,306,040 639,986 27.75% .. below 30%
      May 07 NA NA NA 2,513,988 1,381,260 54.94%
      May 06 NA NA NA 760,633 566,203 74.44% .. NRs' *set up* to negate 5.16.16 8K underway
      May 03 NA NA NA 403,294 131,058 32.50% ** NRs' test ends @ 11:04AM
      May 02 NA NA NA 100,904 30,600 30.33% *** pattern change out .. NRs' take up/set up
      May 01 NA NA NA 396,482 268,325 67.68%
IPIX Historical September 10, 2018 - December 31, 2018
         12/31/2018	0.08	0.10	0.07	0.0954	631,343
         12/28/2018	0.083	0.109	0.083	0.1036	531,169
         12/27/2018	0.082	0.09	0.081	0.0876	468,153
         12/26/2018	0.08	0.095	0.08	0.09	346,379
         12/24/2018	0.095	0.095	0.08	0.08	372,923
         12/21/2018	0.099	0.105	0.075	0.095	844,903
         12/20/2018	0.11	0.11	0.0961	0.097	806,466
         12/19/2018	0.12	0.12	0.103	0.11	1,060,552
         12/18/2018	0.12	0.14	0.1101	0.1153	830,184
         12/17/2018	0.17	0.17	0.125	0.1293	768,696
         12/14/2018	0.123	0.16	0.115	0.145	414,408
         12/13/2018	0.155	0.155	0.116	0.1202	459,830
         12/12/2018	0.125	0.13	0.1152	0.127	523,824
         12/11/2018	0.14	0.16	0.125	0.1399	849,983
         12/10/2018	0.1299	0.16	0.1299	0.16	226,349
         12/07/2018	0.123	0.135	0.11	0.133	295,802
         12/06/2018	0.1245	0.1412	0.122	0.13	321,739
         12/04/2018	0.12	0.1369	0.12	0.1231	420,537
         12/03/2018	0.13	0.14	0.121	0.1343	345,949
         11/30/2018	0.1375	0.1375	0.128	0.135	497,326
         11/29/2018	0.1301	0.15	0.125	0.1327	1,379,661
         11/28/2018	0.1325	0.15	0.1288	0.133	875,275
         11/27/2018	0.125	0.1325	0.1101	0.132	475,115
         11/26/2018	0.17	0.17	0.12	0.126	485,796
         11/23/2018	0.1135	0.149	0.1135	0.14	884,102
         11/21/2018	0.108	0.115	0.103	0.11	462,656
         11/20/2018	0.108	0.115	0.1025	0.11	392,564
         11/19/2018	0.122	0.132	0.105	0.11	1,058,420
         11/16/2018	0.1369	0.1369	0.113	0.122	493,784
         11/15/2018	0.125	0.137	0.115	0.137	687,206
         11/14/2018	0.14	0.14	0.125	0.128	286,871
         11/13/2018	0.17	0.17	0.1335	0.14	274,668
         11/12/2018	0.155	0.155	0.135	0.14	690,455
         11/09/2018	0.16	0.175	0.145	0.152	486,370
         11/08/2018	0.14	0.175	0.137	0.1645	1,470,273
         11/07/2018	0.1661	0.172	0.14	0.15	811,782
         11/06/2018	0.18	0.185	0.159	0.1679	463,864
         11/05/2018	0.19	0.21	0.17	0.185	1,033,642
         11/02/2018	0.13	0.189	0.128	0.187	1,372,537
         11/01/2018	0.135	0.14	0.125	0.13	634,420
         10/31/2018	0.135	0.135	0.127	0.133	386,639
         10/30/2018	0.13	0.14	0.1254	0.132	337,278
         10/29/2018	0.134	0.144	0.13	0.135	1,114,409
         10/26/2018	0.138	0.14	0.123	0.136	876,765
         10/25/2018	0.1415	0.15	0.131	0.1374	619,964
         10/24/2018	0.138	0.148	0.128	0.148	847,006
         10/23/2018	0.138	0.14	0.122	0.137	774,467
         10/22/2018	0.18	0.18	0.125	0.132	951,411
         10/19/2018	0.1635	0.164	0.12	0.1462	1,869,230
         10/18/2018	0.1779	0.1779	0.1534	0.164	788,072
         10/17/2018	0.18	0.18	0.165	0.1779	446,377
         10/16/2018	0.19	0.2	0.177	0.18	875,248
         10/15/2018	0.20	0.24	0.18	0.1856	660,059
         10/12/2018	0.19	0.205	0.177	0.2	713,829
         10/11/2018	0.16	0.1896	0.159	0.1896	1,575,415
         10/10/2018	0.1991	0.2	0.16	0.1626	1,547,811
         10/09/2018	0.238	0.27	0.175	0.1841	2,131,163
         10/08/2018	0.24	0.2499	0.22	0.238	205,005
         10/05/2018	0.253	0.305	0.233	0.24	287,390
         10/04/2018	0.29	0.29	0.24	0.253	200,849
         10/03/2018	0.25	0.295	0.24	0.28	285,431
         10/02/2018	0.1975	0.256	0.19	0.25	285,150
         10/01/2018	0.21	0.21	0.18	0.1957	715,877
         09/28/2018	0.264	0.264	0.1895	0.202	1,420,473
         09/27/2018	0.27	0.273	0.242	0.2649	737,406
         09/26/2018	0.308	0.308	0.26	0.2782	361,590
         09/25/2018	0.2965	0.3136	0.27	0.2993	302,231
         09/24/2018	0.299	0.31	0.28	0.2955	236,198
         09/21/2018	0.299	0.299	0.272	0.299	250,475
         09/20/2018	0.2486	0.33	0.2358	0.299	924,370
         09/19/2018	0.233	0.25	0.21	0.2486	1,015,394
         09/18/2018	0.263	0.269	0.208	0.233	886,593
         09/17/2018	0.285	0.293	0.251	0.27	533,946
         09/14/2018	0.29	0.295	0.262	0.29	753,114
         09/13/2018	0.339	0.346	0.2271	0.29	1,109,738
         09/12/2018	0.40	0.4	0.3	0.33	1,016,307 .. NRs' bogus volume injection underway
         09/11/2018	0.425	0.47	0.425	0.452	86,434 .. 10K Filed AH's
         09/10/2018	0.38	0.5303	0.38	0.435	139,753
4kids
IPIX .. 9.26.19 trades .. curious to see if this *pattern* by NR continues on tomorrow and into next week .. First time I've had a chance to observe IPIX trades this week ..
DRS % .. 214086/345821 .. 61.90% .. (46.78% Wednesday)
Hidden trades .. 113050/345821 .. 32.69% .. (10% Wednesday) .. since 4.26.19
interesting change out
Liquidity .. .012c .. (HOD .114c/LOD .102c)
NR = Just A Few Probs
10 day vol algo *maintained* (close enough for govt work) .. 90 day vol algo NOT maintained
NRs' CONstant wash trades/resets remains blatant
https://investorshub.advfn.com/boards/read_msg.aspx?message_id=151421219
and under the heading that they all collude .. email sent to two other IPI investors on 9.26.19
(2 of 5)
I know they all collude .. but today I saw something unique out of FIDO.
As you may know FIDO has 2 formats .. AT PRO (which allows for me
to reconstruct trades for the prior 30 days) and thru FIDO's daily quote
system (the historical I show with YOY %s and volume avgs in my daily
tapes of trades' posts).
So here is what FIDO showed me today .. a sequence of hidden 5 digit
trades via their daily quote system
 0.11195Up 0.00195 (1.77 %)AS OF 9:42:22AM ET 09/26/2019
 0.11195Up 0.00195 (1.77 %)AS OF 9:41:31AM ET 09/26/2019
Now what is interesting here .. is AT PRO shows these as 4 digit trades @ bid
... if I hadn't (by chance) grabbed the screenshot
I might have reconstructed tape not knowing they were hidden ..
I then went to check what the trades showed .. fortunately I would have picked it up from what is shown (5 digits are hidden trades) ...
 09:43:09 0.11195 5000 OTO
 09:42:22 0.11195 5000 OTO
 09:41:31 0.11195 5000 OTO
 ========
 09:40:28 0.11195 5000 OTO
 ========
 ========
 09:34:46 0.11195 4000 OTO
==========================
fast forward to today .. 9.29.19
here is what those same 5 trades show now .. i have to wonder just how many times
this *happens* by NR and isn't caught
 09:43:09		0.112	5000	OTO
 09:42:22		0.112	5000	OTO
 09:41:31		0.112	5000	OTO
 =========
 09:40:28		0.112	5000	OTO
 =========
 =========
 09:34:46		0.112	4000	OTO
============================
IPIX .. 9.26.19 .. trades .. and i use that term rather loosely
 15:49:01		0.1088	2000	OTO .. hidden (B/106 .. A/11)
 15:37:39		0.1061	625	OTO .. @ jumped bid
 15:31:51		0.1088	9800	OTO .. hidden (B/1061 .. A/11)
 15:31:51		0.11	200	OTO .. @ ask
 13:47:56		0.105	1000	OTO .. @ bid
 13:18:10		0.11	1045	OTO .. @ ask
 12:48:30		0.1092	10000	OTO .. hidden .. mirrored (B/105 .. A/111)
 12:38:20		0.105	8636	OTO .. @ bid
 12:19:57		0.105	200	OTO .. @ bid
 11:57:26		0.11	10000	OTO .. @ bid .. relo/s bid
 11:57:26		0.1115	10000	OTO .. hidden .. mirrored .. (B/11 .. A/113) .. 20k = 10k/5k x2
 11:54:28		0.11	5000	OTO .. @ ask .. 10k = 5k x2
 11:54:28		0.11	5000	OTO .. @ relo/d ask
 11:53:03		0.102	115	OTO .. @ relo/d bid .. LOD
 11:51:35		0.1076	10000	OTO .. hidden .. mirrored .. (B/102 .. A/11) .. 20k = 10k/5350/4650
 11:47:11		0.1076	5350	OTO .. hidden (B/102 .. A/11) .. 10k = 5350/4650
 11:47:11		0.1075	4650	OTO .. hidden (B/102 .. A/11)
 11:00:29		0.105	500	OTO .. @ UC ask
 10:56:20		0.105	2800	OTO .. @ UC ask
 10:55:41		0.105	950	OTO .. @ UC ask
 10:55:38		0.105	1000	OTO .. @ bid
 10:55:36		0.105	5000	OTO .. @ bid
 10:55:23		0.105	1000	OTO .. @ bid
 10:55:23		0.105	4100	OTO .. @ bid .. 10k = 4100/5900
 10:39:29		0.107	5900	OTO .. @ bid
 10:39:28		0.107	9100	OTO .. @ bid
 10:28:33		0.11	15000	OTO .. hidden (B/107 .. A/113) .. 20k = 15k/4k/1k
 10:20:34		0.114	4000	OTO .. @ ask .. 5k = 4k/1k .. HOD
 10:20:20		0.114	1000	OTO .. @ relo/d ask .. HOD
 10:18:17		0.109	2250	OTO .. hidden (B/107 .. A/114)
 10:18:16		0.11	17000	OTO .. @ ask .. 9:30:02
 10:17:56		0.1088	1000	OTO .. hidden .. mirrored (B/107 .. A/11)
 10:11:19		0.107	5000	OTO .. @ bid
 10:11:03		0.11	3000	OTO .. @ relo/d ask
 10:10:53		0.11	10000	OTO .. @ jumped bid .. 10:02:32 .. 20k = 10k/10k
 10:03:12		0.107	400	OTO .. @ bid
 10:02:32		0.112	10000	OTO .. hidden .. mirrored (B/107 .. A/114)
 09:53:22		0.1109	28200	OTO .. @ UC ask
 09:46:13		0.11	60000	OTO .. @ bid .. 2 thoughts .. 75k combo/s or 25k/30k combos this week)
 09:43:38		0.1119	5000	OTO .. hidden .. mirrored (B/11 .. A/112)
 09:43:09		0.11195	5000	OTO .. hidden .. mirrored
 09:42:22		0.11195	5000	OTO .. hidden  .. mirrored
 09:41:31		0.11195	5000	OTO .. hidden .. mirrored
 09:40:59		0.1119	5000	OTO .. @ bid
 09:40:28		0.11195	5000	OTO .. hidden .. mirrored
 09:37:09		0.1119	1000	OTO .. @ bid
 09:34:46		0.1119	1000	OTO .. @ bid
 09:34:46		0.11195	4000	OTO .. hidden .. mirrored
 09:32:52		0.112	4000	OTO .. @ ask
 09:32:24		0.112	9000	OTO .. @ ask .. note 9k = 1k x4/5k
 09:32:21		0.1112	1000	OTO .. hidden (B/11 .. A/112)
 09:31:51		0.1112	1000	OTO .. hidden (B/11 .. A/112)
 09:31:21		0.1112	1000	OTO .. hidden (B/11 .. A/112)
 09:30:34		0.1112	1000	OTO .. hidden (B/11 .. A/112)
 09:30:09		0.11	5000	OTO .. @ bid
 09:30:02		0.11	17000	OTO .. @ bid
Detailed Quote:IPIX .. hidden
INNOVATION PHARMACEUTICALS INC
0.1088Down -0.0012 (-1.09 %)AS OF 3:49:01PM ET 09/26/2019
 Last Trade	0.1088
 Trade Time	3:49:01pm ET

 Change	-0.0012
 % Change	-1.09%

 Bid	0.106
 Bid Size	60560

 Ask	0.11
 Ask Size	50000

 Open	        0.11
 Day High	0.114 ..  .012c *liquidity*
 Day Low	0.102
 Previous Close
 09/25/2019	0.11
 52-Week High
 05/08/2019	0.4351
 52-Week Low
 12/31/2018	0.07

 Price Performance (Last 52 Weeks)
 09/25/2019	-63.25%

 Volume	345,821
 Volume (10 day Average)	346,727
 Volume (90 day Average)	372,546

 Market Capitalization	$22.72M
 Shares Outstanding	206,529,000
B/A .. volume 345821
 CDEL	0.106	60,560	15:57
 ETRF	0.106	18,773	15:57
 GTSM	0.105	12,500	14:23
 CSTI	0.1012	10,000	11:22
 VNDM	0.10	5,000	09/25
 CFGN	0.065	10,000	10:56
 STXG	0.06	10,000	02/19
 VERT	0.05	10,000	05/21
 PUMA	0.05	10,000	08:10
 NITE	0.0114	14,824	09:46
 MAXM	0.0001	10,000	09/25
 OTCX	U	0	07:45

 CDEL	0.11	30,000	15:57
 NITE	0.11	20,000	15:51
 ETRF	0.113	40,000	12:47
 CFGN	0.114	5,000	09:53
 GTSM	0.14	5,000	07:02
 CSTI	0.15	5,000	10:28
 MAXM	0.363	2,500	10:36
 PUMA	0.40	2,500	08:10
 VERT	0.45	2,500	05/17
 VNDM	0.45	2,500	09/25
 OTCX	1.00	100	09:30
 STXG	2.00	100	02/19
will reiterate .. the last *reality* an UPSIDE DOWN Non Retail *entity or two or three*
want .. is this data *digested* .. in other words .. educated retail investors aren't required .. it's all about NR
being able to shake out .. on their terms and timing .. (in other words .. controlling outcomes)
Daily Reg Sho %s for IPIX MAY 2019
      May 31 NA NA NA 441,354 291,500 66.05% **** pattern change out on par with March 2019
      May 30 NA NA NA 572,479 228,123 39.85%
      May 29 NA NA NA 251,394 91,766 36.50%
      May 28 NA NA NA 451,622 136,557 30.24%
      May 24 NA NA NA 463,032 135,101 29.18% .. below 30%
      May 23 NA NA NA 670,784 273,558 40.78%
      May 22 NA NA NA 806,712 458,959 56.89%
      May 21 NA NA NA 383,832 221,372 57.67%
      May 20 NA NA NA 611,596 171,455 28.03% .. below 30%
      May 17 NA NA NA 2,644,134 974,430 36.85%
      May 16 NA NA NA 4,413,783 2,423,096 54.90% .. record volume (last seen in Aug 2015 & Dec 2014)
      May 15 NA NA NA 237,776 131,535 55.32%
      May 14 NA NA NA 880,776 285,052 32.36%
      May 13 NA NA NA 668,718 140,210 20.97% .. below 30%
      May 10 NA NA NA 2,377,716 709,931 29.86% .. below 30%
      May 09 NA NA NA 863,112 349,682 40.51%
      May 08 NA NA NA 2,306,040 639,986 27.75% .. below 30%
      May 07 NA NA NA 2,513,988 1,381,260 54.94%
      May 06 NA NA NA 760,633 566,203 74.44% .. NRs' *set up* to negate 5.16.16 8K underway
      May 03 NA NA NA 403,294 131,058 32.50% ** NRs' test ends @ 11:04AM
      May 02 NA NA NA 100,904 30,600 30.33% *** pattern change out .. NRs' take up/set up
      May 01 NA NA NA 396,482 268,325 67.68%
IPIX Historical September 10, 2018 - December 31, 2018
         12/31/2018	0.08	0.10	0.07	0.0954	631,343
         12/28/2018	0.083	0.109	0.083	0.1036	531,169
         12/27/2018	0.082	0.09	0.081	0.0876	468,153
         12/26/2018	0.08	0.095	0.08	0.09	346,379
         12/24/2018	0.095	0.095	0.08	0.08	372,923
         12/21/2018	0.099	0.105	0.075	0.095	844,903
         12/20/2018	0.11	0.11	0.0961	0.097	806,466
         12/19/2018	0.12	0.12	0.103	0.11	1,060,552
         12/18/2018	0.12	0.14	0.1101	0.1153	830,184
         12/17/2018	0.17	0.17	0.125	0.1293	768,696
         12/14/2018	0.123	0.16	0.115	0.145	414,408
         12/13/2018	0.155	0.155	0.116	0.1202	459,830
         12/12/2018	0.125	0.13	0.1152	0.127	523,824
         12/11/2018	0.14	0.16	0.125	0.1399	849,983
         12/10/2018	0.1299	0.16	0.1299	0.16	226,349
         12/07/2018	0.123	0.135	0.11	0.133	295,802
         12/06/2018	0.1245	0.1412	0.122	0.13	321,739
         12/04/2018	0.12	0.1369	0.12	0.1231	420,537
         12/03/2018	0.13	0.14	0.121	0.1343	345,949
         11/30/2018	0.1375	0.1375	0.128	0.135	497,326
         11/29/2018	0.1301	0.15	0.125	0.1327	1,379,661
         11/28/2018	0.1325	0.15	0.1288	0.133	875,275
         11/27/2018	0.125	0.1325	0.1101	0.132	475,115
         11/26/2018	0.17	0.17	0.12	0.126	485,796
         11/23/2018	0.1135	0.149	0.1135	0.14	884,102
         11/21/2018	0.108	0.115	0.103	0.11	462,656
         11/20/2018	0.108	0.115	0.1025	0.11	392,564
         11/19/2018	0.122	0.132	0.105	0.11	1,058,420
         11/16/2018	0.1369	0.1369	0.113	0.122	493,784
         11/15/2018	0.125	0.137	0.115	0.137	687,206
         11/14/2018	0.14	0.14	0.125	0.128	286,871
         11/13/2018	0.17	0.17	0.1335	0.14	274,668
         11/12/2018	0.155	0.155	0.135	0.14	690,455
         11/09/2018	0.16	0.175	0.145	0.152	486,370
         11/08/2018	0.14	0.175	0.137	0.1645	1,470,273
         11/07/2018	0.1661	0.172	0.14	0.15	811,782
         11/06/2018	0.18	0.185	0.159	0.1679	463,864
         11/05/2018	0.19	0.21	0.17	0.185	1,033,642
         11/02/2018	0.13	0.189	0.128	0.187	1,372,537
         11/01/2018	0.135	0.14	0.125	0.13	634,420
         10/31/2018	0.135	0.135	0.127	0.133	386,639
         10/30/2018	0.13	0.14	0.1254	0.132	337,278
         10/29/2018	0.134	0.144	0.13	0.135	1,114,409
         10/26/2018	0.138	0.14	0.123	0.136	876,765
         10/25/2018	0.1415	0.15	0.131	0.1374	619,964
         10/24/2018	0.138	0.148	0.128	0.148	847,006
         10/23/2018	0.138	0.14	0.122	0.137	774,467
         10/22/2018	0.18	0.18	0.125	0.132	951,411
         10/19/2018	0.1635	0.164	0.12	0.1462	1,869,230
         10/18/2018	0.1779	0.1779	0.1534	0.164	788,072
         10/17/2018	0.18	0.18	0.165	0.1779	446,377
         10/16/2018	0.19	0.2	0.177	0.18	875,248
         10/15/2018	0.20	0.24	0.18	0.1856	660,059
         10/12/2018	0.19	0.205	0.177	0.2	713,829
         10/11/2018	0.16	0.1896	0.159	0.1896	1,575,415
         10/10/2018	0.1991	0.2	0.16	0.1626	1,547,811
         10/09/2018	0.238	0.27	0.175	0.1841	2,131,163
         10/08/2018	0.24	0.2499	0.22	0.238	205,005
         10/05/2018	0.253	0.305	0.233	0.24	287,390
         10/04/2018	0.29	0.29	0.24	0.253	200,849
         10/03/2018	0.25	0.295	0.24	0.28	285,431
         10/02/2018	0.1975	0.256	0.19	0.25	285,150
         10/01/2018	0.21	0.21	0.18	0.1957	715,877
         09/28/2018	0.264	0.264	0.1895	0.202	1,420,473
         09/27/2018	0.27	0.273	0.242	0.2649	737,406
         09/26/2018	0.308	0.308	0.26	0.2782	361,590
         09/25/2018	0.2965	0.3136	0.27	0.2993	302,231
         09/24/2018	0.299	0.31	0.28	0.2955	236,198
         09/21/2018	0.299	0.299	0.272	0.299	250,475
         09/20/2018	0.2486	0.33	0.2358	0.299	924,370
         09/19/2018	0.233	0.25	0.21	0.2486	1,015,394
         09/18/2018	0.263	0.269	0.208	0.233	886,593
         09/17/2018	0.285	0.293	0.251	0.27	533,946
         09/14/2018	0.29	0.295	0.262	0.29	753,114
         09/13/2018	0.339	0.346	0.2271	0.29	1,109,738
         09/12/2018	0.40	0.4	0.3	0.33	1,016,307 .. NRs' bogus volume injection underway
         09/11/2018	0.425	0.47	0.425	0.452	86,434 .. 10K Filed AH's
         09/10/2018	0.38	0.5303	0.38	0.435	139,753
4kids
IPIX .. 9.25.19 trades .. curious to see if this *pattern* by NR continues on tomorrow and into next week ..
DRS % .. 164555/351695 .. 46.78% .. (39.67% Tuesday)
Hidden trades .. 35200/351695 .. 10% .. (16.34% Tuesday) .. since 4.26.19
interesting change out
Liquidity .. .0129c .. (HOD .1219c/LOD .109c)
NR = Just A Few Probs
10 day vol algo *maintained* .. 90 day vol algo NOT maintained
NRs' CONstant wash trades/resets remains blatant
https://investorshub.advfn.com/boards/read_msg.aspx?message_id=151420778
 15:37:24		0.11	25000	OTO .. @ UC ask .. 75k = 25k/35k/5k x3
 15:30:55		0.109	500	OTO .. @ bid .. LOD
 15:23:55		0.11	2636	OTO .. @ UC ask .. note PPS is prior bid PPS
 15:12:09		0.11	1200	OTO .. hidden (B/102 .. A/114)
 15:12:08		0.11	5000	OTO .. @ bid
 15:11:59		0.11	16000	OTO .. @ bid
 15:11:46		0.11	5000	OTO .. @ bid
 15:11:32		0.11	5000	OTO .. @ bid
 15:11:29		0.11	5000	OTO .. @ bid
 15:11:26		0.11	35000	OTO .. @ relo/d bid
 15:11:15		0.112	5000	OTO .. @ bid .. relo/s bid
 15:05:58		0.1135	5900	OTO .. hidden (B/112 .. A/114)
 15:05:45		0.114	4123	OTO .. @ UC ask
 14:58:27		0.114	1000	OTO .. hidden (B/1135 .. A/115)
 14:52:57		0.1135	7500	OTO .. hidden .. mirrored (B/112 .. A/115)
 14:52:25		0.1135	7500	OTO .. @ bid
 14:52:22		0.1135	5000	OTO .. @ bid
 14:43:44		0.115	8695	OTO .. @ ask
 14:38:56		0.1135	75000	OTO .. @ bid .. 75k = 25k x3
 14:33:06		0.115	10000	OTO .. @ ask .. 25k = 10k/10k/5k
 14:32:25		0.114	2000	OTO .. hidden .. mirrored (B/1135 .. A/115)
 14:14:03		0.112	4400	OTO .. @ relo/d bid
 13:59:08		0.115	500	OTO .. @ UC ask .. note PPS is prior bid PPS
 13:52:14		0.1129	2000	OTO .. hidden (B/112 .. A/115)
 13:37:00		0.115	5000	OTO .. @ jumped bid
 12:52:03		0.116	10000	OTO .. @ ask .. 25k = 10k/15k
 11:55:24		0.116	15000	OTO .. @ UC ask
 11:51:09		0.114	7155	OTO .. @ bid
 11:51:07		0.114	7000	OTO .. @ bid
 11:18:32		0.114	10352	OTO .. @ relo/d bid
 11:18:24		0.116	10000	OTO .. @ relo/d bid .. relo/s bid  .
 11:18:05		0.117	4600	OTO .. hidden (B/116 .. A/1192)
 10:56:54		0.117	1334	OTO .. @ bid
 10:56:53		0.117	10000	OTO .. @ relo/d bid .. 25k = 2k/8k/5k/10k
 10:51:59		0.118	1000	OTO .. hidden (B/117 .. A/1195) .. possible % based signal
 10:50:41		0.1194	5000	OTO .. @ UC ask ..
 10:48:16		0.118	5000	OTO .. @ bid  .. relo/s bid
 10:48:12		0.118	9900	OTO .. @ bid
 10:44:31		0.118	400	OTO .. @ bid
 10:07:18		0.1182	8000	OTO .. hidden  .. 10k = 8k/2k (B/118 .. A/1214)
 10:07:18		0.1184	2000	OTO .. hidden (B/118 .. A/1214)
 09:43:27		0.1219	1000	OTO .. @ ask .. HOD .. turn
Detailed Quote:IPIX
INNOVATION PHARMACEUTICALS INC
0.11Down -0.0088 (-7.41 %)AS OF 3:37:24PM ET 09/25/2019
 Last Trade	0.11
 Trade Time	3:37:24pm ET

 Change	-0.0088
 % Change	-7.41%

 Bid	0.109
 Bid Size	14600

 Ask	0.112
 Ask Size	5000

 Open	        0.1219
 Day High	0.1219 ..  .0129c *liquidity*
 Day Low	0.109
 Previous Close
 09/24/2019	0.1188
 52-Week High
 05/08/2019	0.4351
 52-Week Low
 12/31/2018	0.07

 Price Performance (Last 52 Weeks)
 09/24/2019	-59.80%

 Volume	351,695
 Volume (10 day Average)	331,627
 Volume (90 day Average)	398,101 .. note 90 day slips below 400k~

 Market Capitalization	$24.54M
 Shares Outstanding	206,529,000
B/A .. volume 351695
 NITE	0.109	9,500	15:30
 ETRF	0.109	5,100	15:48
 GTSM	0.105	20,000	15:38
 CFGN	0.104	5,000	15:37
 CDEL	0.10	58,600	15:37
 CSTI	0.10	10,000	15:12
 VNDM	0.10	5,000	15:11
 STXG	0.06	10,000	02/19
 VERT	0.05	10,000	05/21
 PUMA	0.05	10,000	08:10
 MAXM	0.0001	10,000	07:35
 OTCX	U	0	07:45

 CFGN	0.112	5,000	15:37
 ETRF	0.113	28,200	15:23
 CDEL	0.113	5,000	15:37
 NITE	0.115	5,000	14:43
 CSTI	0.1215	5,000	15:12
 GTSM	0.14	9,900	10:48
 PUMA	0.40	2,500	08:10
 VERT	0.45	2,500	05/17
 VNDM	0.45	2,500	09/24
 OTCX	1.00	100	09:30
 STXG	2.00	100	02/19
 MAXM	8.00	100	07:35
will reiterate .. the last *reality* an UPSIDE DOWN Non Retail *entity or two or three*
want .. is this data *digested* .. in other words .. educated retail investors aren't required .. it's all about NR
being able to shake out .. on their terms and timing .. (in other words .. controlling outcomes)
Daily Reg Sho %s for IPIX MAY 2019
      May 31 NA NA NA 441,354 291,500 66.05% **** pattern change out on par with March 2019
      May 30 NA NA NA 572,479 228,123 39.85%
      May 29 NA NA NA 251,394 91,766 36.50%
      May 28 NA NA NA 451,622 136,557 30.24%
      May 24 NA NA NA 463,032 135,101 29.18% .. below 30%
      May 23 NA NA NA 670,784 273,558 40.78%
      May 22 NA NA NA 806,712 458,959 56.89%
      May 21 NA NA NA 383,832 221,372 57.67%
      May 20 NA NA NA 611,596 171,455 28.03% .. below 30%
      May 17 NA NA NA 2,644,134 974,430 36.85%
      May 16 NA NA NA 4,413,783 2,423,096 54.90% .. record volume (last seen in Aug 2015 & Dec 2014)
      May 15 NA NA NA 237,776 131,535 55.32%
      May 14 NA NA NA 880,776 285,052 32.36%
      May 13 NA NA NA 668,718 140,210 20.97% .. below 30%
      May 10 NA NA NA 2,377,716 709,931 29.86% .. below 30%
      May 09 NA NA NA 863,112 349,682 40.51%
      May 08 NA NA NA 2,306,040 639,986 27.75% .. below 30%
      May 07 NA NA NA 2,513,988 1,381,260 54.94%
      May 06 NA NA NA 760,633 566,203 74.44% .. NRs' *set up* to negate 5.16.16 8K underway
      May 03 NA NA NA 403,294 131,058 32.50% ** NRs' test ends @ 11:04AM
      May 02 NA NA NA 100,904 30,600 30.33% *** pattern change out .. NRs' take up/set up
      May 01 NA NA NA 396,482 268,325 67.68%
IPIX Historical September 10, 2018 - December 31, 2018
         12/31/2018	0.08	0.10	0.07	0.0954	631,343
         12/28/2018	0.083	0.109	0.083	0.1036	531,169
         12/27/2018	0.082	0.09	0.081	0.0876	468,153
         12/26/2018	0.08	0.095	0.08	0.09	346,379
         12/24/2018	0.095	0.095	0.08	0.08	372,923
         12/21/2018	0.099	0.105	0.075	0.095	844,903
         12/20/2018	0.11	0.11	0.0961	0.097	806,466
         12/19/2018	0.12	0.12	0.103	0.11	1,060,552
         12/18/2018	0.12	0.14	0.1101	0.1153	830,184
         12/17/2018	0.17	0.17	0.125	0.1293	768,696
         12/14/2018	0.123	0.16	0.115	0.145	414,408
         12/13/2018	0.155	0.155	0.116	0.1202	459,830
         12/12/2018	0.125	0.13	0.1152	0.127	523,824
         12/11/2018	0.14	0.16	0.125	0.1399	849,983
         12/10/2018	0.1299	0.16	0.1299	0.16	226,349
         12/07/2018	0.123	0.135	0.11	0.133	295,802
         12/06/2018	0.1245	0.1412	0.122	0.13	321,739
         12/04/2018	0.12	0.1369	0.12	0.1231	420,537
         12/03/2018	0.13	0.14	0.121	0.1343	345,949
         11/30/2018	0.1375	0.1375	0.128	0.135	497,326
         11/29/2018	0.1301	0.15	0.125	0.1327	1,379,661
         11/28/2018	0.1325	0.15	0.1288	0.133	875,275
         11/27/2018	0.125	0.1325	0.1101	0.132	475,115
         11/26/2018	0.17	0.17	0.12	0.126	485,796
         11/23/2018	0.1135	0.149	0.1135	0.14	884,102
         11/21/2018	0.108	0.115	0.103	0.11	462,656
         11/20/2018	0.108	0.115	0.1025	0.11	392,564
         11/19/2018	0.122	0.132	0.105	0.11	1,058,420
         11/16/2018	0.1369	0.1369	0.113	0.122	493,784
         11/15/2018	0.125	0.137	0.115	0.137	687,206
         11/14/2018	0.14	0.14	0.125	0.128	286,871
         11/13/2018	0.17	0.17	0.1335	0.14	274,668
         11/12/2018	0.155	0.155	0.135	0.14	690,455
         11/09/2018	0.16	0.175	0.145	0.152	486,370
         11/08/2018	0.14	0.175	0.137	0.1645	1,470,273
         11/07/2018	0.1661	0.172	0.14	0.15	811,782
         11/06/2018	0.18	0.185	0.159	0.1679	463,864
         11/05/2018	0.19	0.21	0.17	0.185	1,033,642
         11/02/2018	0.13	0.189	0.128	0.187	1,372,537
         11/01/2018	0.135	0.14	0.125	0.13	634,420
         10/31/2018	0.135	0.135	0.127	0.133	386,639
         10/30/2018	0.13	0.14	0.1254	0.132	337,278
         10/29/2018	0.134	0.144	0.13	0.135	1,114,409
         10/26/2018	0.138	0.14	0.123	0.136	876,765
         10/25/2018	0.1415	0.15	0.131	0.1374	619,964
         10/24/2018	0.138	0.148	0.128	0.148	847,006
         10/23/2018	0.138	0.14	0.122	0.137	774,467
         10/22/2018	0.18	0.18	0.125	0.132	951,411
         10/19/2018	0.1635	0.164	0.12	0.1462	1,869,230
         10/18/2018	0.1779	0.1779	0.1534	0.164	788,072
         10/17/2018	0.18	0.18	0.165	0.1779	446,377
         10/16/2018	0.19	0.2	0.177	0.18	875,248
         10/15/2018	0.20	0.24	0.18	0.1856	660,059
         10/12/2018	0.19	0.205	0.177	0.2	713,829
         10/11/2018	0.16	0.1896	0.159	0.1896	1,575,415
         10/10/2018	0.1991	0.2	0.16	0.1626	1,547,811
         10/09/2018	0.238	0.27	0.175	0.1841	2,131,163
         10/08/2018	0.24	0.2499	0.22	0.238	205,005
         10/05/2018	0.253	0.305	0.233	0.24	287,390
         10/04/2018	0.29	0.29	0.24	0.253	200,849
         10/03/2018	0.25	0.295	0.24	0.28	285,431
         10/02/2018	0.1975	0.256	0.19	0.25	285,150
         10/01/2018	0.21	0.21	0.18	0.1957	715,877
         09/28/2018	0.264	0.264	0.1895	0.202	1,420,473
         09/27/2018	0.27	0.273	0.242	0.2649	737,406
         09/26/2018	0.308	0.308	0.26	0.2782	361,590
         09/25/2018	0.2965	0.3136	0.27	0.2993	302,231
         09/24/2018	0.299	0.31	0.28	0.2955	236,198
         09/21/2018	0.299	0.299	0.272	0.299	250,475
         09/20/2018	0.2486	0.33	0.2358	0.299	924,370
         09/19/2018	0.233	0.25	0.21	0.2486	1,015,394
         09/18/2018	0.263	0.269	0.208	0.233	886,593
         09/17/2018	0.285	0.293	0.251	0.27	533,946
         09/14/2018	0.29	0.295	0.262	0.29	753,114
         09/13/2018	0.339	0.346	0.2271	0.29	1,109,738
         09/12/2018	0.40	0.4	0.3	0.33	1,016,307 .. NRs' bogus volume injection underway
         09/11/2018	0.425	0.47	0.425	0.452	86,434 .. 10K Filed AH's
         09/10/2018	0.38	0.5303	0.38	0.435	139,753
4kids
IPIX .. 9.24.19 trades .. curious to see if this *pattern* by NR continues on tomorrow and into next week .. T&S Codes:
DRS % .. 126319/318382 .. 39.67% .. (64.34% Monday)
Hidden trades .. 52052/318382 .. 16.34% .. (10.71% Monday) .. since 4.26.19
interesting change out
Liquidity .. .0112c .. (HOD .13c/LOD .1188c)
NR = Just A Few Probs
neither 10 day or 90 day vol algo *maintained*
NRs' CONstant wash trades/resets remains blatant
https://investorshub.advfn.com/boards/read_msg.aspx?message_id=151419141
 15:59:43		0.1188	10000	OTO .. @ relo/d bid .. 15k = 10k/5k .. 14:29:21 .. LOD
 15:58:03		0.119	5000	OTO .. @ ask
 15:57:20		0.119	2000	OTO .. @ UC ask .. 10k = 2k/8k .. 14:29:27
 15:55:42		0.119	8000	OTO .. @ relo/d bid .. relo/s bid
 15:52:07		0.1192	10000	OTO .. @ relo/d bid .. relo/s bid
 15:47:35		0.1198	2352	OTO .. hidden (B/1193 .. A/121)
 15:47:35		0.1193	6000	OTO .. @ relo/d bid
 14:57:28		0.12	10000	OTO .. @ bid .. 20k = 10k/10k .. relo/s bid
 14:54:10		0.1201	18900	OTO .. hidden (B/12 .. A/122)
 14:49:12		0.12	10000	OTO .. @ bid
 14:35:55		0.12	17121	OTO .. @ bid .. 20k =17121/2879
 14:34:27		0.12	2879	OTO .. @ bid
 14:34:18		0.12	12700	OTO .. @ bid
 14:29:27		0.12	10000	OTO .. @ bid
 14:29:21		0.12	15000	OTO .. @ jumped .. note prior PPS was @ ask
 14:16:43		0.12	5000	OTO .. @ ask .. note 10k = 5k x2
 14:15:43		0.12	5000	OTO .. @ ask
 14:12:17		0.1198	5000	OTO .. hidden .. mirrored (B/1192 .. A/12)
 14:01:47		0.119	10000	OTO .. @ relo/d bid
 13:58:30		0.12	5700	OTO .. @ UC ask .. note prior PPS was @ bid
 13:58:13		0.12	10000	OTO .. @ bid .. 20k = 10k/5k/5k .. or 20k = 5k x4 .. relo/s bid
 13:58:12		0.12	5000	OTO .. @ bid
 13:58:02		0.12	5000	OTO .. @ relo/d bid
 13:50:57		0.122	2395	OTO .. @ ask
 13:50:50		0.122	1648	OTO .. @ UC ask
 13:50:19		0.122	5000	OTO .. @ bid .. 10k = 5k x2 .. relo/s bid
 13:41:21		0.122	5000	OTO .. @ relo/d bid
 13:41:11		0.1222	5000	OTO .. @ bid .. 10k = 5k x2 .. relo/s bid
 13:40:54		0.1222	5000	OTO .. @ bid
 13:10:19		0.1222	1800	OTO .. @ bid .. 30k = 1800/28200
 13:10:18		0.1222	28200	OTO .. @ relo/d bid
 12:49:39		0.1248	4700	OTO .. @ bid .. 5k = 4700/300 .. relo/s bid
 12:49:30		0.125	300	OTO .. hidden (B/1248 .. A/13) .. looks to be a % based signal
 12:34:35		0.125	7000	OTO .. @ jumped bid
 12:00:03	i 	0.1248	50	OTO .. @ bid
 11:49:22		0.1248	4850	OTO .. @ bid .. 5k = 4850/150
 11:49:19		0.1248	150	OTO .. @ bid
 11:20:51		0.1248	4337	OTO .. @ bid
 11:12:34		0.1274	10000	OTO .. hidden .. mirrored (B/1248 .. A/13)
 10:56:21		0.1264	10000	OTO .. hidden .. mirrored (B/1248 .. A/13)
 10:01:28		0.1274	500	OTO .. hidden .. mirrored (B/1248 .. A/13)
 10:01:28		0.1248	500	OTO .. @ bid
 09:58:51		0.13	3500	OTO .. @ UC ask .. HOD .. turn
 09:51:52		0.1248	2800	OTO .. @ relo/d bid
 09:44:12		0.1274	5000	OTO .. hidden .. mirrored (B/1248 .. A/13)
 09:40:35		0.13	5000	OTO .. @ bid .. HOD
 09:31:11		0.13	15000	OTO .. @ bid .. HOD
trading codes .. yet another day this month for IPIX
a = acquisition
b = bunched trade - average price
c = cash trade
d = distribution
e = automatic execution
g = bunched sold trade - opening/reopening trade detail
h = intraday trade detail
i = basket index on close transaction
j = rule 127 trade
k = rule 155 trade
l = sold last
n = next day
o = opened
p = prior reference price
r = seller
s = split trade
t = form t trade - pre/post market trade
u = extended hours trade - reported late or out of sequence
w = average price trade
y = yellow flagged regular trade
z = sold - out of sequence
Detailed Quote:IPIX
INNOVATION PHARMACEUTICALS INC
0.1188Down -0.00886 (-6.94 %)AS OF 3:59:43PM ET 09/24/2019
Last Trade 0.1188
Trade Time 3:59:43pm ET
Change -0.00886
% Change -6.94%
Bid 0.118
Bid Size 12000
Ask 0.1219
Ask Size 5000
Open 0.13
Day High 0.13 .. .0112c *liquidity*
Day Low 0.1188
Previous Close
09/23/2019 0.12766
52-Week High
05/08/2019 0.4351
52-Week Low
12/31/2018 0.07
Price Performance (Last 52 Weeks)
09/23/2019 -57.30%
Volume 318,382
Volume (10 day Average) 328,110
Volume (90 day Average) 443,605
Market Capitalization $26.37M
Shares Outstanding 206,529,000
B/A .. volume 318382
GTSM 0.118 12,000 15:55
NITE 0.114 14,475 14:57
CSTI 0.114 5,000 13:58
CFGN 0.112 5,000 08/12
CDEL 0.111 5,000 15:52
VNDM 0.11 5,000 09/23
ETRF 0.10 110,000 15:59
STXG 0.06 10,000 02/19
VERT 0.05 10,000 05/21
PUMA 0.05 10,000 08:10
MAXM 0.0001 10,000 07:35
OTCX U 0 07:45
ETRF 0.1192 40,000 15:58
CDEL 0.121 15,000 15:52
NITE 0.1219 5,000 14:57
CSTI 0.125 30,000 14:53
GTSM 0.14 9,900 09:30
CFGN 0.199 5,000 07/29
PUMA 0.40 2,500 08:10
VERT 0.45 2,500 05/17
VNDM 0.45 2,500 09/23
OTCX 1.00 100 09:30
STXG 2.00 100 02/19
MAXM 8.00 100 07:35
will reiterate .. the last *reality* an UPSIDE DOWN Non Retail *entity or two or three*
want .. is this data *digested* .. in other words .. educated retail investors aren't required .. it's all about NR
being able to shake out .. on their terms and timing .. (in other words .. controlling outcomes)
Daily Reg Sho %s for IPIX MAY 2019
May 31 NA NA NA 441,354 291,500 66.05% **** pattern change out on par with March 2019
May 30 NA NA NA 572,479 228,123 39.85%
May 29 NA NA NA 251,394 91,766 36.50%
May 28 NA NA NA 451,622 136,557 30.24%
May 24 NA NA NA 463,032 135,101 29.18% .. below 30%
May 23 NA NA NA 670,784 273,558 40.78%
May 22 NA NA NA 806,712 458,959 56.89%
May 21 NA NA NA 383,832 221,372 57.67%
May 20 NA NA NA 611,596 171,455 28.03% .. below 30%
May 17 NA NA NA 2,644,134 974,430 36.85%
May 16 NA NA NA 4,413,783 2,423,096 54.90% .. record volume (last seen in Aug 2015 & Dec 2014)
May 15 NA NA NA 237,776 131,535 55.32%
May 14 NA NA NA 880,776 285,052 32.36%
May 13 NA NA NA 668,718 140,210 20.97% .. below 30%
May 10 NA NA NA 2,377,716 709,931 29.86% .. below 30%
May 09 NA NA NA 863,112 349,682 40.51%
May 08 NA NA NA 2,306,040 639,986 27.75% .. below 30%
May 07 NA NA NA 2,513,988 1,381,260 54.94%
May 06 NA NA NA 760,633 566,203 74.44% .. NRs' *set up* to negate 5.16.16 8K underway
May 03 NA NA NA 403,294 131,058 32.50% ** NRs' test ends @ 11:04AM
May 02 NA NA NA 100,904 30,600 30.33% *** pattern change out .. NRs' take up/set up
May 01 NA NA NA 396,482 268,325 67.68%
IPIX Historical September 10, 2018 - December 31, 2018
12/31/2018 0.08 0.10 0.07 0.0954 631,343
12/28/2018 0.083 0.109 0.083 0.1036 531,169
12/27/2018 0.082 0.09 0.081 0.0876 468,153
12/26/2018 0.08 0.095 0.08 0.09 346,379
12/24/2018 0.095 0.095 0.08 0.08 372,923
12/21/2018 0.099 0.105 0.075 0.095 844,903
12/20/2018 0.11 0.11 0.0961 0.097 806,466
12/19/2018 0.12 0.12 0.103 0.11 1,060,552
12/18/2018 0.12 0.14 0.1101 0.1153 830,184
12/17/2018 0.17 0.17 0.125 0.1293 768,696
12/14/2018 0.123 0.16 0.115 0.145 414,408
12/13/2018 0.155 0.155 0.116 0.1202 459,830
12/12/2018 0.125 0.13 0.1152 0.127 523,824
12/11/2018 0.14 0.16 0.125 0.1399 849,983
12/10/2018 0.1299 0.16 0.1299 0.16 226,349
12/07/2018 0.123 0.135 0.11 0.133 295,802
12/06/2018 0.1245 0.1412 0.122 0.13 321,739
12/04/2018 0.12 0.1369 0.12 0.1231 420,537
12/03/2018 0.13 0.14 0.121 0.1343 345,949
11/30/2018 0.1375 0.1375 0.128 0.135 497,326
11/29/2018 0.1301 0.15 0.125 0.1327 1,379,661
11/28/2018 0.1325 0.15 0.1288 0.133 875,275
11/27/2018 0.125 0.1325 0.1101 0.132 475,115
11/26/2018 0.17 0.17 0.12 0.126 485,796
11/23/2018 0.1135 0.149 0.1135 0.14 884,102
11/21/2018 0.108 0.115 0.103 0.11 462,656
11/20/2018 0.108 0.115 0.1025 0.11 392,564
11/19/2018 0.122 0.132 0.105 0.11 1,058,420
11/16/2018 0.1369 0.1369 0.113 0.122 493,784
11/15/2018 0.125 0.137 0.115 0.137 687,206
11/14/2018 0.14 0.14 0.125 0.128 286,871
11/13/2018 0.17 0.17 0.1335 0.14 274,668
11/12/2018 0.155 0.155 0.135 0.14 690,455
11/09/2018 0.16 0.175 0.145 0.152 486,370
11/08/2018 0.14 0.175 0.137 0.1645 1,470,273
11/07/2018 0.1661 0.172 0.14 0.15 811,782
11/06/2018 0.18 0.185 0.159 0.1679 463,864
11/05/2018 0.19 0.21 0.17 0.185 1,033,642
11/02/2018 0.13 0.189 0.128 0.187 1,372,537
11/01/2018 0.135 0.14 0.125 0.13 634,420
10/31/2018 0.135 0.135 0.127 0.133 386,639
10/30/2018 0.13 0.14 0.1254 0.132 337,278
10/29/2018 0.134 0.144 0.13 0.135 1,114,409
10/26/2018 0.138 0.14 0.123 0.136 876,765
10/25/2018 0.1415 0.15 0.131 0.1374 619,964
10/24/2018 0.138 0.148 0.128 0.148 847,006
10/23/2018 0.138 0.14 0.122 0.137 774,467
10/22/2018 0.18 0.18 0.125 0.132 951,411
10/19/2018 0.1635 0.164 0.12 0.1462 1,869,230
10/18/2018 0.1779 0.1779 0.1534 0.164 788,072
10/17/2018 0.18 0.18 0.165 0.1779 446,377
10/16/2018 0.19 0.2 0.177 0.18 875,248
10/15/2018 0.20 0.24 0.18 0.1856 660,059
10/12/2018 0.19 0.205 0.177 0.2 713,829
10/11/2018 0.16 0.1896 0.159 0.1896 1,575,415
10/10/2018 0.1991 0.2 0.16 0.1626 1,547,811
10/09/2018 0.238 0.27 0.175 0.1841 2,131,163
10/08/2018 0.24 0.2499 0.22 0.238 205,005
10/05/2018 0.253 0.305 0.233 0.24 287,390
10/04/2018 0.29 0.29 0.24 0.253 200,849
10/03/2018 0.25 0.295 0.24 0.28 285,431
10/02/2018 0.1975 0.256 0.19 0.25 285,150
10/01/2018 0.21 0.21 0.18 0.1957 715,877
09/28/2018 0.264 0.264 0.1895 0.202 1,420,473
09/27/2018 0.27 0.273 0.242 0.2649 737,406
09/26/2018 0.308 0.308 0.26 0.2782 361,590
09/25/2018 0.2965 0.3136 0.27 0.2993 302,231
09/24/2018 0.299 0.31 0.28 0.2955 236,198
09/21/2018 0.299 0.299 0.272 0.299 250,475
09/20/2018 0.2486 0.33 0.2358 0.299 924,370
09/19/2018 0.233 0.25 0.21 0.2486 1,015,394
09/18/2018 0.263 0.269 0.208 0.233 886,593
09/17/2018 0.285 0.293 0.251 0.27 533,946
09/14/2018 0.29 0.295 0.262 0.29 753,114
09/13/2018 0.339 0.346 0.2271 0.29 1,109,738
09/12/2018 0.40 0.4 0.3 0.33 1,016,307 .. NRs' bogus volume injection underway
09/11/2018 0.425 0.47 0.425 0.452 86,434 .. 10K Filed AH's
09/10/2018 0.38 0.5303 0.38 0.435 139,753
4kids
IPIX .. 9.23.19 trades .. curious to see if this *pattern* by NR continues on tomorrow and into next week ..
DRS % .. 156352/242989 .. 64.34% .. (52.25% Friday)
Hidden trades .. 26037/242989 .. 10.71% .. (15.40% Friday) .. since 4.26.19
interesting change out
Liquidity .. .02c .. (HOD .14c/LOD .12c)
NR = Just A Few Probs
neither 10 day or 90 day vol algo *maintained*
NRs' CONstant wash trades/resets remains blatant
https://investorshub.advfn.com/boards/read_msg.aspx?message_id=151418554
15:59:36 0.1277 6000 OTO .. hidden .. 15k = 6k/5k/4k .. (B/1222 .. A/13)
15:50:57 0.13 5000 OTO .. @ ask
15:33:50 0.1277 4000 OTO .. hidden (B/1222 .. A/13)
15:23:50 0.125 2700 OTO .. @ jumped bid
15:23:34 0.123 1000 OTO .. @ relo/d bid
15:00:24 0.124 7802 OTO .. @ relo/d bid .. relo/s bid
14:55:31 0.1251 1900 OTO .. @ bid .. relo/s bid
14:55:31 0.1251 5400 OTO .. relo/d bid .. 10k = 5400/4600
14:55:00 0.1259 4700 OTO .. @ bid .. 5k = 4700/300 .. relo/s bid
14:54:53 0.1259 300 OTO .. @ bid
14:54:53 0.1259 5000 OTO .. @ bid .. 15k = 5k/10k
14:54:18 0.1259 10000 OTO .. @ bid
14:53:48 0.1251 4600 OTO .. hidden .. mirrored .. (B/1222 .. A/135) .. relo/s bid
14:53:48 0.1285 4600 OTO .. hidden .. mirrored .. 5k = 4600/400 (B/1222 .. A/135)
14:53:44 0.1285 400 OTO .. @ bid
14:53:44 0.1285 5000 OTO .. @ relo/d bid .. 15k = 5k/10k
14:36:22 0.13 10000 OTO .. @ jumped bid .. relo/s bid
13:37:31 0.1285 1500 OTO .. @ bid .. relo/s bid
13:37:24 0.1285 5000 OTO .. @ bid
13:30:00 0.1285 4850 OTO .. @ bid .. 5k = 4850/150
13:29:57 0.1285 150 OTO .. @ bid
13:29:44 0.1285 8500 OTO .. @ bid .. 10k = 8500/1500
13:28:30 0.1285 600 OTO .. @ bid
13:28:17 0.1285 1500 OTO .. @ bid
13:28:11 0.1285 1000 OTO .. @ bid
12:17:43 0.1285 5000 OTO .. @ bid
11:32:34 0.1285 300 OTO .. @ bid
11:22:29 0.14 3000 OTO .. @ ask
11:22:20 0.1354 1000 OTO .. hidden (B/1285 .. A/14)
10:48:58 0.14 50000 OTO .. @ relo/d ask .. 50k = 43k/5k/1k/1k
10:17:12 0.135 5000 OTO .. @ UC ask .. relo/s ask (possible % based signal trade)
10:11:32 0.139 1000 OTO .. hidden (B/1285 .. A/14)
10:07:21 0.1285 750 OTO .. @ jumped bid
09:45:41 0.139 500 OTO .. hidden (B/1275 .. A/14)
09:41:39 0.137 10000 OTO .. @ relo/d ask
09:37:58 0.127 5000 OTO .. @ jumped bid
09:34:23 0.1279 4337 OTO .. hidden (B/1251 .. A/13)
09:34:23 0.13 6254 OTO .. @ ask .. 10k = 6254/3746
09:30:22 0.13 100 OTO .. @ ask
09:30:21 0.13 3746 OTO .. @ ask
09:30:05 0.12 700 OTO .. @ bid
09:30:05 0.12 900 OTO .. @ relo/d bid .. note 9:30:05
09:30:05 0.1251 43000 OTO .. @ bid .. relo/s bid
09:30:05 0.1251 900 OTO .. @ bid
Detailed Quote:IPIX .. hidden
INNOVATION PHARMACEUTICALS INC
0.12766Up 0.00213 (1.70 %)AS OF 3:59:36PM ET 09/23/2019
Last Trade 0.12766
Trade Time 3:59:36pm ET
Change 0.00213
% Change 1.70%
Bid 0.1222
Bid Size 10000
Ask 0.1349
Ask Size 5000
Open 0.1251
Day High 0.14 .. .02c *liquidity*
Day Low 0.12
Previous Close
09/20/2019 0.12553
52-Week High
05/08/2019 0.4351
52-Week Low
12/31/2018 0.07
Price Performance (Last 52 Weeks)
09/20/2019 -58.02%
Volume 242,989
Volume (10 day Average) 319,449
Volume (90 day Average) 443,547
Market Capitalization $25.93M
Shares Outstanding 206,529,000
B/A .. volume 242989
CDEL 0.1222 32,800 15:50
GTSM 0.1222 5,000 14:36
NITE 0.1222 5,000 15:23
ETRF 0.12 10,000 14:55
CSTI 0.12 6,286 13:52
CFGN 0.112 5,000 08/12
VNDM 0.11 5,000 09/20
STXG 0.06 10,000 02/19
VERT 0.05 10,000 05/21
PUMA 0.05 10,000 08:10
MAXM 0.0001 10,000 07:35
OTCX U 0 07:45
CDEL 0.13 29,800 15:50
NITE 0.1349 5,000 14:54
ETRF 0.135 10,000 12:58
GTSM 0.14 9,900 15:33
CFGN 0.199 5,000 07/29
CSTI 0.37 2,500 08:30
PUMA 0.40 2,500 08:10
VERT 0.45 2,500 05/17
VNDM 0.45 2,500 09/20
OTCX 1.00 100 10:54
STXG 2.00 100 02/19
MAXM 8.00 100 07:35
will reiterate .. the last *reality* an UPSIDE DOWN Non Retail *entity or two or three*
want .. is this data *digested* .. in other words .. educated retail investors aren't required .. it's all about NR
being able to shake out .. on their terms and timing .. (in other words .. controlling outcomes)
Daily Reg Sho %s for IPIX MAY 2019
May 31 NA NA NA 441,354 291,500 66.05% **** pattern change out on par with March 2019
May 30 NA NA NA 572,479 228,123 39.85%
May 29 NA NA NA 251,394 91,766 36.50%
May 28 NA NA NA 451,622 136,557 30.24%
May 24 NA NA NA 463,032 135,101 29.18% .. below 30%
May 23 NA NA NA 670,784 273,558 40.78%
May 22 NA NA NA 806,712 458,959 56.89%
May 21 NA NA NA 383,832 221,372 57.67%
May 20 NA NA NA 611,596 171,455 28.03% .. below 30%
May 17 NA NA NA 2,644,134 974,430 36.85%
May 16 NA NA NA 4,413,783 2,423,096 54.90% .. record volume (last seen in Aug 2015 & Dec 2014)
May 15 NA NA NA 237,776 131,535 55.32%
May 14 NA NA NA 880,776 285,052 32.36%
May 13 NA NA NA 668,718 140,210 20.97% .. below 30%
May 10 NA NA NA 2,377,716 709,931 29.86% .. below 30%
May 09 NA NA NA 863,112 349,682 40.51%
May 08 NA NA NA 2,306,040 639,986 27.75% .. below 30%
May 07 NA NA NA 2,513,988 1,381,260 54.94%
May 06 NA NA NA 760,633 566,203 74.44% .. NRs' *set up* to negate 5.16.16 8K underway
May 03 NA NA NA 403,294 131,058 32.50% ** NRs' test ends @ 11:04AM
May 02 NA NA NA 100,904 30,600 30.33% *** pattern change out .. NRs' take up/set up
May 01 NA NA NA 396,482 268,325 67.68%
IPIX Historical September 10, 2018 - December 31, 2018
12/31/2018 0.08 0.10 0.07 0.0954 631,343
12/28/2018 0.083 0.109 0.083 0.1036 531,169
12/27/2018 0.082 0.09 0.081 0.0876 468,153
12/26/2018 0.08 0.095 0.08 0.09 346,379
12/24/2018 0.095 0.095 0.08 0.08 372,923
12/21/2018 0.099 0.105 0.075 0.095 844,903
12/20/2018 0.11 0.11 0.0961 0.097 806,466
12/19/2018 0.12 0.12 0.103 0.11 1,060,552
12/18/2018 0.12 0.14 0.1101 0.1153 830,184
12/17/2018 0.17 0.17 0.125 0.1293 768,696
12/14/2018 0.123 0.16 0.115 0.145 414,408
12/13/2018 0.155 0.155 0.116 0.1202 459,830
12/12/2018 0.125 0.13 0.1152 0.127 523,824
12/11/2018 0.14 0.16 0.125 0.1399 849,983
12/10/2018 0.1299 0.16 0.1299 0.16 226,349
12/07/2018 0.123 0.135 0.11 0.133 295,802
12/06/2018 0.1245 0.1412 0.122 0.13 321,739
12/04/2018 0.12 0.1369 0.12 0.1231 420,537
12/03/2018 0.13 0.14 0.121 0.1343 345,949
11/30/2018 0.1375 0.1375 0.128 0.135 497,326
11/29/2018 0.1301 0.15 0.125 0.1327 1,379,661
11/28/2018 0.1325 0.15 0.1288 0.133 875,275
11/27/2018 0.125 0.1325 0.1101 0.132 475,115
11/26/2018 0.17 0.17 0.12 0.126 485,796
11/23/2018 0.1135 0.149 0.1135 0.14 884,102
11/21/2018 0.108 0.115 0.103 0.11 462,656
11/20/2018 0.108 0.115 0.1025 0.11 392,564
11/19/2018 0.122 0.132 0.105 0.11 1,058,420
11/16/2018 0.1369 0.1369 0.113 0.122 493,784
11/15/2018 0.125 0.137 0.115 0.137 687,206
11/14/2018 0.14 0.14 0.125 0.128 286,871
11/13/2018 0.17 0.17 0.1335 0.14 274,668
11/12/2018 0.155 0.155 0.135 0.14 690,455
11/09/2018 0.16 0.175 0.145 0.152 486,370
11/08/2018 0.14 0.175 0.137 0.1645 1,470,273
11/07/2018 0.1661 0.172 0.14 0.15 811,782
11/06/2018 0.18 0.185 0.159 0.1679 463,864
11/05/2018 0.19 0.21 0.17 0.185 1,033,642
11/02/2018 0.13 0.189 0.128 0.187 1,372,537
11/01/2018 0.135 0.14 0.125 0.13 634,420
10/31/2018 0.135 0.135 0.127 0.133 386,639
10/30/2018 0.13 0.14 0.1254 0.132 337,278
10/29/2018 0.134 0.144 0.13 0.135 1,114,409
10/26/2018 0.138 0.14 0.123 0.136 876,765
10/25/2018 0.1415 0.15 0.131 0.1374 619,964
10/24/2018 0.138 0.148 0.128 0.148 847,006
10/23/2018 0.138 0.14 0.122 0.137 774,467
10/22/2018 0.18 0.18 0.125 0.132 951,411
10/19/2018 0.1635 0.164 0.12 0.1462 1,869,230
10/18/2018 0.1779 0.1779 0.1534 0.164 788,072
10/17/2018 0.18 0.18 0.165 0.1779 446,377
10/16/2018 0.19 0.2 0.177 0.18 875,248
10/15/2018 0.20 0.24 0.18 0.1856 660,059
10/12/2018 0.19 0.205 0.177 0.2 713,829
10/11/2018 0.16 0.1896 0.159 0.1896 1,575,415
10/10/2018 0.1991 0.2 0.16 0.1626 1,547,811
10/09/2018 0.238 0.27 0.175 0.1841 2,131,163
10/08/2018 0.24 0.2499 0.22 0.238 205,005
10/05/2018 0.253 0.305 0.233 0.24 287,390
10/04/2018 0.29 0.29 0.24 0.253 200,849
10/03/2018 0.25 0.295 0.24 0.28 285,431
10/02/2018 0.1975 0.256 0.19 0.25 285,150
10/01/2018 0.21 0.21 0.18 0.1957 715,877
09/28/2018 0.264 0.264 0.1895 0.202 1,420,473
09/27/2018 0.27 0.273 0.242 0.2649 737,406
09/26/2018 0.308 0.308 0.26 0.2782 361,590
09/25/2018 0.2965 0.3136 0.27 0.2993 302,231
09/24/2018 0.299 0.31 0.28 0.2955 236,198
09/21/2018 0.299 0.299 0.272 0.299 250,475
09/20/2018 0.2486 0.33 0.2358 0.299 924,370
09/19/2018 0.233 0.25 0.21 0.2486 1,015,394
09/18/2018 0.263 0.269 0.208 0.233 886,593
09/17/2018 0.285 0.293 0.251 0.27 533,946
09/14/2018 0.29 0.295 0.262 0.29 753,114
09/13/2018 0.339 0.346 0.2271 0.29 1,109,738
09/12/2018 0.40 0.4 0.3 0.33 1,016,307 .. NRs' bogus volume injection underway
09/11/2018 0.425 0.47 0.425 0.452 86,434 .. 10K Filed AH's
09/10/2018 0.38 0.5303 0.38 0.435 139,753
4kids
IPIX .. 9.20.19 trades .. curious to see if this *pattern* by NR continues on tomorrow and into next week ..
DRS % .. 204825/391942 .. 52.25% .. (75.78% Thursday)
Hidden trades .. 60398/391942 .. 15.40% .. (11.19% Thursday) .. since 4.26.19
interesting change out
Liquidity .. .02c .. (HOD .14c/LOD .12c)
NR = Just A Few Probs
10 day avg maintained .. not so for the 90 day vol avg
NRs' CONstant wash trades/resets remains blatant
https://investorshub.advfn.com/boards/read_msg.aspx?message_id=151249610
15:52:18 0.1255 5000 OTO .. hidden (B/12 .. A/1279) .. 30k = 5k/13300/1700/10k
15:45:20 0.12 13300 OTO .. @ bid .. 15k = 13300/1700
15:45:03 0.1201 1700 OTO .. hidden (B/12 .. A/1279)
15:44:25 0.1255 10000 OTO .. hidden (B/12 .. A/1279)
15:40:59 0.12 3198 OTO .. @ relo/d bid .. 10k split trade (3198/6802)
15:40:56 0.126 6802 OTO .. hidden (B/12 .. A/1279)
15:37:59 0.1279 24690 OTO .. @ ask
15:37:52 0.1279 1000 OTO .. @ relo/d ask .. mirrored
15:37:43 0.1247 1000 OTO .. hidden (B/12 .. A/1279) .. 30k = 1k/5k/5k/9k/10k .. 30k = 15k x2
15:28:59 0.1255 5000 OTO .. hidden (B/12 .. A/1279)
15:26:57 0.1255 5000 OTO .. hidden (B/12 .. A/1279)
15:17:01 0.1205 9000 OTO .. @ jumped bid
15:15:15 0.1205 10000 OTO .. @ jumped bid
15:00:43 i 0.124 21 OTO .. @ UC ask
14:13:54 0.1201 7500 OTO .. @ jumped bid .. note 12:54:39
13:56:51 0.12 15000 OTO .. hidden .. mirrored (B/1188 .. A/124)
13:56:44 0.12 15000 OTO .. @ bid .. 15k = 5k x 3
13:56:40 0.12 30800 OTO .. @ relo/d bid
13:56:38 0.1201 5000 OTO .. @ bid .. relo/s bid .. 15k = 5k x3
13:18:00 0.1201 5000 OTO .. @ bid
13:17:58 0.1201 5000 OTO .. @ bid
13:16:17 0.1201 14000 OTO .. @ relo/d bid
13:15:42 0.125 2500 OTO .. @ UC ask .. note PPS is prior jumped bid .. 10k = 2500/7500
12:54:39 0.125 7500 OTO .. @ jumped bid .. note PPS is prior UC ask
12:44:58 0.125 5000 OTO .. @ ask .. 10k = 5k/1k/4k
12:44:35 0.125 1000 OTO .. @ ask
12:20:38 0.125 4000 OTO .. @ UC ask
12:20:13 0.1201 20000 OTO .. @ relo/d bid .. 35k = 20k/15k
12:20:09 0.1225 5000 OTO .. @ relo/d bid .. relo/s bid
12:20:05 0.1251 1000 OTO .. @ ask
12:19:59 0.125 5000 OTO .. @ bid .. relo/s bid
12:19:54 0.125 15000 OTO .. @ bid
12:19:50 0.1251 2970 OTO .. @ UC ask
12:19:44 0.125 5000 OTO .. @ bid
12:16:06 0.125 3000 OTO .. @ bid .. note 10:30:37
12:16:03 0.1295 5000 OTO .. hidden .. mirrored (B/125 .. A/1339)
11:17:35 0.125 25000 OTO .. @ relo/d bid .. 35k = 25k/10k
11:17:31 0.129 10000 OTO .. @ relo/d bid .. relo/s bid
11:06:24 0.1374 990 OTO .. hidden (B/129 .. A/1375)
11:03:24 0.1374 1356 OTO .. hidden (B/129 .. A/1375)
10:52:59 0.13 5400 OTO .. @ bid
10:52:58 0.13 9500 OTO .. @ bid
10:52:15 0.13 10000 OTO .. @ bid
10:30:37 0.1364 3000 OTO .. hidden (B/13 .. A/1375)
10:27:35 0.13 1765 OTO .. @ bid
10:27:35 0.13 1900 OTO .. @ bid
10:27:29 0.13 5000 OTO .. @ bid
10:15:06 0.13 5000 OTO .. @ bid
10:06:06 0.13 5000 OTO .. @ bid .. 35k = 30k/5k
09:45:28 0.13 2000 OTO .. @ bid
09:43:05 0.13 30000 OTO .. @ bid
09:30:12 0.14 500 OTO .. @ ask
09:30:02 0.1385 550 OTO .. hidden (B/13 .. A/14)
trading codes .. yet another day this month for IPIX
   T&S Codes:

    a = acquisition
    b = bunched trade - average price
    c = cash trade
    d = distribution
    e = automatic execution
    g = bunched sold trade - opening/reopening trade detail
    h = intraday trade detail
    i = basket index on close transaction
    j = rule 127 trade
    k = rule 155 trade
    l = sold last
    n = next day
    o = opened
    p = prior reference price
    r = seller
    s = split trade
    t = form t trade - pre/post market trade
    u = extended hours trade - reported late or out of sequence
    w = average price trade
    y = yellow flagged regular trade
    z = sold - out of sequence
Detailed Quote:IPIX
INNOVATION PHARMACEUTICALS INC
0.12553Down -0.01337 (-9.63 %)AS OF 3:52:18PM ET 09/20/2019
Last Trade 0.12553
Trade Time 3:52:18pm ET
Change -0.01337
% Change -9.63%
Bid 0.12
Bid Size 13502
Ask 0.1279
Ask Size 9510
Open 0.1385
Day High 0.14 .. .02c *liquidity*
Day Low 0.12
Previous Close
09/19/2019 0.1389
52-Week High
05/08/2019 0.4351
52-Week Low
12/31/2018 0.07
Price Performance (Last 52 Weeks)
09/19/2019 -44.13%
Volume 391,942
Volume (10 day Average) 330,107
Volume (90 day Average) 448,979
Market Capitalization $28.69M
Shares Outstanding 206,529,000
B/A .. volume 391942
NITE 0.12 8,502 15:40
ETRF 0.12 5,000 15:45
GTSM 0.1128 5,000 13:56
CFGN 0.112 5,000 08/12
VNDM 0.11 5,000 09/19
CSTI 0.105 6,000 13:56
CDEL 0.10 50,826 15:40
STXG 0.06 10,000 02/19
VERT 0.05 10,000 05/21
PUMA 0.05 10,000 08:10
MAXM 0.0001 10,000 07:51
OTCX U 0 07:44
CDEL 0.1279 9,510 15:40
NITE 0.13 5,000 15:17
GTSM 0.15 5,800 15:37
ETRF 0.18 14,995 15:32
CFGN 0.199 5,000 07/29
CSTI 0.37 46,400 13:56
PUMA 0.40 2,500 08:10
VERT 0.45 2,500 05/17
VNDM 0.45 2,500 09/19
OTCX 1.00 100 09:30
STXG 2.00 100 02/19
MAXM 8.00 100 07:51
will reiterate .. the last *reality* an UPSIDE DOWN Non Retail *entity or two or three*
want .. is this data *digested* .. in other words .. educated retail investors aren't required .. it's all about NR
being able to shake out .. on their terms and timing .. (in other words .. controlling outcomes)
Daily Reg Sho %s for IPIX MAY 2019
May 31 NA NA NA 441,354 291,500 66.05% **** pattern change out on par with March 2019
May 30 NA NA NA 572,479 228,123 39.85%
May 29 NA NA NA 251,394 91,766 36.50%
May 28 NA NA NA 451,622 136,557 30.24%
May 24 NA NA NA 463,032 135,101 29.18% .. below 30%
May 23 NA NA NA 670,784 273,558 40.78%
May 22 NA NA NA 806,712 458,959 56.89%
May 21 NA NA NA 383,832 221,372 57.67%
May 20 NA NA NA 611,596 171,455 28.03% .. below 30%
May 17 NA NA NA 2,644,134 974,430 36.85%
May 16 NA NA NA 4,413,783 2,423,096 54.90% .. record volume (last seen in Aug 2015 & Dec 2014)
May 15 NA NA NA 237,776 131,535 55.32%
May 14 NA NA NA 880,776 285,052 32.36%
May 13 NA NA NA 668,718 140,210 20.97% .. below 30%
May 10 NA NA NA 2,377,716 709,931 29.86% .. below 30%
May 09 NA NA NA 863,112 349,682 40.51%
May 08 NA NA NA 2,306,040 639,986 27.75% .. below 30%
May 07 NA NA NA 2,513,988 1,381,260 54.94%
May 06 NA NA NA 760,633 566,203 74.44% .. NRs' *set up* to negate 5.16.16 8K underway
May 03 NA NA NA 403,294 131,058 32.50% ** NRs' test ends @ 11:04AM
May 02 NA NA NA 100,904 30,600 30.33% *** pattern change out .. NRs' take up/set up
May 01 NA NA NA 396,482 268,325 67.68%
IPIX Historical September 10, 2018 - December 31, 2018
12/31/2018 0.08 0.10 0.07 0.0954 631,343
12/28/2018 0.083 0.109 0.083 0.1036 531,169
12/27/2018 0.082 0.09 0.081 0.0876 468,153
12/26/2018 0.08 0.095 0.08 0.09 346,379
12/24/2018 0.095 0.095 0.08 0.08 372,923
12/21/2018 0.099 0.105 0.075 0.095 844,903
12/20/2018 0.11 0.11 0.0961 0.097 806,466
12/19/2018 0.12 0.12 0.103 0.11 1,060,552
12/18/2018 0.12 0.14 0.1101 0.1153 830,184
12/17/2018 0.17 0.17 0.125 0.1293 768,696
12/14/2018 0.123 0.16 0.115 0.145 414,408
12/13/2018 0.155 0.155 0.116 0.1202 459,830
12/12/2018 0.125 0.13 0.1152 0.127 523,824
12/11/2018 0.14 0.16 0.125 0.1399 849,983
12/10/2018 0.1299 0.16 0.1299 0.16 226,349
12/07/2018 0.123 0.135 0.11 0.133 295,802
12/06/2018 0.1245 0.1412 0.122 0.13 321,739
12/04/2018 0.12 0.1369 0.12 0.1231 420,537
12/03/2018 0.13 0.14 0.121 0.1343 345,949
11/30/2018 0.1375 0.1375 0.128 0.135 497,326
11/29/2018 0.1301 0.15 0.125 0.1327 1,379,661
11/28/2018 0.1325 0.15 0.1288 0.133 875,275
11/27/2018 0.125 0.1325 0.1101 0.132 475,115
11/26/2018 0.17 0.17 0.12 0.126 485,796
11/23/2018 0.1135 0.149 0.1135 0.14 884,102
11/21/2018 0.108 0.115 0.103 0.11 462,656
11/20/2018 0.108 0.115 0.1025 0.11 392,564
11/19/2018 0.122 0.132 0.105 0.11 1,058,420
11/16/2018 0.1369 0.1369 0.113 0.122 493,784
11/15/2018 0.125 0.137 0.115 0.137 687,206
11/14/2018 0.14 0.14 0.125 0.128 286,871
11/13/2018 0.17 0.17 0.1335 0.14 274,668
11/12/2018 0.155 0.155 0.135 0.14 690,455
11/09/2018 0.16 0.175 0.145 0.152 486,370
11/08/2018 0.14 0.175 0.137 0.1645 1,470,273
11/07/2018 0.1661 0.172 0.14 0.15 811,782
11/06/2018 0.18 0.185 0.159 0.1679 463,864
11/05/2018 0.19 0.21 0.17 0.185 1,033,642
11/02/2018 0.13 0.189 0.128 0.187 1,372,537
11/01/2018 0.135 0.14 0.125 0.13 634,420
10/31/2018 0.135 0.135 0.127 0.133 386,639
10/30/2018 0.13 0.14 0.1254 0.132 337,278
10/29/2018 0.134 0.144 0.13 0.135 1,114,409
10/26/2018 0.138 0.14 0.123 0.136 876,765
10/25/2018 0.1415 0.15 0.131 0.1374 619,964
10/24/2018 0.138 0.148 0.128 0.148 847,006
10/23/2018 0.138 0.14 0.122 0.137 774,467
10/22/2018 0.18 0.18 0.125 0.132 951,411
10/19/2018 0.1635 0.164 0.12 0.1462 1,869,230
10/18/2018 0.1779 0.1779 0.1534 0.164 788,072
10/17/2018 0.18 0.18 0.165 0.1779 446,377
10/16/2018 0.19 0.2 0.177 0.18 875,248
10/15/2018 0.20 0.24 0.18 0.1856 660,059
10/12/2018 0.19 0.205 0.177 0.2 713,829
10/11/2018 0.16 0.1896 0.159 0.1896 1,575,415
10/10/2018 0.1991 0.2 0.16 0.1626 1,547,811
10/09/2018 0.238 0.27 0.175 0.1841 2,131,163
10/08/2018 0.24 0.2499 0.22 0.238 205,005
10/05/2018 0.253 0.305 0.233 0.24 287,390
10/04/2018 0.29 0.29 0.24 0.253 200,849
10/03/2018 0.25 0.295 0.24 0.28 285,431
10/02/2018 0.1975 0.256 0.19 0.25 285,150
10/01/2018 0.21 0.21 0.18 0.1957 715,877
09/28/2018 0.264 0.264 0.1895 0.202 1,420,473
09/27/2018 0.27 0.273 0.242 0.2649 737,406
09/26/2018 0.308 0.308 0.26 0.2782 361,590
09/25/2018 0.2965 0.3136 0.27 0.2993 302,231
09/24/2018 0.299 0.31 0.28 0.2955 236,198
09/21/2018 0.299 0.299 0.272 0.299 250,475
09/20/2018 0.2486 0.33 0.2358 0.299 924,370
09/19/2018 0.233 0.25 0.21 0.2486 1,015,394
09/18/2018 0.263 0.269 0.208 0.233 886,593
09/17/2018 0.285 0.293 0.251 0.27 533,946
09/14/2018 0.29 0.295 0.262 0.29 753,114
09/13/2018 0.339 0.346 0.2271 0.29 1,109,738
09/12/2018 0.40 0.4 0.3 0.33 1,016,307 .. NRs' bogus volume injection underway
09/11/2018 0.425 0.47 0.425 0.452 86,434 .. 10K Filed AH's
09/10/2018 0.38 0.5303 0.38 0.435 139,753
4kids
IPIX .. responding to 3 separate queries re: NRs' *set up*
my PM to one IPI investor just now as to NR's intent (PPS take up/take down)
=================================
i think it is a 50/50 toss right now
2 weeks ago yesterday .. 100k went off in the last 10 minutes of the trading day
(IPIX closed up)
IPIX 9.13.19
due to that *effort* .. I expected to see an 8K filed the following Monday AM
instead what came was a PR out of IPI
September 16, 2019
INNOVATION PHARMACEUTICALS ANNOUNCES SUCCESSFUL FORMULATION OF ORAL BRILACIDIN TABLETS; UPCOMING CLINICAL TRIAL TO TARGET DELIVERY TO THE COLON
http://www.ipharminc.com/press-release
but what was interesting to me that week .. was what I was seeing on the *ask*
side for several days .. a *thinned* out ask side .. we also saw IPIX taken up to
18c (meaning NR wasn't *blocking* on the ask as has been the norm for most of 2019)
(and just a reminder no one does smoke and mirrors better then Non Retail)
09/19/2019 0.125 0.18 0.125 0.1389 410,404
“Leo said that he will provide more clarity in the coming weeks. “A new direction, a new understanding of what’s going on, actually growing the company, not shrinking it.”
CDEL 0.1595 6,000 15:48
ETRF 0.1598 8,000 15:51
PAUL 0.164 5,000 14:57
CSTI 0.165 5,000 13:49
NITE 0.17 10,000 15:23
CFGN 0.19 5,000 11:45
VERT 0.20 2,500 02/05
VNDM 0.20 2,500 04/30
CANT 0.20 2,500 08:30
LAFC 0.27 2,500 04/10
PUMA 0.35 2,500 08:10
STXG 2.00 100 02/19
MAXM 8.00 100 07:35
INTL U 0 10/24
DBOX U 0 01/22
CDEL 0.14 10,000 13:14
NITE 0.1445 5,000 09:56
ETRF 0.1595 25,000 11:57
GTSM 0.1819 5,000 09/13
CFGN 0.199 5,000 07/29
CSTI 0.25 2,500 08:30
PUMA 0.40 2,500 08:10
VERT 0.45 2,500 05/17
VNDM 0.45 2,500 09/13
OTCX 1.00 100 09:30
STXG 2.00 100 02/19
MAXM 8.00 100 07:35
05/01/2019 0.142 0.17 0.142 0.1595 396,482
05/08/2019 0.435 0.4351 0.3103 0.345 2,366,980 **
05/10/2019 0.287 0.32 0.2039 0.21 2,377,716
12/08/2014 3.41 4.64 3.40 4.49 4,265,945
08/06/2015 2.47 2.57 1.52 1.71 4,181,492
05/16/2019 0.213 0.33 0.21 0.32 4,413,783
IPIX .. DRS % .. Sep 20 NA NA NA 391,942 204,825 52.26% DRS % .. Sep 23 NA NA NA 242,989 156,352 64.35% DRS % .. Sep 24 NA NA NA 318,382 126,319 39.68% DRS % .. Sep 25 NA NA NA 351,695 164,555 46.79% DRS % .. 09/26/2019 0.11 0.114 0.102 0.1088 345,821 DRS % .. Sep 27 NA NA NA 660,343 500,993 75.87% 08/05/2019 0.162 0.1699 0.146 0.148 665,390
imo NR (non retail) is setting up for the 10K due out of mgmt this month
1 .. the easiest aspect NR *controls* is a target's PPS
in case it was missed .. NRs' ability to reset via washed trades/efforts
According to the order, Vandham routinely facilitated its broker-dealer customers' sales into the market by executing short sales throughout the day for its own account in the stocks being sold by these other firms on behalf of their customers. The order finds that Vandham later purchased shares in those stocks at a lower price from the other firms, also in its own account, to cover Vandham's short positions. For at least several thousand such short sales during the relevant period, Vandham failed to locate shares of those stocks that it could borrow. The order further finds that Vandham often published offers on OTC Link's electronic quotation service to sell shares it had purchased from its broker-dealer customers without first obtaining and reviewing required documents and information about the shares' issuers.
until I can find the time to put out each days' respective tapes .. showing the cliff notes *version*
of IPIX's data this past week .. note *volume* avgs (NRs' ability or inability to do volume algo maintenance
and what that *effort* cost them specific to DRS %s) .. remember too .. no retail investor holds IPIX shares
below 7c (reset on 12.31.18 after NRs' bogus volume
injection) and for most of 2019 NR has *held* (excluding NRs' orchestration to negate in May) IPIX in a *tight* PPS range
IPIX Historical .. September 20, 2019 - September 27, 2019
09/27/2019 0.105 0.113 0.105 0.11 660,343
09/26/2019 0.11 0.114 0.102 0.1088 345,821
09/25/2019 0.1219 0.1219 0.109 0.11 351,695
09/24/2019 0.13 0.13 0.1188 0.1188 318,382
09/23/2019 0.1251 0.14 0.12 0.1277 242,989
09/20/2019 0.1385 0.14 0.12 0.1255 391,942
Historical Short Volume Data for IPIX
Date Close High Low Volume Sht Vol % of Vol Shtd
Sep 27 NA NA NA 660,343 500,993 75.87%
Sep 26 NA NA NA 345,821 214,086 61.91%
Sep 25 NA NA NA 351,695 164,555 46.79%
Sep 24 NA NA NA 318,382 126,319 39.68%
Sep 23 NA NA NA 242,989 156,352 64.35%
Sep 20 NA NA NA 391,942 204,825 52.26%
IPIX .. 9.20.19
Open 0.1385
Day High 0.14 .. .02c *liquidity*
Day Low 0.12
Previous Close
09/19/2019 0.1389
52-Week High
05/08/2019 0.4351
52-Week Low
12/31/2018 0.07
Price Performance (Last 52 Weeks)
09/19/2019 -44.13%
Volume 391,942 .. 10 day maintained .. 90 day NOT maintained
Volume (10 day Average) 330,107
Volume (90 day Average) 448,979
Market Capitalization $28.69M
Shares Outstanding 206,529,000
==============================
IPIX .. 9.23.19
Open 0.1251
Day High 0.14 .. .02c *liquidity*
Day Low 0.12
Previous Close
09/20/2019 0.12553
52-Week High
05/08/2019 0.4351
52-Week Low
12/31/2018 0.07
Price Performance (Last 52 Weeks)
09/20/2019 -58.02%
Volume 242,989 .. Neither 10 day or 90 day volume algo maintained
Volume (10 day Average) 319,449
Volume (90 day Average) 443,547
Market Capitalization $25.93M
Shares Outstanding 206,529,000
=============================
IPIX .. 9.24.19
Open 0.13
Day High 0.13 .. .0112c *liquidity*
Day Low 0.1188
Previous Close
09/23/2019 0.12766
52-Week High
05/08/2019 0.4351
52-Week Low
12/31/2018 0.07
Price Performance (Last 52 Weeks)
09/23/2019 -57.30%
Volume 318,382 .. Neither 10 day or 90 day volume algo maintained
Volume (10 day Average) 328,110
Volume (90 day Average) 443,605
Market Capitalization $26.37M
Shares Outstanding 206,529,000
==============================
IPIX .. 9.25.19
Open 0.1219
Day High 0.1219 .. .0129c *liquidity*
Day Low 0.109
Previous Close
09/24/2019 0.1188
52-Week High
05/08/2019 0.4351
52-Week Low
12/31/2018 0.07
Price Performance (Last 52 Weeks)
09/24/2019 -59.80%
Volume 351,695 .. 10 day vol algo maintained .. 90 day NOT maintained
Volume (10 day Average) 331,627
Volume (90 day Average) 398,101
Market Capitalization $24.54M
Shares Outstanding 206,529,000
================================
IPIX .. 9.26.19
Open 0.11
Day High 0.114 .. .012c *liquidity*
Day Low 0.102
Previous Close
09/25/2019 0.11
52-Week High
05/08/2019 0.4351
52-Week Low
12/31/2018 0.07
Price Performance (Last 52 Weeks)
09/25/2019 -63.25%
Volume 345,821 .. note just shy of 10 day vol algo .. 90 day vol algo NOT maintained
Volume (10 day Average) 346,727
Volume (90 day Average) 372,546 .. Note NRs' *slippage* sub 400k
Market Capitalization $22.72M
Shares Outstanding 206,529,000
===============================
iPIX .. 9.27.19
Open 0.105
Day High 0.113 .. .008c *liquidity*
Day Low 0.105
Previous Close
09/26/2019 0.1088
52-Week High
05/08/2019 0.4351
52-Week Low
12/31/2018 0.07
Price Performance (Last 52 Weeks)
09/26/2019 -60.90%
Volume 660,343 ** .. Note 10/90 day vol aglo/s maintained @ a cost of 75%
Volume (10 day Average) 357,943
Volume (90 day Average) 369,593
Market Capitalization $22.47M
Shares Outstanding 206,529,000
** highest *volume* on IPIX since August 5, 2019
==================================
Just a reminder .. NR can *stall* (most of 2019) .. NR can *reset & wash trade*
(and does so when UPSIDE DOWN with a significantly increased DRS %)
and NR can illegally manipulate/orchestrate *target's* PPS upward/controlled
(IPIX take up as we all got to see NR do in May 2019 on 23M~ volume/month to
negate the impact of the 5.16.19 PR)
lastly YOY %s (-) are also revealing .. the last thing an UPSIDE DOWN NR wants
is YOY going green ..
IPIX's Historical (last Q of 2018)
12/31/2018 0.08 0.10 0.07 0.0954 631,343
12/28/2018 0.083 0.109 0.083 0.1036 531,169
12/27/2018 0.082 0.09 0.081 0.0876 468,153
12/26/2018 0.08 0.095 0.08 0.09 346,379
12/24/2018 0.095 0.095 0.08 0.08 372,923
12/21/2018 0.099 0.105 0.075 0.095 844,903
12/20/2018 0.11 0.11 0.0961 0.097 806,466
12/19/2018 0.12 0.12 0.103 0.11 1,060,552
12/18/2018 0.12 0.14 0.1101 0.1153 830,184
12/17/2018 0.17 0.17 0.125 0.1293 768,696
12/14/2018 0.123 0.16 0.115 0.145 414,408
12/13/2018 0.155 0.155 0.116 0.1202 459,830
12/12/2018 0.125 0.13 0.1152 0.127 523,824
12/11/2018 0.14 0.16 0.125 0.1399 849,983
12/10/2018 0.1299 0.16 0.1299 0.16 226,349
12/07/2018 0.123 0.135 0.11 0.133 295,802
12/06/2018 0.1245 0.1412 0.122 0.13 321,739
12/04/2018 0.12 0.1369 0.12 0.1231 420,537
12/03/2018 0.13 0.14 0.121 0.1343 345,949
11/30/2018 0.1375 0.1375 0.128 0.135 497,326
11/29/2018 0.1301 0.15 0.125 0.1327 1,379,661
11/28/2018 0.1325 0.15 0.1288 0.133 875,275
11/27/2018 0.125 0.1325 0.1101 0.132 475,115
11/26/2018 0.17 0.17 0.12 0.126 485,796
11/23/2018 0.1135 0.149 0.1135 0.14 884,102
11/21/2018 0.108 0.115 0.103 0.11 462,656
11/20/2018 0.108 0.115 0.1025 0.11 392,564
11/19/2018 0.122 0.132 0.105 0.11 1,058,420
11/16/2018 0.1369 0.1369 0.113 0.122 493,784
11/15/2018 0.125 0.137 0.115 0.137 687,206
11/14/2018 0.14 0.14 0.125 0.128 286,871
11/13/2018 0.17 0.17 0.1335 0.14 274,668
11/12/2018 0.155 0.155 0.135 0.14 690,455
11/09/2018 0.16 0.175 0.145 0.152 486,370
11/08/2018 0.14 0.175 0.137 0.1645 1,470,273
11/07/2018 0.1661 0.172 0.14 0.15 811,782
11/06/2018 0.18 0.185 0.159 0.1679 463,864
11/05/2018 0.19 0.21 0.17 0.185 1,033,642
11/02/2018 0.13 0.189 0.128 0.187 1,372,537
11/01/2018 0.135 0.14 0.125 0.13 634,420
10/31/2018 0.135 0.135 0.127 0.133 386,639
10/30/2018 0.13 0.14 0.1254 0.132 337,278
10/29/2018 0.134 0.144 0.13 0.135 1,114,409
10/26/2018 0.138 0.14 0.123 0.136 876,765
10/25/2018 0.1415 0.15 0.131 0.1374 619,964
10/24/2018 0.138 0.148 0.128 0.148 847,006
10/23/2018 0.138 0.14 0.122 0.137 774,467
10/22/2018 0.18 0.18 0.125 0.132 951,411
10/19/2018 0.1635 0.164 0.12 0.1462 1,869,230
10/18/2018 0.1779 0.1779 0.1534 0.164 788,072
10/17/2018 0.18 0.18 0.165 0.1779 446,377
10/16/2018 0.19 0.2 0.177 0.18 875,248
10/15/2018 0.2 0.24 0.18 0.1856 660,059
10/12/2018 0.19 0.205 0.177 0.2 713,829
10/11/2018 0.16 0.1896 0.159 0.1896 1,575,415
10/10/2018 0.1991 0.2 0.16 0.1626 1,547,811
10/09/2018 0.238 0.27 0.175 0.1841 2,131,163
10/08/2018 0.24 0.2499 0.22 0.238 205,005
10/05/2018 0.253 0.305 0.233 0.24 287,390
10/04/2018 0.29 0.29 0.24 0.253 200,849
10/03/2018 0.25 0.295 0.24 0.28 285,431
10/02/2018 0.1975 0.256 0.19 0.25 285,150
10/01/2018 0.21 0.21 0.18 0.1957 715,877
4kids
quick scan of VNDM & PTOI during 2016/2017 .. 100s of posts of mine
revealing just how many times VNDM was *active* in PTOI in 2016/2017
as reported to both Finra (MM Monthly) and via RT l2 *activity*
https://investorshub.advfn.com/boards/read_msg.aspx?message_id=129009152
not surprisingly after the shell game of GTSM & CANT
we now have the same *game* with VNDM (Vandham Securities & Wall Street Access)
i have always referred to this *activity and effort* as resets r possible
illegally manipulating OTC targets like PTOI isn't something done by actual retail investors
last week .. the SEC released this via *enforcement* .. note the dates and description .. red is my add
The SEC's order finds that Vandham's customers were primarily other broker-dealers engaged in the liquidation of large volumes of shares in thinly traded, low priced over-the-counter stocks held by their customers. From at least January 2016 through April 2017, while registered with the SEC, Vandham derived the majority of its revenue from the trading profits it generated by facilitating the sale of such shares into the market for two broker-dealer customers.
According to the order, Vandham routinely facilitated its broker-dealer customers' sales into the market by executing short sales throughout the day for its own account in the stocks being sold by these other firms on behalf of their customers. The order finds that Vandham later purchased shares in those stocks at a lower price from the other firms, also in its own account, to cover Vandham's short positions. For at least several thousand such short sales during the relevant period, Vandham failed to locate shares of those stocks that it could borrow.
https://www.sec.gov/enforce/34-86970-s
never dull
4kids
gee you don't say ..
for just about a decade now .. i've referred to this illegal stock manipulation by NR (non retail) as
resets r possible
According to the order, Vandham routinely facilitated its broker-dealer customers' sales into the market by executing short sales throughout the day for its own account in the stocks being sold by these other firms on behalf of their customers. The order finds that Vandham later purchased shares in those stocks at a lower price from the other firms, also in its own account, to cover Vandham's short positions. For at least several thousand such short sales during the relevant period, Vandham failed to locate shares of those stocks that it could borrow. The order further finds that Vandham often published offers on OTC Link's electronic quotation service to sell shares it had purchased from its broker-dealer customers without first obtaining and reviewing required documents and information about the shares' issuers.
hmmmm
IPIX >> PTOI >> how many other *OTC targets* did VNDM *work* in 2016/2017
4kids
SEC Charges Brokerage Firm for Short Sale and Other Violations
ADMINISTRATIVE PROCEEDING
File No. 3-19453
September 16, 2019 - The Securities and Exchange Commission today announced settled charges against Vandham Securities Corp., formerly a registered broker-dealer based in New Jersey, for violating federal securities laws governing the execution of short sales, the publication of quotations in unlisted securities, and the submission of suspicious activity reports (SARs).
The SEC's order finds that Vandham's customers were primarily other broker-dealers engaged in the liquidation of large volumes of shares in thinly traded, low priced over-the-counter stocks held by their customers. From at least January 2016 through April 2017, while registered with the SEC, Vandham derived the majority of its revenue from the trading profits it generated by facilitating the sale of such shares into the market for two broker-dealer customers.
According to the order, Vandham routinely facilitated its broker-dealer customers' sales into the market by executing short sales throughout the day for its own account in the stocks being sold by these other firms on behalf of their customers. The order finds that Vandham later purchased shares in those stocks at a lower price from the other firms, also in its own account, to cover Vandham's short positions. For at least several thousand such short sales during the relevant period, Vandham failed to locate shares of those stocks that it could borrow. The order further finds that Vandham often published offers on OTC Link's electronic quotation service to sell shares it had purchased from its broker-dealer customers without first obtaining and reviewing required documents and information about the shares' issuers. Also according to the order, Vandham did not implement its policies and procedures so as to reasonably address the risks of its business model, and as a result, Vandham failed to adequately investigate its customers' transactions and failed to file Suspicious Activity Reports for numerous transactions that displayed red flags identified in Vandham's own policies and procedures.
The SEC's order charges Vandham with violating the short-selling provisions of Regulation SHO Rule 203(b)(1), the quotation-publication provisions of Rule 15c2-11 promulgated under the Exchange Act of 1934, and the SAR-filing provisions of Section 17(a) of the Exchange Act and Rule 17a-8 thereunder. Without admitting or denying the SEC's findings, Vandham agreed to be censured, to cease-and-desist from committing or causing violations or future violations of those provisions of the federal securities laws, and to pay a $200,000 civil penalty.
The SEC's investigation was conducted by David Zetlin-Jones, Daphne Downs, and George Stepaniuk, and was supervised by Sanjay Wadhwa of the New York Regional Office. The SEC's examination that led to the investigation was conducted by Hermann Vargas, Michael P. Fioribello, and Steven Vitulano, with assistance from Ilan S. Felix, and was supervised by Robert A. Sollazzo of the New York Regional Office. The SEC appreciates the assistance of FINRA
======================
in the ongoing shell game ..
Broker-Dealer Vandham Securities Joins Wall Street Access
Vandham will operate under the Wall Street Access brand and continue to offer highly personalized, client-focused trading and market-making services across the globe
NEW YORK, July 12, 2018 /PRNewswire/ -- Wall Street Access (WSA), a diversified financial services firm, today announced that Vandham Securities Corp has joined the firm, in a combination that brings together two well-established, privately owned broker-dealers with a commitment to client service, technology and an entrepreneurial culture.
In the transaction, WSA will acquire the assets and client relationships of Vandham, which will continue to operate from its offices in Park Ridge and Marlboro, New Jersey, and Huntington, New York. The combined firm will operate under the Wall Street Access brand.
Independently owned and operated for more than 28 years, Vandham Securities is a leading international market-making brokerage well known as a destination for the institutional investment community.
"We welcome Vandham and its clients to the Wall Street Access family," said Sean Kelleher, President of Wall Street Access. "Vandham is acknowledged as one of the leading market makers in the business, with particular experience in international trading as well as in ADR and overnight conversion markets. Our new partnership will leverage this market leadership with Wall Street Access's relationships and capital base to ensure continued growth and success for the benefit of all our clients."
Chris Catrini of Vandham Securities said: "Our new relationship with Wall Street Access represents a great moment for our clients and our firm. Independently owned and operated for more than 35 years, Wall Street Access brings a strong balance sheet and considerable resources to Vandham clients. They also share our expertise in the high-touch services our clients have come to expect. At both our firms, success comes down to providing the people, the infrastructure and the capital to serve clients of all sizes—both in domestic markets and internationally."
Wall Street Access' continued growth comes on the heels of two major announcements last year. In August 2017, WSA acquired a majority stake in RJL Capital Group, LLC, a prime brokerage and trading services firm headquartered in New York City. In April, WSA's Asset and Wealth Management division acquired Boston-based NU Paradigm, an investment advisory, asset management, and outsourced CIO firm. In addition to its broker-dealer business, Wall Street Access now manages more than $370 million in assets for institutional investors and high net worth families.
"Wall Street Access continues to look for opportunities to work with broker-dealers looking for a strategic partner with a strong balance sheet, robust operational infrastructure, and a well-managed finance and compliance team," Kelleher said.
About Wall Street Access
Wall Street Access combines an independent, entrepreneurial culture with a decades-long commitment to building and operating a diverse set of successful financial services businesses, including global and domestic equity trading, market making, prime brokerage services, and asset management. Wall Street Access makes markets in fixed income, specializing in high-grade corporate bonds, municipal bonds and CDs. They are also a high-touch execution services broker for listed options. WSA clears its trades through BNY Mellon's Pershing LLC, and through ICBC Financial Services LLC, a subsidiary of Industrial and Commercial Bank of China. WSA has the expertise and flexibility to quickly seize emerging opportunities and have successfully evolved through up and down market cycles while always remaining a trusted and reliable partner to their clients.
Wall Street Access is a member of the NYSE, FINRA, ISE, and SIPC. To learn more, please visit www.wsaccess.com.
Contact:
Isaac Benjamin Ibenjamin@prcg.com
Jim Haggerty Jhaggerty@prcg.com
PRCG|Haggerty
(212) 683-8100
SOURCE Wall Street Access
Related Links
www.wsaccess.com
===========================
and yeppers .. VNDM *makes* a market in IPIX .. ;)
https://otce.finra.org/otce/marketStatistics/monthlyShareVolume
today's RT l2 on IPIX
IPIX B/A .. EOD
 GTSM	0.118	12,000	15:55
 NITE	0.114	14,475	14:57
 CSTI	0.114	5,000	13:58
 CFGN	0.112	5,000	08/12
 CDEL	0.111	5,000	15:52
 VNDM	0.11	5,000	09/23
 ETRF	0.10	110,000	15:59
 STXG	0.06	10,000	02/19
 VERT	0.05	10,000	05/21
 PUMA	0.05	10,000	08:10
 MAXM	0.0001	10,000	07:35
 OTCX	U	0	07:45

 ETRF	0.1192	40,000	15:58
 CDEL	0.121	15,000	15:52
 NITE	0.1219	5,000	14:57
 CSTI	0.125	30,000	14:53
 GTSM	0.14	9,900	09:30
 CFGN	0.199	5,000	07/29
 PUMA	0.40	2,500	08:10
 VERT	0.45	2,500	05/17
 VNDM	0.45	2,500	09/23
 OTCX	1.00	100	09:30
 STXG	2.00	100	02/19
 MAXM	8.00	100	07:35
resets r possible
input courtesy of thepennyguru
4kids
IPIX .. 9.19.19
DRS % .. 311038/410404 .. 75.78% .. (73.88% Wednesday)
Hidden trades .. 45960/410404 .. 11.19% .. (.01% Wednesday) .. since 4.26.19
interesting change out
Liquidity .. .055c .. (HOD .18c/LOD .125c)
NR = Just A Few Probs
10 day avg maintained .. not so for the 90 day vol avg
NRs' CONstant wash trades/resets remains blatant
trades .. curious to see if this *pattern* by NR continues on tomorrow and into next week ..
15:47:19 0.1389 5000 OTO .. @ CDEL's UC ask .. note time stamp
14:35:08 0.142 1000 OTO .. hidden (B/13 .. A/15)
14:35:01 0.15 350 OTO .. @ UC ask .. 15k = 350/14650
14:34:38 0.145 1000 OTO .. hidden (B/13 .. A/155)
14:34:08 0.145 1000 OTO .. hidden (B/13 .. A/155)
14:27:09 0.15 14650 OTO .. @ ask
14:27:07 0.15 20000 OTO .. @ relo/d ask
14:23:33 0.144 10000 OTO .. hidden (B/13 .. A/15) .. 60k = 10k/5k/5k/3900/13100/13k/10k
14:06:10 0.144 5000 OTO .. hidden (B/13 .. A/15)
14:04:41 0.144 5000 OTO .. hidden (B/13 .. A/15)
13:31:27 0.1405 3900 OTO .. hidden (B/13 .. A/145)
13:31:10 0.145 13100 OTO .. @ relo/d ask
13:31:10 0.14 13000 OTO .. @ relo/d ask .. relo/s ask .. 23k = 13k/10k
13:30:46 0.1399 10000 OTO .. @ ask .. relo/s ask
13:17:27 0.133 5800 OTO .. @ bid .. 30k = 24200/5800
13:17:18 0.133 24200 OTO .. @ relo/d bid
12:43:39 0.1399 10000 OTO .. @ UC ask .. 30k = 10k/20k
12:29:18 0.135 20000 OTO .. @ jumped bid
12:25:29 0.18 5005 OTO .. @ relo/d ask .. 25k = 5005/10k/9995 .. HOD
12:25:29 0.16 10000 OTO .. @ relo/d ask .. relo/s ask
12:25:29 0.144 9995 OTO .. @ relo/d ask .. relo/s ask
12:25:19 0.135 14000 OTO .. @ ask .. 25k = 14k/11k .. relo/s ask
12:25:13 0.135 11000 OTO .. @ ask
12:18:41 0.13 5000 OTO .. @ bid .. 15k = 5k/10k
12:18:36 0.13 10000 OTO .. @ relo/d bid
12:18:11 0.1301 536 OTO .. hidden .. 25k = 536/24464 .. (B/13 .. A/135)
12:18:09 0.1301 24464 OTO .. @ bid
12:18:07 0.1301 10536 OTO .. @ bid .. 20k = 10536/9464
12:11:54 0.1301 9464 OTO .. @ bid
12:11:54 0.1301 2536 OTO .. @ relo/d bid ..
12:10:06 0.135 6000 OTO .. @ UC ask .. 6k = 2k/4k
11:41:55 0.135 10000 OTO .. @ ask .. 11k = 10k/1k
11:40:22 0.135 1000 OTO .. @ UC ask .. note PPS is prior bid's PPS
11:36:00 0.135 12500 OTO .. @ bid
11:22:35 0.135 10300 OTO .. @ bid .. 11k = 10300/700
11:22:34 0.135 700 OTO .. @ relo/d bid
11:22:34 0.14 5000 OTO .. @ bid .. 11k = 5k/2k/4k
11:21:49 0.14 2000 OTO .. @ bid
11:20:47 0.14 4000 OTO .. @ bid
11:20:46 0.1416 15000 OTO .. hidden (B/14 .. A/144) .. 15k = 10k/5k
10:53:47 0.14 3000 OTO .. @ jumped bid .. 3k = 1500/1500
10:52:37 0.14 25000 OTO .. @ relo/d ask .. 25k = 10k/10k/5k .. ask relo/s to 144c
10:52:18 0.1395 3524 OTO .. hidden (B/128 .. A/14)
10:49:38 0.135 1069 OTO .. @ bid
10:49:29 0.135 1500 OTO .. @ relo/d bid .. see 10:45:47
10:49:22 0.133 7500 OTO .. @ jumped bid .. see 10:03:50
10:45:47 0.133 1500 OTO .. @ ask .. relo/s ask to 14c
10:42:47 0.133 5000 OTO .. @ ask .. 25k = 5k/10k/2500/7500
10:42:47 0.133 10000 OTO .. @ ask
10:03:50 0.133 2500 OTO .. @ ask .. 10k = 2500/7500
10:03:50 0.133 7500 OTO .. @ ask
09:30:02 0.125 275 OTO .. @ bid .. LOD
Detailed Quote:IPIX
INNOVATION PHARMACEUTICALS INC
0.1389Up 0.0064 (4.83 %)AS OF 3:47:19PM ET 09/19/2019
Last Trade 0.1389
Trade Time 3:47:19pm ET
Change 0.0064
% Change 4.83%
Bid 0.13
Bid Size 72765
Ask 0.1389
Ask Size 29200
Open 0.125
Day High 0.18
Day Low 0.125
Previous Close
09/18/2019 0.1325
52-Week High
05/08/2019 0.4351
52-Week Low
12/31/2018 0.07
Price Performance (Last 52 Weeks)
09/18/2019 -43.13%
Volume 410,404
Volume (10 day Average) 302,189
Volume (90 day Average) 451,849
Market Capitalization $27.37M
Shares Outstanding 206,529,000
B/A .. volume 410404
GTSM 0.13 33,565 15:55
ETRF 0.13 24,200 14:27
CDEL 0.13 15,000 15:58
NITE 0.125 5,000 13:17
CSTI 0.12 15,000 12:18
CFGN 0.112 5,000 08/12
VNDM 0.11 5,000 09/18
STXG 0.06 10,000 02/19
VERT 0.05 10,000 05/21
PUMA 0.05 10,000 08:10
MAXM 0.0001 10,000 07:56
OTCX U 0 07:45
CDEL 0.1389 29,200 15:58
ETRF 0.145 50,000 15:26
CSTI 0.17 10,000 12:36
CFGN 0.199 5,000 07/29
NITE 0.20 10,000 11:24
MAXM 0.3899 2,500 13:17
PUMA 0.40 2,500 08:10
VERT 0.45 2,500 05/17
VNDM 0.45 2,500 09/18
GTSM 0.499 5,000 14:27
OTCX 1.00 100 09:30
STXG 2.00 100 02/19
i will reiterate .. the last *reality* an UPSIDE DOWN Non Retail *entity or two or three*
want .. is this data *digested* .. in other words .. educated retail investors aren't required .. it's all about NR
being able to shake out .. on their terms and timing .. (in other words .. controlling outcomes)
Daily Reg Sho %s for IPIX MAY 2019
      May 31 NA NA NA 441,354 291,500 66.05% **** pattern change out on par with March 2019
      May 30 NA NA NA 572,479 228,123 39.85%
      May 29 NA NA NA 251,394 91,766 36.50%
      May 28 NA NA NA 451,622 136,557 30.24%
      May 24 NA NA NA 463,032 135,101 29.18% .. below 30%
      May 23 NA NA NA 670,784 273,558 40.78%
      May 22 NA NA NA 806,712 458,959 56.89%
      May 21 NA NA NA 383,832 221,372 57.67%
      May 20 NA NA NA 611,596 171,455 28.03% .. below 30%
      May 17 NA NA NA 2,644,134 974,430 36.85%
      May 16 NA NA NA 4,413,783 2,423,096 54.90% .. record volume (last seen in Aug 2015 & Dec 2014)
      May 15 NA NA NA 237,776 131,535 55.32%
      May 14 NA NA NA 880,776 285,052 32.36%
      May 13 NA NA NA 668,718 140,210 20.97% .. below 30%
      May 10 NA NA NA 2,377,716 709,931 29.86% .. below 30%
      May 09 NA NA NA 863,112 349,682 40.51%
      May 08 NA NA NA 2,306,040 639,986 27.75% .. below 30%
      May 07 NA NA NA 2,513,988 1,381,260 54.94%
      May 06 NA NA NA 760,633 566,203 74.44% .. NRs' *set up* to negate 5.16.16 8K underway
      May 03 NA NA NA 403,294 131,058 32.50% ** NRs' test ends @ 11:04AM
      May 02 NA NA NA 100,904 30,600 30.33% *** pattern change out .. NRs' take up/set up
      May 01 NA NA NA 396,482 268,325 67.68%
IPIX Historical September 10, 2018 - December 31, 2018
         12/31/2018	0.08	0.10	0.07	0.0954	631,343
         12/28/2018	0.083	0.109	0.083	0.1036	531,169
         12/27/2018	0.082	0.09	0.081	0.0876	468,153
         12/26/2018	0.08	0.095	0.08	0.09	346,379
         12/24/2018	0.095	0.095	0.08	0.08	372,923
         12/21/2018	0.099	0.105	0.075	0.095	844,903
         12/20/2018	0.11	0.11	0.0961	0.097	806,466
         12/19/2018	0.12	0.12	0.103	0.11	1,060,552
         12/18/2018	0.12	0.14	0.1101	0.1153	830,184
         12/17/2018	0.17	0.17	0.125	0.1293	768,696
         12/14/2018	0.123	0.16	0.115	0.145	414,408
         12/13/2018	0.155	0.155	0.116	0.1202	459,830
         12/12/2018	0.125	0.13	0.1152	0.127	523,824
         12/11/2018	0.14	0.16	0.125	0.1399	849,983
         12/10/2018	0.1299	0.16	0.1299	0.16	226,349
         12/07/2018	0.123	0.135	0.11	0.133	295,802
         12/06/2018	0.1245	0.1412	0.122	0.13	321,739
         12/04/2018	0.12	0.1369	0.12	0.1231	420,537
         12/03/2018	0.13	0.14	0.121	0.1343	345,949
         11/30/2018	0.1375	0.1375	0.128	0.135	497,326
         11/29/2018	0.1301	0.15	0.125	0.1327	1,379,661
         11/28/2018	0.1325	0.15	0.1288	0.133	875,275
         11/27/2018	0.125	0.1325	0.1101	0.132	475,115
         11/26/2018	0.17	0.17	0.12	0.126	485,796
         11/23/2018	0.1135	0.149	0.1135	0.14	884,102
         11/21/2018	0.108	0.115	0.103	0.11	462,656
         11/20/2018	0.108	0.115	0.1025	0.11	392,564
         11/19/2018	0.122	0.132	0.105	0.11	1,058,420
         11/16/2018	0.1369	0.1369	0.113	0.122	493,784
         11/15/2018	0.125	0.137	0.115	0.137	687,206
         11/14/2018	0.14	0.14	0.125	0.128	286,871
         11/13/2018	0.17	0.17	0.1335	0.14	274,668
         11/12/2018	0.155	0.155	0.135	0.14	690,455
         11/09/2018	0.16	0.175	0.145	0.152	486,370
         11/08/2018	0.14	0.175	0.137	0.1645	1,470,273
         11/07/2018	0.1661	0.172	0.14	0.15	811,782
         11/06/2018	0.18	0.185	0.159	0.1679	463,864
         11/05/2018	0.19	0.21	0.17	0.185	1,033,642
         11/02/2018	0.13	0.189	0.128	0.187	1,372,537
         11/01/2018	0.135	0.14	0.125	0.13	634,420
         10/31/2018	0.135	0.135	0.127	0.133	386,639
         10/30/2018	0.13	0.14	0.1254	0.132	337,278
         10/29/2018	0.134	0.144	0.13	0.135	1,114,409
         10/26/2018	0.138	0.14	0.123	0.136	876,765
         10/25/2018	0.1415	0.15	0.131	0.1374	619,964
         10/24/2018	0.138	0.148	0.128	0.148	847,006
         10/23/2018	0.138	0.14	0.122	0.137	774,467
         10/22/2018	0.18	0.18	0.125	0.132	951,411
         10/19/2018	0.1635	0.164	0.12	0.1462	1,869,230
         10/18/2018	0.1779	0.1779	0.1534	0.164	788,072
         10/17/2018	0.18	0.18	0.165	0.1779	446,377
         10/16/2018	0.19	0.2	0.177	0.18	875,248
         10/15/2018	0.20	0.24	0.18	0.1856	660,059
         10/12/2018	0.19	0.205	0.177	0.2	713,829
         10/11/2018	0.16	0.1896	0.159	0.1896	1,575,415
         10/10/2018	0.1991	0.2	0.16	0.1626	1,547,811
         10/09/2018	0.238	0.27	0.175	0.1841	2,131,163
         10/08/2018	0.24	0.2499	0.22	0.238	205,005
         10/05/2018	0.253	0.305	0.233	0.24	287,390
         10/04/2018	0.29	0.29	0.24	0.253	200,849
         10/03/2018	0.25	0.295	0.24	0.28	285,431
         10/02/2018	0.1975	0.256	0.19	0.25	285,150
         10/01/2018	0.21	0.21	0.18	0.1957	715,877
         09/28/2018	0.264	0.264	0.1895	0.202	1,420,473
         09/27/2018	0.27	0.273	0.242	0.2649	737,406
         09/26/2018	0.308	0.308	0.26	0.2782	361,590
         09/25/2018	0.2965	0.3136	0.27	0.2993	302,231
         09/24/2018	0.299	0.31	0.28	0.2955	236,198
         09/21/2018	0.299	0.299	0.272	0.299	250,475
         09/20/2018	0.2486	0.33	0.2358	0.299	924,370
         09/19/2018	0.233	0.25	0.21	0.2486	1,015,394
         09/18/2018	0.263	0.269	0.208	0.233	886,593
         09/17/2018	0.285	0.293	0.251	0.27	533,946
         09/14/2018	0.29	0.295	0.262	0.29	753,114
         09/13/2018	0.339	0.346	0.2271	0.29	1,109,738
         09/12/2018	0.40	0.4	0.3	0.33	1,016,307 .. NRs' bogus volume injection underway
         09/11/2018	0.425	0.47	0.425	0.452	86,434 .. 10K Filed AH's
         09/10/2018	0.38	0.5303	0.38	0.435	139,753
4kids
IPIX .. 9.18.19
DRS % .. 195128/264090 .. 73.88% .. (62.93% Tuesday)
Hidden trades .. 3000/264090 .. .01% .. (30.99% Tuesday) .. since 4.26.19
interesting change out
Liquidity .. .0099c .. (HOD .1349c/LOD .125c)
NR = Just A Few Probs
neither 10 day or 90 day vol avg *maintained*
NRs' CONstant wash trades/resets remains blatant .. as is shown yet again via today's tape
note today's first 4 trades = 100000 (90/10) .. interesting alignment to EOD trades last Friday and EOD trades yesterday ..
hmmmm
trades .. every IPIX trade today @ *bid* with the exception of 4 .. 2 @ ask .. 2 hidden
15:57:07 0.1325 5000 OTO .. @ bid
15:56:51 0.1325 5000 OTO .. @ relo/d bid
15:42:26 0.134 12500 OTO .. @ bid .. 20k = 12500/7500 or 4sets of 5k/s
15:41:59 0.134 7500 OTO .. @ bid
15:41:49 0.134 1500 OTO .. @ jumped bid
15:41:42 0.1349 1000 OTO .. @ ask
15:28:42 0.125 31488 OTO .. @ bid .. 45k = 31488/13512
15:28:36 0.125 13512 OTO .. @ bid
15:25:46 0.125 45000 OTO .. @ relo/d bid .. 90k = 45k/13512/31488 .. 100k = 45k/13512/31488/5k x2
14:36:46 0.1275 13000 OTO .. @ jumped bid
14:36:45 0.13 2000 OTO .. hidden (B/1275 .. A/1325)
12:02:53 0.1349 300 OTO .. @ ask
12:00:46 0.125 2310 OTO .. @ relo/d bid
12:00:41 0.12896 1000 OTO .. hidden (B/125 .. A/1349)
11:45:21 0.13 5000 OTO .. @ bid
11:45:07 0.13 7000 OTO .. @ bid
11:45:06 0.13 500 OTO .. @ bid
10:47:23 0.13 5000 OTO .. @ bid
10:46:11 0.13 5000 OTO .. @ bid
10:18:37 0.13 480 OTO .. @ bid
09:57:03 0.13 65000 OTO .. @ bid .. 100k = 65k/172/24828/10k
09:56:21 0.13 172 OTO .. @ bid
09:56:21 0.13 24828 OTO .. @ bid
09:54:53 0.13 10000 OTO .. @ bid
Detailed Quote:IPIX
INNOVATION PHARMACEUTICALS INC
0.1325Down -0.0024 (-1.78 %)AS OF 3:57:07PM ET 09/18/2019
Last Trade 0.1325
Trade Time 3:57:07pm ET
Change -0.0024
% Change -1.78%
Bid 0.125
Bid Size 64992
Ask 0.1349
Ask Size 5000
Open 0.13
Day High 0.1349 .. .0099c *liquidity*
Day Low 0.125
Previous Close
09/17/2019 0.1349
52-Week High
05/08/2019 0.4351
52-Week Low
12/31/2018 0.07
Price Performance (Last 52 Weeks)
09/17/2019 -50.04%
Volume 264,090
Volume (10 day Average) 298,197
Volume (90 day Average) 475,334
Market Capitalization $27.86M
Shares Outstanding 206,529,000
B/A .. volume 246090
NITE 0.125 34,892 15:57
CSTI 0.125 30,100 15:28
ETRF 0.12 10,000 15:42
GTSM 0.12 10,000 15:52
VNDM 0.11 5,000 09/17
CDEL 0.10 150,000 15:57
STXG 0.06 10,000 02/19
VERT 0.05 10,000 05/21
PUMA 0.05 10,000 08:10
MAXM 0.0001 10,000 07:45
cCFGN 0.112 5,000 08/12
OTCX U 0 07:45
CSTI 0.1349 5,000 08:30
CDEL 0.14 7,500 15:57
ETRF 0.16 20,000 15:42
NITE 0.20 10,000 09:30
MAXM 0.3849 2,500 15:43
PUMA 0.40 2,500 08:10
VERT 0.45 2,500 05/17
VNDM 0.45 2,500 09/17
GTSM 0.499 6,500 13:28
OTCX 1.00 100 09:30
STXG 2.00 100 02/19
cCFGN 0.199 5,000 07/29
i will reiterate .. the last *reality* an UPSIDE DOWN Non Retail *entity or two or three*
want .. is this data *digested* .. in other words .. educated retail investors aren't required .. it's all about NR
being able to shake out .. on their terms and timing .. (in other words .. controlling outcomes)
Daily Reg Sho %s for IPIX MAY 2019
      May 31 NA NA NA 441,354 291,500 66.05% **** pattern change out on par with March 2019
      May 30 NA NA NA 572,479 228,123 39.85%
      May 29 NA NA NA 251,394 91,766 36.50%
      May 28 NA NA NA 451,622 136,557 30.24%
      May 24 NA NA NA 463,032 135,101 29.18% .. below 30%
      May 23 NA NA NA 670,784 273,558 40.78%
      May 22 NA NA NA 806,712 458,959 56.89%
      May 21 NA NA NA 383,832 221,372 57.67%
      May 20 NA NA NA 611,596 171,455 28.03% .. below 30%
      May 17 NA NA NA 2,644,134 974,430 36.85%
      May 16 NA NA NA 4,413,783 2,423,096 54.90% .. record volume (last seen in Aug 2015 & Dec 2014)
      May 15 NA NA NA 237,776 131,535 55.32%
      May 14 NA NA NA 880,776 285,052 32.36%
      May 13 NA NA NA 668,718 140,210 20.97% .. below 30%
      May 10 NA NA NA 2,377,716 709,931 29.86% .. below 30%
      May 09 NA NA NA 863,112 349,682 40.51%
      May 08 NA NA NA 2,306,040 639,986 27.75% .. below 30%
      May 07 NA NA NA 2,513,988 1,381,260 54.94%
      May 06 NA NA NA 760,633 566,203 74.44% .. NRs' *set up* to negate 5.16.16 8K underway
      May 03 NA NA NA 403,294 131,058 32.50% ** NRs' test ends @ 11:04AM
      May 02 NA NA NA 100,904 30,600 30.33% *** pattern change out .. NRs' take up/set up
      May 01 NA NA NA 396,482 268,325 67.68%
IPIX Historical September 10, 2018 - December 31, 2018
         12/31/2018	0.08	0.10	0.07	0.0954	631,343
         12/28/2018	0.083	0.109	0.083	0.1036	531,169
         12/27/2018	0.082	0.09	0.081	0.0876	468,153
         12/26/2018	0.08	0.095	0.08	0.09	346,379
         12/24/2018	0.095	0.095	0.08	0.08	372,923
         12/21/2018	0.099	0.105	0.075	0.095	844,903
         12/20/2018	0.11	0.11	0.0961	0.097	806,466
         12/19/2018	0.12	0.12	0.103	0.11	1,060,552
         12/18/2018	0.12	0.14	0.1101	0.1153	830,184
         12/17/2018	0.17	0.17	0.125	0.1293	768,696
         12/14/2018	0.123	0.16	0.115	0.145	414,408
         12/13/2018	0.155	0.155	0.116	0.1202	459,830
         12/12/2018	0.125	0.13	0.1152	0.127	523,824
         12/11/2018	0.14	0.16	0.125	0.1399	849,983
         12/10/2018	0.1299	0.16	0.1299	0.16	226,349
         12/07/2018	0.123	0.135	0.11	0.133	295,802
         12/06/2018	0.1245	0.1412	0.122	0.13	321,739
         12/04/2018	0.12	0.1369	0.12	0.1231	420,537
         12/03/2018	0.13	0.14	0.121	0.1343	345,949
         11/30/2018	0.1375	0.1375	0.128	0.135	497,326
         11/29/2018	0.1301	0.15	0.125	0.1327	1,379,661
         11/28/2018	0.1325	0.15	0.1288	0.133	875,275
         11/27/2018	0.125	0.1325	0.1101	0.132	475,115
         11/26/2018	0.17	0.17	0.12	0.126	485,796
         11/23/2018	0.1135	0.149	0.1135	0.14	884,102
         11/21/2018	0.108	0.115	0.103	0.11	462,656
         11/20/2018	0.108	0.115	0.1025	0.11	392,564
         11/19/2018	0.122	0.132	0.105	0.11	1,058,420
         11/16/2018	0.1369	0.1369	0.113	0.122	493,784
         11/15/2018	0.125	0.137	0.115	0.137	687,206
         11/14/2018	0.14	0.14	0.125	0.128	286,871
         11/13/2018	0.17	0.17	0.1335	0.14	274,668
         11/12/2018	0.155	0.155	0.135	0.14	690,455
         11/09/2018	0.16	0.175	0.145	0.152	486,370
         11/08/2018	0.14	0.175	0.137	0.1645	1,470,273
         11/07/2018	0.1661	0.172	0.14	0.15	811,782
         11/06/2018	0.18	0.185	0.159	0.1679	463,864
         11/05/2018	0.19	0.21	0.17	0.185	1,033,642
         11/02/2018	0.13	0.189	0.128	0.187	1,372,537
         11/01/2018	0.135	0.14	0.125	0.13	634,420
         10/31/2018	0.135	0.135	0.127	0.133	386,639
         10/30/2018	0.13	0.14	0.1254	0.132	337,278
         10/29/2018	0.134	0.144	0.13	0.135	1,114,409
         10/26/2018	0.138	0.14	0.123	0.136	876,765
         10/25/2018	0.1415	0.15	0.131	0.1374	619,964
         10/24/2018	0.138	0.148	0.128	0.148	847,006
         10/23/2018	0.138	0.14	0.122	0.137	774,467
         10/22/2018	0.18	0.18	0.125	0.132	951,411
         10/19/2018	0.1635	0.164	0.12	0.1462	1,869,230
         10/18/2018	0.1779	0.1779	0.1534	0.164	788,072
         10/17/2018	0.18	0.18	0.165	0.1779	446,377
         10/16/2018	0.19	0.2	0.177	0.18	875,248
         10/15/2018	0.20	0.24	0.18	0.1856	660,059
         10/12/2018	0.19	0.205	0.177	0.2	713,829
         10/11/2018	0.16	0.1896	0.159	0.1896	1,575,415
         10/10/2018	0.1991	0.2	0.16	0.1626	1,547,811
         10/09/2018	0.238	0.27	0.175	0.1841	2,131,163
         10/08/2018	0.24	0.2499	0.22	0.238	205,005
         10/05/2018	0.253	0.305	0.233	0.24	287,390
         10/04/2018	0.29	0.29	0.24	0.253	200,849
         10/03/2018	0.25	0.295	0.24	0.28	285,431
         10/02/2018	0.1975	0.256	0.19	0.25	285,150
         10/01/2018	0.21	0.21	0.18	0.1957	715,877
         09/28/2018	0.264	0.264	0.1895	0.202	1,420,473
         09/27/2018	0.27	0.273	0.242	0.2649	737,406
         09/26/2018	0.308	0.308	0.26	0.2782	361,590
         09/25/2018	0.2965	0.3136	0.27	0.2993	302,231
         09/24/2018	0.299	0.31	0.28	0.2955	236,198
         09/21/2018	0.299	0.299	0.272	0.299	250,475
         09/20/2018	0.2486	0.33	0.2358	0.299	924,370
         09/19/2018	0.233	0.25	0.21	0.2486	1,015,394
         09/18/2018	0.263	0.269	0.208	0.233	886,593
         09/17/2018	0.285	0.293	0.251	0.27	533,946
         09/14/2018	0.29	0.295	0.262	0.29	753,114
         09/13/2018	0.339	0.346	0.2271	0.29	1,109,738
         09/12/2018	0.40	0.4	0.3	0.33	1,016,307 .. NRs' bogus volume injection underway
         09/11/2018	0.425	0.47	0.425	0.452	86,434 .. 10K Filed AH's
         09/10/2018	0.38	0.5303	0.38	0.435	139,753
4kids
|
Followers
|
261
|
Posters
|
|
|
Posts (Today)
|
0
|
Posts (Total)
|
20257
|
|
Created
|
07/20/10
|
Type
|
Premium
|
| Moderator fourkids_9pets | |||
| Assistants XenaLives SevenTenEleven ThePennyGuru dehydratedman | |||
This is a non stock specific board.
Topics to include NSS ~ counterfeiting stock and the
tactics MM's employ specifically relating to the OTC.
board basics
http://investorshub.advfn.com/boards/read_msg.aspx?message_id=52613887
reg sho >> short sale data for OTC
http://regsho.finra.org/regsho-Index.html
for big board co.s one has to *collate* reg sho reported from each link listed
http://www.sec.gov/answers/shortsalevolume.htm
sites worth bookmarking
http://www.counterfeitingstock.com/
http://siriusnews.com/blog/
http://www.investorprotectioncoalition.org/
https://writerep.house.gov/writerep/welcome.shtml
http://pennyheaven.com/pink-sheets/pink-sheets-volume
http://www.transparency.org/about_us
http://www.senate.gov/general/contact_information/senators_cfm.cfm
http://globaleconomicwarfare.com/category/the-suspects/
http://failstodeliver.com/default.aspx
http://www.dtcc.com/legal/imp_notices/
http://regsho.finra.org/regsho-Index.html
http://taft.law.uc.edu/CCL/xyz/sldtoc.html
http://www.sec.gov/answers/shortsalevolume.htm
http://www.otcbb.com/asp/OTCE_Short_Interest.asp
http://www.brokerage101.com/ssettle.html
http://www.sec-oig.gov/reports/AuditsInspections/2009/450.pdf
http://www.amex.com/amextrader/tradingData/amexShortInt/AmexShortInterest.jsp
http://www.finra.org/Industry/Compliance/MarketTransparency/TRF/RegulationSHO/
http://documents.theblackvault.com/documents/foia/SEC2009.pdf
http://www.securitiestechnologymonitor.com/photo_gallery/1_4/26567-1.html
FINRA CONTACT INFO
Submit a Tip
whistleblower@finra.org
1-866-96-FINRA (1-866-963-4672)
Office of the Whistleblower
Dedicated Team to Handle High-Risk Tips
FINRA's Office of the Whistleblower expedites the review of high-risk tips by FINRA senior staff and ensures a rapid response for tips believed to have merit.
Through the Office of the Whistleblower, individuals with evidence of, or material information about, potentially illegal or unethical activity can reach senior staff, who can quickly assess the level of risk involved and make sure that each tip is properly evaluated. Those tips warranting additional review and investigation will be subject to an expedited regulatory response.
FINRA will refer any whistleblower tips that fall outside its jurisdictional reach to the appropriate regulatory or law enforcement agencies.
FINRA's whistleblower initiative does not replace longstanding processes for handling thousands of routine regulatory tips and customer complaints each year.
14 page read from 2008 ~ THE NAKED TRUTH
http://www.csb.uncw.edu/people/moffettc/Research%20Papers/IIJ-JOT-BROOKS.pdf
Listed below are a large number of public information articles and reports detailing the brokerage houses, marketmakers and the conduct of the main "street" characters engaged in the illegal practice of "naked short selling", "death-spiral financing", "failure to delivers (FTDs)" and/or stock fraud.
http://www.rgm.com/shortselling.html
Hour interview well worth listening to to understand the *collusion* being done against legit companies by specific entities
http://www.netcastdaily.com/broadcast/fsn2008-0531-3b.mp3
INVESTOR PROTECTION -- (Senate - July 28, 2009)
[Page: S8183] GPO's PDF
--- Mr. KAUFMAN. Madam President, all Americans hope that the ``green shoots'' we have been seeing recently--evidence of the economy turning around--won't wither. One thing that will help make our recovery strong and sustainable is the return of investor confidence. That is why making certain our financial markets operate fairly and openly is so important.
Free and fair markets and democracy are America's two greatest pillars of strength. Our financial markets have long been the engine of American growth and the envy of the world. Efficient and free capital markets are essential to all of what makes America great: investment in private enterprise, the availability of capital to expand and grow our economy through innovation and new ideas, and the ability to save for retirement in hopes that investment will result in comfort for our later years. But we have seen what happens when you take the referees off the field, when we fail to have clear and fair rules for everyone. It is the job of our democratic government to set those rules and to keep the referees--our financial regulators--on the field.
I rise today because we continue to see that our financial markets simply do not operate on a level playing field for all investors. That is a threat to the credibility of our financial markets and, as a result, to our country's economic well-being.
We have an unfair playing field that leaves us with, in effect, two markets: one for powerful insiders and another for average investors; one market for huge volume, high-speed players who can take advantage of every loophole for profit, and another market for retail investors who must play by the rules and whose orders are filled without any special priority. This situation simply cannot continue. It is the national equivalent of ``separate and unequal.''
[Page: S8184] GPO's PDF I offer my colleagues three examples of this two-tier system which undermines the fairness and efficiency of our financial markets. First, today the biggest players on Wall Street are using their automated, high-speed trading programs to engage in short selling of stocks. Informed observers believe organized ``bear raids''--short selling combined with coordinated ``misinformation'' campaigns--contributed to the demise of Lehman Brothers and Bear Stearns, key elements in the collapse of our financial markets last year. With the repeal of the uptick rule in 2007 and no substantial substitute in its place, the threat of such damaging manipulation is still with us.
Since March 3, I have spoken frequently about the urgent need for the SEC to restore the substance of the uptick rule. This rule required investors simply to pause and to wait for an uptick in price before continuing to short sell. Without such a rule in place, investors who own those stocks are more vulnerable to hedge fund bear raiders.
So far, the SEC has initiated rulemaking and conducted on April 8 a roundtable discussion among key experts on some kind of price test that could substantially replace the uptick rule in today's high-speed, high-tech markets. While that process has begun, we have yet to see it bear fruit.
Second, big market players can engage in naked short selling--selling stock for which they have no legal claim and for which they cannot deliver. Since my first speech on this subject in March, I have come to the floor several times and coauthored letters with my colleagues about the need for the SEC to end naked short selling. In that abusive practice, traders bet on shares losing value--shares they have not borrowed and in some cases never even intend to borrow--in time for settlement.
Yesterday, the SEC made permanent a temporary rule they had enacted last fall and proposed some new transparency measures, and the Commission announced plans for a roundtable discussion on September 30--2 months from now. The Commission will finally begin to discuss publicly the potential solutions that a bipartisan group of Senators and I have been urging: either a pre-borrow requirement or a centralized ``hard locate'' system. The Depository Trust and Clearing Corporation tells us it has the capacity and the willingness to implement that system but only if the SEC requires it through a rule.
That is some progress, but we need more urgency at the SEC to implement tougher rules that will stop naked short selling through an enforceable system. This is imperative, because the current ``reasonable belief'' standard is virtually unenforceable, even against those who engage in concerted action to manipulate prices downward.
Yesterday's announcement by the SEC admits that the rule they made permanent yesterday has only reduced fails to deliver by 57 percent. That leaves a lot of room for improvement. Why not have an enforceable system such as that proposed last week by seven Senators of both parties that could end naked short selling once and for all? I am hopeful we will soon see movement on this.
Third, we have the most recent revelation of so-called ``flash orders'' by high frequency traders. These allow exchange members who pay a fee to get a first look at share order flows before the general public. By viewing this buy and sell order information for milliseconds before it goes in the wider market, these investors gain an unfair advantage over the rest. Today I join Senator Schumer in urging the SEC to prohibit the use of these flash orders used in connection with optional display periods currently permitted by DirectEdge, Bats Exchange, and NASDAQ.
As the New York Stock Exchange complained to the SEC on May 28, selling flash orders for free provides:
Non-public order information to a select class of market participants at the expense of a free and open market system.
To use a baseball metaphor, flash orders allow some batters to pay to see the catcher's signals to the pitcher while the rest of us don't see them. We have to make an informed judgment with a normal amount of risk. Markets that permit a privileged few to have special access to information cannot maintain their credibility.
I ask: Is this what is happening on Wall Street today? When millions of Americans have lost so much money in the stock market, do Wall Street actors continue to make record trading profits by exploiting loopholes using high-speed computers?
William Donaldson, former chairman of the SEC and the New York Stock Exchange, has said:
This is where all the money is getting made ..... If an individual investor doesn't have the means to keep up, they're at a huge disadvantage.
As Senator Schumer wrote in his letter:
If allowed to continue, these practices will undermine the confidence of orderly investors and drive them away from our capital markets.
America simply cannot afford this loss of integrity of its financial markets.
Amazingly, it is a loophole in current regulations that allows this unfair practice. This can and should be fixed immediately.
Flash orders, the uptick rule, and naked short selling are not just a list of complaints. I believe they are interconnected. They are interconnected by an unsupported faith in the religion of self-regulation and liquidity. That religion believes that no price is too high for deeper liquidity--maximizing the volume and frequency of a transaction--because it reveals the greatest amount of information about stock values. There is one more article of faith--that innovation by market players is always beneficial.
When the financial markets were decimalized and the uptick rule repealed, the SEC and leading market institutions claimed that the technology would lead to deeper liquidity and market efficiencies benefiting all investors. High-speed trading, sophisticated algorithms, and high volume short selling all have grown exponentially in recent years.
MIT, our Nation's greatest engineering school, sent 11 percent of its 2008 graduates to work on Wall Street. All this, some say, has led to deeper liquidity.
America was founded with a spirit of entrepreneurship and a celebration of economic innovation. There are so many things Wall Street does right, and historically Wall Street was built on a foundation of trust and credibility. But
America was also born from the principle of equal opportunity. While we should keep encouraging the kind of commercial ingenuity that fuels the prosperity of financial markets, we must ensure that technology is not employed to advantage one small group over the rest. That is not what free market is about.
Indeed, there is a place in our markets for high-speed arbitrage functions, because they can and have narrowed bid-ask spreads and lowered the cost of trading for all. High-speed arbitrage also helps price discovery and keeps the prices of similar assets traded in different markets more closely aligned.
When it comes to flash orders, however, I think most investors, even those who trade regularly, are waking up very surprised to learn that these practices are even permitted, just as we were surprised last year to learn about the rampant extent of naked short selling. Many investors have been suspicious for years that insiders on Wall Street hold built-in advantages over average investors. Flash orders are a classic example of being taken aback not by what is illegal but by what is legally occurring directly under the nose of our financial regulators and leading market institutions.
Since I began speaking out against naked short selling, I have heard from some of the biggest companies in America that are concerned about the effects of naked short selling. But they do not want to speak out because they fear that any hint of vulnerability they admit even privately to public officials will leak out and make them the target of these predatory raiders.
I have also heard from investors around the country. They have complained that large broker-dealers are somehow permitted to trade ahead of most investors. These average and even sophisticated investors relate that in their experience they never seem to be able to execute trades at the best available published bid or asking price. They complain that large orders always seem to get a priority over their smaller orders. Until now, I never knew what to make of these claims.
[Page:
S8185] GPO's PDF In the New York Times this past Friday, on investor blogs for weeks now, and in a comment letter filed by the New York Stock Exchange on May 28, commentators have begun to explain how flash orders work to, quite literally, ``pick the pockets'' of the average investor. In essence, these traders get a very quick look at all pending orders in advance and through technology can trade ahead of these orders.
I ask unanimous consent that the Times article be printed in the Record.
There being no objection, the material was ordered to be printed in the Record, as follows:
[From the New York Times, July 24, 2009]
Stock Traders Find Speed Pays, in Milliseconds
(By Charles Duhigg)
It is the hot new thing on Wall Street, a way for a handful of traders to master the stock market, peek at investors' orders and, critics say, even subtly manipulate share prices.
It is called high-frequency trading--and it is suddenly one of the most talked-about and mysterious forces in the markets.
Powerful computers, some housed right next to the machines that drive marketplaces like the New York Stock Exchange, enable high-frequency traders to transmit millions of orders at lightning speed and, their detractors contend, reap billions at everyone else's expense.
These systems are so fast they can outsmart or outrun other investors, humans and computers alike. And after growing in the shadows for years, they are generating lots of talk.
Nearly everyone on Wall Street is wondering how hedge funds and large banks like Goldman Sachs are making so much money so soon after the financial system nearly collapsed. High-frequency trading is one answer.
And when a former Goldman Sachs programmer was accused this month of stealing secret computer codes--software that a federal prosecutor said could ``manipulate markets in unfair ways''--it only added to the mystery. Goldman acknowledges that it profits from high-frequency trading, but disputes that it has an unfair advantage.
Yet high-frequency specialists clearly have an edge over typical traders, let alone ordinary investors. The Securities and Exchange Commission says it is examining certain aspects of the strategy.
``This is where all the money is getting made,'' said William H. Donaldson, former chairman and chief executive of the New York Stock Exchange and today an adviser to a big hedge fund. ``If an individual investor doesn't have the means to keep up, they're at a huge disadvantage.''
For most of Wall Street's history, stock trading was fairly straightforward: buyers and sellers gathered on exchange floors and dickered until they struck a deal. Then, in 1998, the Securities and Exchange Commission authorized electronic exchanges to compete with marketplaces like the New York Stock Exchange. The intent was to open markets to anyone with a desktop computer and a fresh idea.
But as new marketplaces have emerged, PCs have been unable to compete with Wall Street's computers. Powerful algorithms--``algos,'' in industry parlance--execute millions of orders a second and scan dozens of public and private marketplaces simultaneously. They can spot trends before other investors can blink, changing orders and strategies within milliseconds.
High-frequency traders often confound other investors by issuing and then canceling orders almost simultaneously. Loopholes in market rules give high-speed investors an early glance at how others are trading. And their computers can essentially bully slower investors into giving up profits--and then disappear before anyone even knows they were there.
High-frequency traders also benefit from competition among the various exchanges, which pay small fees that are often collected by the biggest and most active traders--typically a quarter of a cent per share to whoever arrives first. Those small payments, spread over millions of shares, help high-speed investors profit simply by trading enormous numbers of shares, even if they buy or sell at a modest loss.
``It's become a technological arms race, and what separates winners and losers is how fast they can move,'' said Joseph M. Mecane of NYSE Euronext, which operates the New York Stock Exchange. ``Markets need liquidity, and high-frequency traders provide opportunities for other investors to buy and sell.''
The rise of high-frequency trading helps explain why activity on the nation's stock exchanges has exploded. Average daily volume has soared by 164 percent since 2005, according to data from NYSE. Although precise figures are elusive, stock exchanges say that a handful of high-frequency traders now account for a more than half of all trades. To understand this high-speed world, consider what happened when slow-moving traders went up against high-frequency robots earlier this month, and ended up handing spoils to lightning-fast computers.
It was July 15, and Intel, the computer chip giant, had reporting robust earnings the night before. Some investors, smelling opportunity, set out to buy shares in the semiconductor company Broadcom. (Their activities were described by an investor at a major Wall Street firm who spoke on the condition of anonymity to protect his job.) The slower traders faced a quandary: If they sought to buy a large number of shares at once, they would tip their hand and risk driving up Broadcom's price. So, as is often the case on Wall Street, they divided their orders into dozens of small batches, hoping to cover their tracks. One second after the market opened, shares of Broadcom started changing hands at $26.20.
The slower traders began issuing buy orders. But rather than being shown to all potential sellers at the same time, some of those orders were most likely routed to a collection of high-frequency traders for just 30 milliseconds--0.03 seconds--in what are known as flash orders. While markets are supposed to ensure transparency by showing orders to everyone simultaneously, a loophole in regulations allows marketplaces like Nasdaq to show traders some orders ahead of everyone else in exchange for a fee.
In less than half a second, high-frequency traders gained a valuable insight: the hunger for Broadcom was growing. Their computers began buying up Broadcom shares and then reselling them to the slower investors at higher prices. The overall price of Broadcom began to rise.
Soon, thousands of orders began flooding the markets as high-frequency software went into high gear. Automatic programs began issuing and canceling tiny orders within milliseconds to determine how much the slower traders were willing to pay. The high-frequency computers quickly determined that some investors' upper limit was $26.40. The price shot to $26.39, and high-frequency programs began offering to sell hundreds of thousands of shares.
The result is that the slower-moving investors paid $1.4 million for about 56,000 shares, or $7,800 more than if they had been able to move as quickly as the high-frequency traders.
Multiply such trades across thousands of stocks a day, and the profits are substantial. High-frequency traders generated about $21 billion in profits last year, the Tabb Group, a research firm, estimates.
``You want to encourage innovation, and you want to reward companies that have invested in technology and ideas that make the markets more efficient,'' said Andrew M. Brooks, head of United States equity trading at T. Rowe Price, a mutual fund and investment company that often competes with and uses high-frequency techniques. ``But we're moving toward a two-tiered marketplace of the high-frequency arbitrage guys, and everyone else. People want to know they have a legitimate shot at getting a fair deal. Otherwise, the markets lose their integrity.''
Mr. KAUFMAN. Madam President, in America where all are created equal, Wall Street technology has permitted the powerful to exploit loopholes that make some investors now more equal than others.
The most basic principle of a free market system is that anyone can transact goods at prices based on a free and open market, not based on some kind of insider status. These flash order practices fly in the face of Regulation NMS, which the SEC issued to guarantee that trades are executed at the best price as soon as orders become available. With flash orders, there doesn't seem to be any guarantee of this anymore.
I call again for the SEC to act quickly to protect investors in four critical areas. First, we need to implement a rule that provides the substantive protections removed when the uptick rule was rescinded in 2007.
Second, the SEC must end naked short selling. No one should be able to short a stock unless they have located specified shares of stock and obtained a contractual claim to borrow the stock in time for delivery. The SEC's announcement yesterday of plans for more discussion does not accomplish this. We need concrete action soon by the SEC.
Third, the SEC must prohibit the use of flash orders. No one--no one--should be permitted to use information asymmetry that permits high-speed computer trading to have an advantage over average investors.
Finally, the SEC should establish disclosure and transparency equality. The disclosure requirements that apply to pooled funds worth greater than $100 million should apply uniformly to all, including hedge funds, for both long and short positions, and the level of transparency for order flows should be the same for all.
I truly believe our new SEC chairman is focused on these issues and she is making progress on a number of fronts. But it is the job of Congress to urge regulators to fix problems. SEC Chairman Schapiro inherited an SEC that had made many mistakes. I respect the fact that Chairman Schapiro is working hard every day to right a foundered ship. The other commissioners are joining her in that task.
[Page: S8186] GPO's PDF In closing, I implore the SEC once again to act urgently to fulfill its core mission: protecting investors. The reason protecting investors is so important is that by doing so, the SEC ensures the credibility of the financial markets. If the SEC refuses to restore a level playing field to rebuild investor confidence in our market, then we in Congress will have to step in and do it ourselves.
Protecting investors is too important to the Nation, to the integrity of our financial markets, and to our economic recovery. I say again that legitimate capital markets and arbitrage functions have value, like legitimate short-selling has value. But exploiting an unequal playing field only skims our Nation's wealth. It doesn't create wealth or value, except for a privileged few. That harms the integrity of our financial markets and, by doing so, threatens the very foundation of our economic well-being.
As Americans, we must have faith in our institutions, both the markets and government, and we must believe that if we work hard and play by the rules, all will be treated equally. That is what is at stake. Our financial industry and capital markets can be a powerful engine for the American economy. But the SEC and Congress must work together to restore investor quality, integrity, and credibility of our financial markets.
Mr. President, I yield the floor.
The PRESIDING OFFICER (Mr. Udall of Colorado). The Senator from Ohio is recognized.
Mr. BROWN. Mr. President, I thank Senator Kaufman for his bold advocacy on behalf of consumers and investors and for a better financial system.
Mr. KAUFMAN. I thank the Senator.
http://www.thomas.gov/cgi-bin/query/z?r111:S28JY9-0020:
thanks to alanc for the above info .. http://investorshub.advfn.com/boards/read_msg.aspx?message_id=58607002
=====================================================================
Soon all will become known. (thanks to long2retire for this post)
http://investorshub.advfn.com/boards/read_msg.aspx?message_id=58679417
Quote:
Stock market Manipulation and Fraud:
Well, this isn't really a FAQ page, but it is close to it.
Here are a series of bullet points that highlight everything you need to know about the current crisis, in "elevator pitch" format:
• Wall Street has a colorful history of institutionally-condoned stock manipulation and fraud.
• Stock manipulation was not illegal until the introduction of the SEC in 1934.
• Joe Kennedy, the first SEC Chairman (and father of JFK) made his fortune running stock manipulation "pools" on Wall Street.
• The head of the NYSE, who argued successfully against any meaningful regulation and oversight of Wall Street participants (brokers) by the SEC (due to their integrity and high moral fiber), and introduced the notion of self-regulation on the "honor" system (still in place today), was subsequently sentenced to 10 years in Sing-Sing for embezzling client accounts - including a fund in his care set up for orphans.
• The SEC originally was envisioned to have prosecution power.
• The final bill giving birth to the SEC was so anemic and watered-down that it was chastised as nonsense when it was passed, and it severely constrained the new Commission, and limited the SEC's power to filing civil suits. Virtually all the rules with Congressional teeth were stripped out of the bill, at Wall Street's behest. That state of affairs continues to this day.
• The SEC was never intended to police Wall Street and ensure a level and fair playing field - Roosevelt created it to, "Restore investor confidence in the market" after the 1929 and 1932 crashes - not to ensure there was any good reason to have confidence.
• The SEC's track record of action against Wall Street players is worse than abysmal.
• Broker/dealers have transitioned from owing their clients a fiduciary obligation of safekeeping, to a "customer" relationship, that is essentially adversarial - caveat emptor being the rule for customers.
• As commissions have dwindled to nothing (due to the advent of discount brokers, following deregulation) Wall Street is now beholden to the large money movers for their income, and stock lending is one of their biggest profit centers.
• Stock lending is exclusively an activity used by short sellers, who must borrow stock before selling it.
• Short selling is a bet on stock price declines. The short seller borrows stock, and then sells that borrowed stock, hoping to buy it back at a lower price later, when he returns it to the lender.
• Illegal "naked short selling" involves placing a sales transaction, but not borrowing the stock, and simply failing to deliver it on delivery day. It is also called "failing to deliver" or FTD - or delivery failure.
• Delivery failure is a significant problem nowadays, as it can be used to run stock prices down in a manipulative manner. Delivery failure in any other industry is called fraud. Hedge funds are the biggest culprits in this illegal trading strategy, with broker/dealers right behind them in the culpability queue.
• Hedge funds are now the largest players in the US equities markets, representing the majority of trading, with almost $2 trillion under management.
• Hedge funds are large, virtually unregulated pools of anonymous money, used to invest in any way the operator sees fit.
• Prime brokers allow their hedge fund customers leverage on their assets, meaning that for every dollar of asset, they could easily hold $10 of short positions.
• This over-leverage presents a systemic risk should positions in several larger funds go the wrong way, as there isn't enough collateral to cover the domino effect of multiple positions being forced to cover.
• This over-leverage creates an environment where the brokers are now pregnant with their hedge fund customers' liabilities, and have a vested interest in seeing depressed stock prices remain depressed - if the stocks go up, the hedge funds could easily fail, and the brokers are on the hook to buy-in and deliver the stock owed by the funds - resulting in brokerage failures.
• The DTCC is ultimately at risk for this domino effect, as brokerages fail.
• The DTCC is owned by the brokers, thus is the brokers.
• The DTCC processes over $1.2 quadrillion (million trillion) every year, and owns most of the stock American investors hold in their accounts - but most of the country has never heard of the company. The total GNP of the planet is about $20 trillion per year.
• 1% of all trades in dollar volume fail to settle (be delivered) every day, per the SEC.
• $130 billion to $150 billion of equities trade every day.
• $2 trillion of total trades are processed by the DTCC every day, including bonds.
• The SEC does not qualify whether they refer to total trades, or total equities, when referring to 1% failing to settle.
• The SEC keeps the total dollar value of trades that have failed to be delivered secret.
• The Securities Industry Association publishes a spreadsheet that tallies the financial position of all NYSE member firms, and that spreadsheet shows $63 billion plus delivery and receipt failures as of the final day of Q2, 2006, just for those firms. Lines 69 and 103.
• The DTCC claims delivery and receipt failures are a rolling $6 billion per day.
• The disconnect in the numbers is CNS netting, wherein all fails are netted against all shares held long by the brokers, effectively concealing 90+% of the problem once netting is through.
• The $63 billion number doesn't include any of the massive international clearing firms. And that number is after pre-CNS netting, where the day's buys are used to offset the day's sells (even naked sells) at the broker and clearing house level, before reporting to the SIA, and before going into the CNS netting system.
• Of the $130 to $160 billion per day that trades in stock, per the DTCC, 96% is handled by CNS netting. This is consistent with the disconnect in the $6 billion and the $63+ billion numbers. 96% is handled by netting, which means 4% isn't. 4% of $130 billion is $5.2 billion not handled by CNS netting. Of that $5.2 billion, $2.1 billion fails. $1.1 billion of the fails are accommodated by the stock borrow program. $1 billion isn't, and goes onto the $6 billion post netting failure pile.
• $5.2 billion per day aren't handled by CNS netting. $2.1 billion fail. That is 40% of the trades, fail. $130 billion to $160 billion stock trades daily. $63 billion fails just in NYSE firms. That is around 40%.
• The SEC insists that the failure issue isn't a big problem. So does the DTCC. So does Wall Street. None of these entities have commented on the SIA spreadsheet, nor has the NY financial press. Not one comment. None.
• $63 billion is a big problem. That is a mark-to-market number, where yesterday's $20 stock is today $1, thus yesterday's $20 billion problem is now valued as a $1 billion problem. That means the actual true value of the problem is likely 10-20 times larger.
• $630 billion to $1.2 trillion is a very big problem. Even by NY standards.
• The SEC "grandfathered" all failed to deliver trades prior to January, 2005, effectively pardoning all those trades (for which money was paid but no stock ever delivered), from ever being required to deliver. This amounts to allowing those that violated delivery rules to keep the money from their illegal conduct.
• The SEC keeps the number of shares grandfathered, as well as the dollar amount, secret, for fear of creating market disrupting "volatility".
• The above numbers do not take into account the large number of undelivered trades that are handled "Ex-Clearing" - a way of handling delivery outside the system. Nor do they take into account pre-CNS netting, nor international clearing house fails.
• Many securities scholars believe the "Ex-Clearing" failure problem is 10 times larger than the in-system problem the above numbers represent.
• Many investors that think they have "shares" in their brokerage accounts, don't. They have "markers" that have no underlying share to validate them. Some call these "counterfeit shares", with good reason. The technical term is "Securities Entitlement."
• UCC8 mandates that all Securities Entitlements have a genuine share on deposit at the DTC, or in the broker's possession, for each Securities Entitlement. That rule is ignored by the SEC and Wall Street.
• The DTCC, via Cede & Co., is the registered owner of all shares held in "Street Name," which are all shares in margin accounts.
• Margin accounts represent the bulk of independent investor account types.
• Registered owners are free to use their "property" as collateral for loans or debt.
• It is unknown what, if any, loans or debts are collateralized by the stock "owned" by the DTCC.
• The DTCC's "Stock Borrow Program" lends shares to be delivered to buyers, if sellers fail to deliver.
• The Stock Borrow Program is operated on the honor system, and is anonymous.
• It allows one genuine share to be lent multiple times, leaving a string of markers/IOUs in the share's wake.
• This creates a systemic risk for the stock market, as more markers are in investor accounts, falsely represented as shares, than shares actually authorized by the companies.
• These markers are freely traded and treated by the system as real, resulting in a large secondary market of counterfeit shares - resulting in depressed stock prices.
• With paper certificates being eliminated - by the DTCC - there is no way to confirm that a share is genuine, versus a bogus marker.
• There is nothing to stop your broker from taking your money, and merely representing to you that you bought shares, without ever actually buying them. You have no way of knowing the difference, barring demanding paper certificates for your property.
• Only a handful of people on the planet understand all this.
• In the end, it is simple - Wall Street is printing shares electronically, investors are paying real money for those bogus shares, and the whole thing is predicated on the idea that few will ever understand what is being done, or bother to check.
• This represents a hidden tax on investors and the economy.
• It is, for the most part, illegal.
• It is being kept secret by the DTCC and the SEC, who are terrified of systemic collapse, and a complete loss of investor confidence, should all the facts become known.
• All the facts are becoming known.
Just "Tryin to make it real compared to what" the steady diet of nonsense we are fed is.
"All of the facts are becoming known"
http://investorshub.advfn.com/boards/read_msg.aspx?message_id=33434310
|
Posts Today
|
0
|
|
Posts (Total)
|
20257
|
|
Posters
|
|
|
Moderator
|
|
|
Assistants
|
| Volume | |
| Day Range: | |
| Bid Price | |
| Ask Price | |
| Last Trade Time: |


