 News
News  Market Data
  Discover
Support: 888-992-3836
Copyright © 2023 InvestorsHub Inc.


Register for free to join our community of investors and share your ideas. You will also get access to streaming quotes, interactive charts, trades, portfolio, live options flow and more tools.
Crude Oil Continues to Consolidate
By: Christopher Lewis | May 17, 2024
• Crude oil markets have consolidated a bit during the course of the trading week, but it does look like we have plenty of support underneath. Because of this, I think we are trying to build some type of base to get moving, but right now we just don’t have any follow-through.
WTI Crude Oil Weekly Technical Analysis
The West Texas Intermediate crude oil market has initially fallen during the week, only to turn around and show signs of life. At this point, it is worth noting that we have bounced from the 50% Fibonacci retracement level.
And of course, we are looking at the 50 week EMA just above, which on the daily chart is also the 200 day EMA. And then, of course, we’re paying attention to the $80 level. In general, if we can break above the $80 level, then I think the market can go higher, perhaps reaching the $85 level over the longer term.
Psychologically speaking, this is travel season, so therefore most of the time oil does fairly well. That being said, it doesn’t necessarily mean that it’s going to be an easy grind higher. But I do think that it’s easier for the market to rise than fall for a significant move.
Brent Crude Oil Weekly Technical Analysis
Looking at the Brent market, it’s very much the same situation bouncing from the 50% Fibonacci retracement level facing the 50 week EMA and the $84.50 level is a major barrier. If we can break above there, then it’s likely that we could go looking to the $90 level. On the other hand, if we were to break down below the bottom of the hammer on either grade, that probably drags oil on the whole down within the 61.8% Fibonacci retracement level would be an area that a lot of people would be paying attention to.
So do keep that in the back of your mind. That could be the next support level. Either way, this is a market that I think is going to continue to be very choppy on short term charts, but there are a lot of geopolitical concerns out there that could flare up and send oil straight up in there. So, keep that in mind.
Read Full Story »»»
 DiscoverGold
Fire And Rain. The Energy Report
By: Phil Flynn | May 17, 2024
I’ve seen fire and rain and both of those could impact oil prices today. Massive rains in Houston have caused flooding and could impact oil production and potentially refining activity. While at the same time Canadian wildfires could threaten 2.1 million barrels of Canadian oil production a day in the worst-case scenario according to a report by Rystad Energy.
Fox Weather reported that the Houston metro area was rocked by severe storms that left 4 dead and over 1 million without power. They say that a storm system spawned severe thunderstorms in Houston Thursday, causing at least four fatalities and leaving more than 1.0 million customers without power across southeastern Texas. The oil market is going to watch very carefully as to what potential disruptions these storms might cause. Power outages reduce demand for electricity but at the same time it could impact refining operations and while we have no direct reports, we’re going to be watching the wire to see if there’s any that are reported.
We did see a big jump back up in the beleaguered gasoline crack spread yesterday in a signal to refiners they need to ramp up production of gasoline ahead of the Memorial Day holiday. In recent weeks gasoline demand has been disappointing to say the least but the bounce in the crack spread suggests that we could see a rebound soon.
This comes as we head into a weekend where the market is expecting the Fed to have some leeway to cut interest rates after we saw initial jobless claims yesterday come in stronger than expected and saw weakness in the Philly fed manufacturing number. Also a weakness and housing starts and building permits and while import prices came in a little bit hotter than expected, the market doesn’t believe that there is an increased chance of perhaps more than one interest rate cut before the end of the year.
Reports that China is making moves to stimulate its housing market is supportive to oil and gas. The People’s Bank of China effectively scrapped the nationwide minimum mortgage interest rate while cutting the minimum down-payment ratio to 15% for first-time buyers and 25% for second homes, according to a statement on Friday. The previous ratios stood at 20% and 30%, respectively according to Bloomberg News.
Reuters is also reporting that China’s industrial output grew by 6.7% year on year in April as recovery in its manufacturing sector gathered pace, accelerating from the 4.5% in March and pointing to possibly stronger demand for oil to come.
All this signals that the recent correction in oil as well as the crack spreads should be nearing the end. We know that gasoline demand is being impacted by the consumers being hit with inflation pressures. There are signs that we could be turning the corner with weakness in manufacturing data that has helped ease some of the tightness in the diesel product market. And if the damage in Houston to refineries is small, we would expect to see big draws in crude oil inventories in the next few weeks. While the correction may try to retest if we get bad economic news from these levels, we feel that the risk on the downside is a lot less than the potential risk on the upside.
We are also seeing stronger demand for natural gas because, gosh darn it, low prices sometimes start to cure low prices. Gas prices are up over 43% with renewed hopes that liquefied natural gas exports will pick up and production will level off. While we did see some signs of production leveling off, it did bounce back. Yesterday the Energy Information Administration reported demand for natural gas for electricity generation hit an all-time high in January. The United States power generation from natural gas has risen over the last 2 years and most likely will again this year. And we’re starting to see some hope in the storage numbers, we may be whittling down the massive inventory as the EIA reported a smaller than expected increase in storage. They said that, “Working gas in storage was 2,633 Bcf as of Friday, May 10, 2024, according to EIA estimates. This represents a net increase of 70 Bcf from the previous week. Stocks were 421 Bcf higher than last year at this time and 620 Bcf above the five-year average of 2,013 Bcf. At 2,633 Bcf, total working gas is above the five-year historical range.
Read Full Story »»»
DiscoverGold
Natural Gas Bullish Momentum Continues but Overdue for a Correction
By: Bruce Powers | May 16, 2024
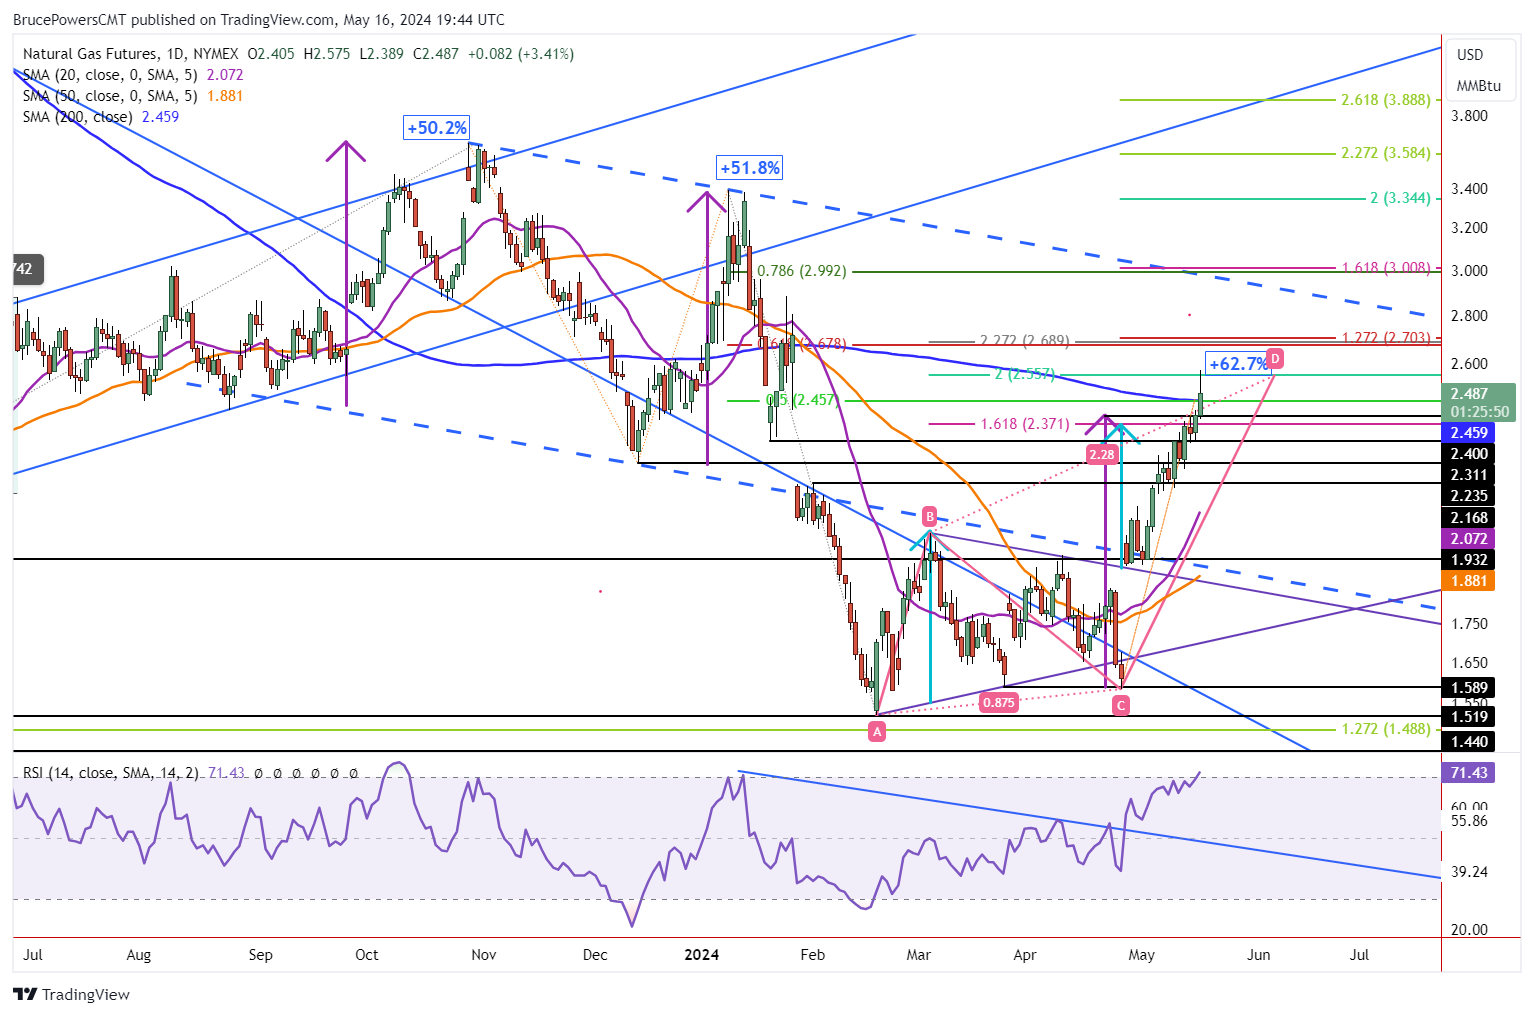
• The recent surge in natural gas prices has been remarkable, with the commodity hitting a new high and breaking through key resistance levels.
Natural gas blasted through potential resistance at the 200-Day MA on Thursday to hit a new trend high of 2.575. Resistance then kicked in leading to an intraday pullback. That high completed a rising ABCD pattern where the CD leg was 200% of the advance in the AB leg of the pattern. The 200-Day MA is at 2.46 and natural gas continues to trade above that price level at the time of this writing. A daily close above the 200-Day line indicates that the uptrend may have more to go.
Can Strength Continue?
Certainly, today’s bullish price action is a sign of strength as natural gas recently busted through three price zones that could have seen resistance, especially the 200-Day line. However, can demand remain strong enough to take out today’s high and keep rising? That remains to be seen.
Rally Extended
The current rally is extended and closer to a top than it has been. As of today’s high, natural gas is up by 62.7% from the April 25 swing low at 1.58. That makes the current rally the largest on a percentage basis since the initial trend low from February 2023. Nevertheless, if the 200-Day MA can continue to act as support, the price of natural gas has a chance of continuing its rise. The next higher target zone is at 2.68 to 2.70. Those price levels are the 61.8% Fibonacci retracement and a 127.2% extension of a 51.8% measured move (purple arrows) that matches the rally beginning in August 2023, respectively. The high target is the top blue dashed falling channel line.
Drop Below 2.39 Should Lead to Deeper Pullback
A decisive drop below the 200-Day MA may provide an initial indication that a retracement may be coming. But a drop below today’s low of 2.39 will provide a clearer short-term bearish signal. Potential support from the 20-Day MA is down at 2.07. Higher price levels to watch on the way down are marked on the chart in black right extended lines from prior swing highs and lows. They include 2.31, 2.23, and 2.17. Fibonacci levels will be added on the chart if a retracement begins.
Read Full Story »»»
DiscoverGold
The energy sector $XLE is starting to look enticing again
By: TrendSpider | May 16, 2024
• The energy sector is starting to look enticing again. $XLE
Top holdings: $XOM. $CVX, $COP, $EOG, $SLB, $MPC

Read Full Story »»»
DiscoverGold
Crude Oil Continues to Find Value Hunters
By: Christopher Lewis | May 16, 2024
• The crude oil markets have bounced back after selling off again, as the oil markets enter what is typically a very bullish time of year for the markets.
WTI Crude Oil Technical Analysis
The West Texas Intermediate Crude Oil Market initially pulled back a little bit during the trading session on Thursday, but then turned around to show signs of life again. This is an area that I think will continue to be consolidated and it’s probably worth noting that the market is paying close attention to the 200-day EMA and the $80 level above. If we can break through all of that, then I think the WTI crude oil market continues to rally for a bigger move. It might be worth noting that the 50% Fibonacci retracement level is just below as well, and that of course brings in technical traders also. In other words, I’m somewhat bullish, but cautious, I’m not willing to throw a ton of money into the market.
Brent Crude Oil Technical Analysis
Brent looks exactly the same to me. 200 day EMA and the $84.50 level above offering resistance, but it certainly looks as if the 50% Fibonacci retracement level is coming into the picture to keep oil somewhat afloat.
There is a cyclical argument to be made for crude oil this time of year, and then of course there’s a lot out there that could have influence due to geopolitics. So really at this point, I have no interest whatsoever in shorting the market. I think this is an area of value that people will eventually take advantage of in trying to send oil much higher as they typically do during the summer anyway.
Read Full Story »»»
DiscoverGold
Can’t Get It Together. The Energy Report
By: Phil Flynn | May 16, 2024
Let’s face it, the OPEC plus cartel the International Energy Agency (IEA) and the Energy Information Administration EIA are basically a hot mess. The growing divergence on predictions for both supply and demand and whether oil demand will eventually go away or continue to grow has market participants just scratching their heads. Predictions of peak oil production and peak oil demand and record adjustments have added confusion to the market and for both users and producers of oil.
As we have said before, the International Energy Agency, in my humble opinion, is one of the worst forecasters when it comes to global supply and demand. I pointed out in the past that they have basically said that they’ve skewered their data to raise more awareness about the threats of climate change. The IEA job was never to combat climate change but to ensure energy security for oil consuming nations. It’s sad to see that this once noble organization has lost its way and admittedly skewer their supply and demand forecast to push green energy agenda.
OPEC on the other hand has a better track record and have predicted that the death of global oil demand is highly exaggerated. OPEC has even poked fun at the International Energy Agency for the way they’ve had to backtrack on their peak oil demand predictions. OPEC and the IEA divergence in the market outlook was highlighted once again after the International Energy Agency reduced its forecast for demand growth for this year to 1.1 million barrels a day while OPEC kept their demand growth forecast for this year at 2.2 million barrels. The International Energy Agency pointed to weak demand in Europe and a mild winter as the reason for the downgrading of its demand forecast for this year. OPEC on the other hand sees demand growth continue with record oil imports into places like India and China.
While The International Energy Agency boldly reduced its demand forecast for this year, they more quietly seem to shift back its prediction for peak oil demand once again. Dan Tsubouchi at Energy Tidbits reports that the IEA demand doesn’t even add up to what the headlines are saying. He wrote, “Rinse & repeat? IEA in April cuts its 2024 year over year oil demand growth by 120.000 barrels a day and now IEA for May cuts 2024 year over year oil demand growth by 140.000 barrels a day.
As many of you remember the International Energy Agency years ago predicted that oil demand globally peaked a few years ago. They continue to overestimate the ability of alternative fuels to replace traditional fossil fuels in the global economy. Yesterday, in the interview with Bloomberg, the International Energy Agency Toril Bosoni was asked whether the International Energy Agency sees peak fossil fuel demand being pushed back towards the end of the decade seemed to suggest that peak oil demand might not be so much a peak but a plateau. Ms. Bosoni was quoted as saying, ”we see a oil demand plateau rather than a steep peak towards the end of the decade based on our current assumptions” So in other words we will be using fossil fuels a lot longer than the International Energy Agency has said in the past.
It seems like the oil market is still pessimistic on demand even after we got a supportive Energy Information Administration’s (EIA) inventory report and a weaker than expected consumer price index report.
Also concerns by EIA that average monthly prices for regular-grade retail gasoline in the United States could increase by more than 10 cents per gallon (gal) if refinery output is lower than expected. Oil did manage to close on a strong note, but it was disappointing considering the run that we had on copper, silver, gold and the stock market.
Oil seemed disappointed that the OPEC plus cartel decided to hold their June meeting virtually. That perhaps means that OPEC will agree to extend their production cuts through the end of the year. The move to a virtual meeting means more than likely they will wait to decide on an extension of the cuts into 2025 for another meeting and raised fears that they might not extend the cuts at all.
The EIA reported that U.S. commercial crude oil inventories (excluding those in the Strategic Petroleum Reserve) decreased by 2.5 million barrels from the previous week. At 457.0 million barrels, U.S. crude oil inventories are about 4% below the five-year average for this time of year. Total motor gasoline inventories decreased by 0.2 million barrels from last week and are about 1% below the five-year average for this time of year. Distillate fuel inventories slightly decreased last week and are about 7% below the five-year average for this time of year. Total demand based on products supplied over the last four-week period averaged 20.1 million barrels a day, up by 0.7% from the same period last year. Over the past four weeks, motor gasoline product supplied averaged 8.7 million barrels a day, down by 4.5% from the same period last year. Distillate fuel product supplied averaged 3.6 million barrels a day over the past four weeks, down by 5.3% from the same period last year. Jet fuel product supplied was up 3.7% compared with the same four-week period last year.
Jodi reported that, “Crude inventories built by 17.7 mb in February but were still 262 mb below the 5-year average. Product inventories drew by 2.9 mb but were 4.8 mb above the 5-year average.
Natural gas traders will look at today’s Energy Information inventory report for natural gas to see if the impressive recovery rally can continue. The back end of the gas curve once again moved above $5 which is a sign that demand expectations for natural gas are going to explode in the coming years. In the short term, traders will look at today’s report which should come in with an injection somewhere in the area of 76 BCF.
Read Full Story »»»
DiscoverGold
Natural Gas Eyes on 2.46 Target
By: Bruce Powers | May 15, 2024
• Bullish trend persists as natural gas approaches 2.46 target, supported by 50% retracement and 200-Day MA.
Natural gas reached a new trend high of 2.42 on Wednesday as the bull trend persists. It is rapidly approaching the next higher target of 2.46. That is where the 200-Day MA and 50% retracement resides. The 200-Day line is a significant trend indicator, and this is the first approach since the price of natural gas dropped below the 200-Day MA in late-January. Therefore, it expected that resistance will be seen around that line, enough to turn prices back down. A little higher is the 50-Week MA at 2.49
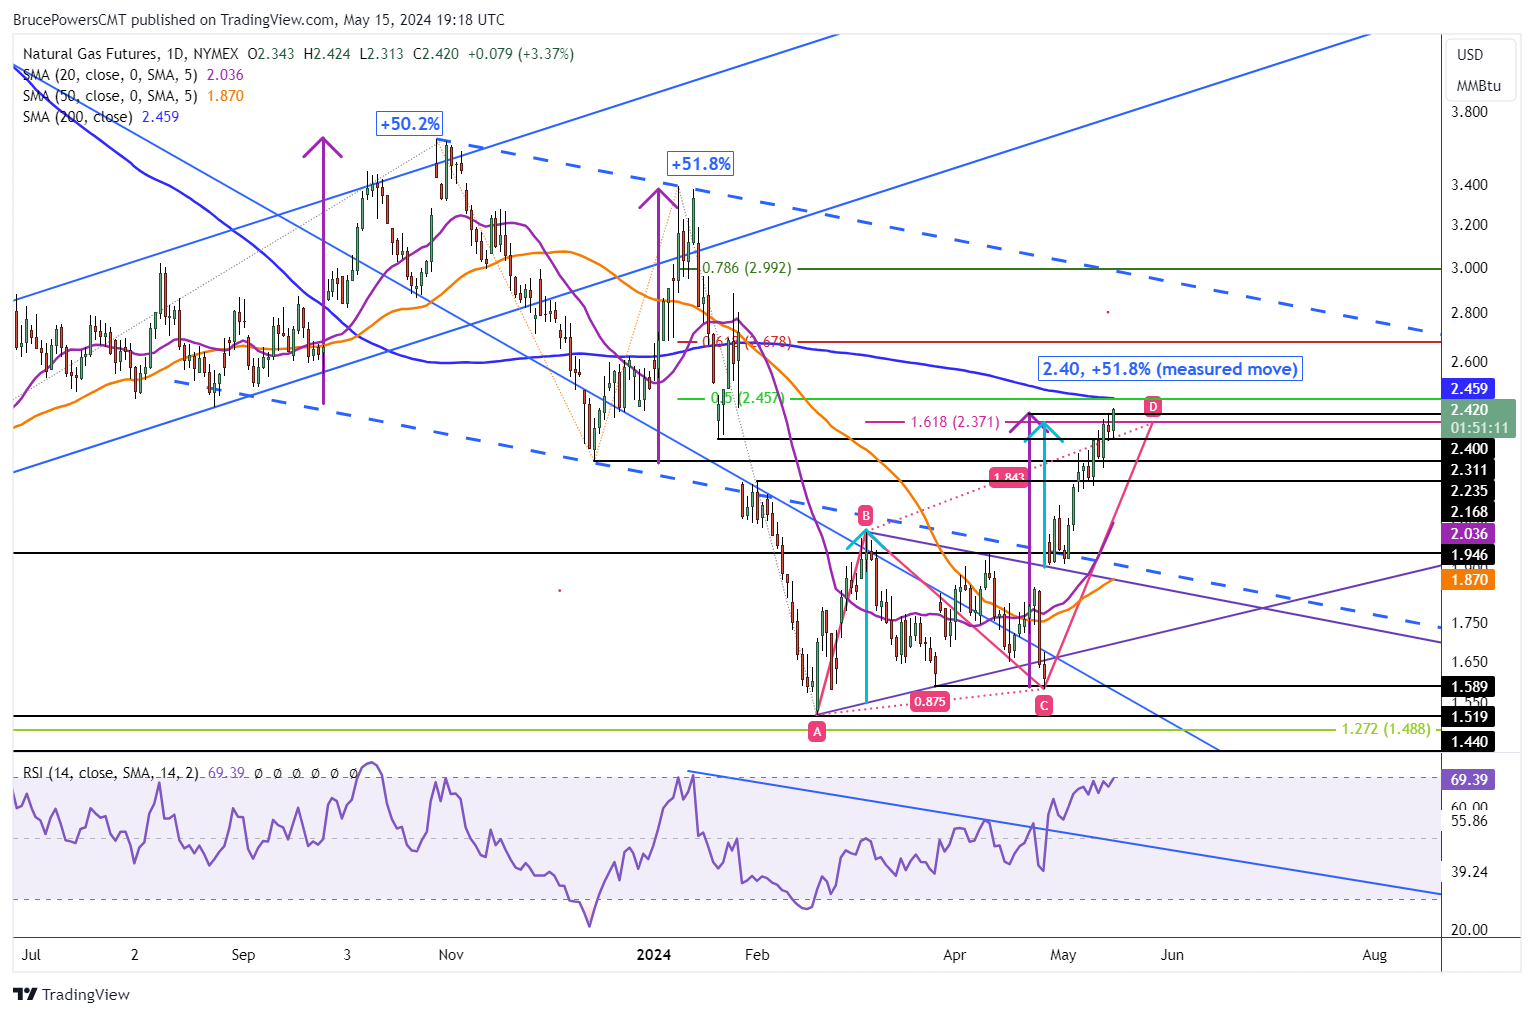
Drop Below 2.31 Points to Retracement
A retracement is first indicated on a drop below today’s low of 2.31. Prior swing highs and lows then mark possible support levels starting with 2.23, which was a swing low in December. Then the level is a little lower at 2.21, followed by 2.18. This is the fourth consecutive week of positive performance for natural gas. Although the week is not over, it is currently trading near the highs of the day, and it is well on track to hit the 2.46 target zone. The 20-Day MA is a way lower at 2.04. It wouldn’t be surprising to see the 20-Day line tested as support if a retracement does come.
Key 2.46 Pivot Approached
Although the 2.46 price area is a key pivot, price action will leave clues as to what might be coming. Given the strength of the advance so far, might natural gas be able to breakout above the 200-Day line? Given the confluence of indicators highlighting a resistance zone from 2.37 to 2. 49, an upside breakout seems less likely, but it is possible. Or a brief consolidation and/or retracement could follow a test of the 200-Day line.
In this case, natural gas would be heading up towards the 61.8% Fibonacci retracement level. The 78.6% Fibonacci retracement follows. Also, a rise to test the top channel line could be in the works. If reached today the top channel line would match the 78.6% retracement level. Let’s watch the reaction of price upon approaching the 200-Day line for further insights.
Read Full Story »»»
DiscoverGold
Crude Inventories Declined By 2.5 Million Barrels, More Than Expected
By: Vladimir Zernov | May 15, 2024
Key Points:
• Strategic Petroleum Reserve increased from 367.2 million barrels to 367.9 million barrels.
• Domestic oil production remained unchanged at 13.1 million bpd.
• Oil prices rebounded from session lows as traders reacted to EIA data.
On May 15, 2024, EIA released its Weekly Petroleum Status Report. The report indicated that crude inventories declined by 2.5 million barrels from the previous week, compared to analyst consensus of -1.4 million barrels. At current levels, crude inventories are about 4% below the five-year average for this time of the year.
Total motor gasoline inventores decreased by 0.2 million barrels from the previous week, while analysts expected that they would grow by 0.9 million barrels. Distillate fuel inventories have slightly declined.
U.S. crude oil imports decreased by 226,000 bpd from the previous week, averaging 6.7 million bpd.
Strategic Petroleum Reserve increased from 367.2 million barrels to 367.8 million barrels as U.S. continued to buy oil for strategic reserves.
Domestic oil production remained unchanged at 13.1 million bpd, which is not surprising as oil prices have been moving lower in recent weeks.
WTI oil rebounded from session lows as traders reacted to the EIA report. Currently, WTI oil is trying to settle above the $77.50 level. Oil prices settled near multi-month lows as traders were worried about the strength of the demand for oil.
Brent oil settled near the $82.00 level after the release of the EIA report. The geopolitical premium for oil prices have significantly declined in recent weeks as traders do not believe in supply disruptions in the Middle East. At this point, oil markets need significant positive catalysts to break the current trend.
Read Full Story »»»
DiscoverGold
Biden Tariff Squeeze. The Energy Report
By: Phil Flynn | May 15, 2024
The timing of Biden’s directing his trade representative to increase tariffs under Section 301 of the Trade Act of 1974 on $18 billion of imports from China helped light a fire under an already tight industrial metal market that helped play a part in an epic copper market squeeze as well as inspiring panic buying in in other metals like platinum and now more buying in gold and silver. This comes against a backdrop of an oil market that is trying to assess a prediction by the International Energy Agency (IEA) that is predicting that world oil production will increase by 580,000 bpd this year to record 102.7?million bpd and a prediction that global oil demand will hit an all-time high next year of 102,7 million barrels a day. The market also received a supportive report from the American Petroleum Institute (API) .
The tightening global copper market has been an issue for some time and the market went over the edge after the report of the Biden sanctions spread trading between the front end of the curve and the back month made a record-breaking one day move. Bloomberg reported that, “The sharp price move has been tightly focused on the most-active July contract on Comex. The expanded premium of that price over copper on other global exchanges — and the need for shorts to deliver metal against their positions — is already prompting a rush by traders in China to arrange shipments to Comex warehouses in the US. “The short squeeze is set to continue as traders might not be able to ship enough metal from either Chinese bonded warehouses or from Europe ahead of the delivery date,” Jia Zheng, head of trading at Shanghai Dongwu Jiuying Investment Management Co., said.
Supplies of copper are going to be even tighter as buyers move to secure supply before Biden’s Chinese sanctions go in place. That added uncertainty is raising questions as to how the sanctions on electric vehicle components could tighten the market forward copper and other metals. Aluminum and steel did not move as much because the demand for those two commodities isn’t as strong but for markets that are not as tight as compared to platinum, Palladium and copper. The impact of the sanctions cannot be underestimated surrounding the historic moves. The Biden sanctions we’re like throwing a lit match on gasoline in a market where supply issues are already apparent.
It also raises the specter of inflation which was a major focus for oil traders yesterday. The PPI, especially month over month, came out higher than expected but both Federal Reserve Chairman Jerome Powell and other fed speakers seemed to suggest that the Fed was not considering an interest rate hike and at the very worst case, the heating of inflation most likely would lead to the Fed standing pat on rates. We’ll see how hot today CPI is.
The market did get some supportive data from the American Petroleum Institute. API reported a larger than expected 3.104 million barrel drop in crude supplies. That probably suggests that refiners are starting to kick into high gear, and it could be the first of many draws as we get into the heart of the summer driving season. The API also reported a 1.269 million barrel drop in gasoline inventories and a 349,000-barrel increase in distillate inventories. We also saw a drop of 601,000 in the Cushing, OK delivery point which is the first draw in a while.
The International Energy Agency surprisingly lowered their demand forecast this year by 140,000 barrels a day mainly because of what they say was weak demand out of Europe. Yet for next year, their demand forecast is an increase of 1.2 million barrels a day which is slightly higher than their last forecast. The IEA says that they believe that the oil market looks more balanced overall in 2025 and they say that if OPEC voluntary production cuts were to stay in their place, they still think global oil supplies could rise by 1.8 million barrels a day compared to a 580,000 barrel increase in 2024.
The IEA points to the increase in supply coming with a big jump on offshore oil storage, yet their data seems to contradict other data that shows that we’ve seen a dramatic drop in offshore oil storage in recent weeks. I guess it comes down to who do you believe, Bloomberg or the International Energy Agency? Or is the IEA running behind. Bloomberg reported that oil in floating storage is at the lowest level since February of 2020, falling to only 55.92 million barrels as of May 10. This data came from Bloomberg News that reported a stunning drop in floating storage of 11% since just last week.
The IEA said that, “Global oil inventories surged by 34.6 mb in March, as oil on water swelled to a fresh post-pandemic high. On land stocks fell by 5.1 mb to their lowest level since at least 2016, as total OECD stocks declined by 8.8 mb to a 20-year low while non-OECD inventories built for the first time since November. According to preliminary data, global oil stocks rose further in April.
For some strange reason it appeared that oil prices dropped after OPEC announced that it’s likely to hold its June 1st policy meeting online. To me the online meeting would suggest that there doesn’t seem to be any anticipation of any real friction at the meeting. But the market is a little bit nervous.
The market is also keeping an eye on wildfires in the Alberta that could impact production. We have seen wildfires in the past shut down production and do a lot of damage so we’re praying for the people in Canada.
Natural gas is still recovering on hopes for more LNG exports. Technically the markets had a very good month as it has come back from the lows. Hopefully a few weeks ago when we’re recommending buying calls, people took advantage of that.
Read Full Story »»»
DiscoverGold
Natural Gas Eyes on 200-Day Moving Average at 2.46
By: Bruce Powers | May 14, 2024
• Upward momentum in natural gas remains strong, targeting 200-Day MA at 2.46, but a pullback is possible after completing another target at 2.40 today.
Natural gas advances to a new trend high of 2.40 on Tuesday and hits the initial target from a measured move. Upward momentum still looks constructive as the day’s trading range is relatively narrow and positioned in the upper zone of Monday’s range. If natural gas manages to end today’s session above yesterday’s high of 2.38, it will be in a slightly stronger position than if the close occurs below that high.
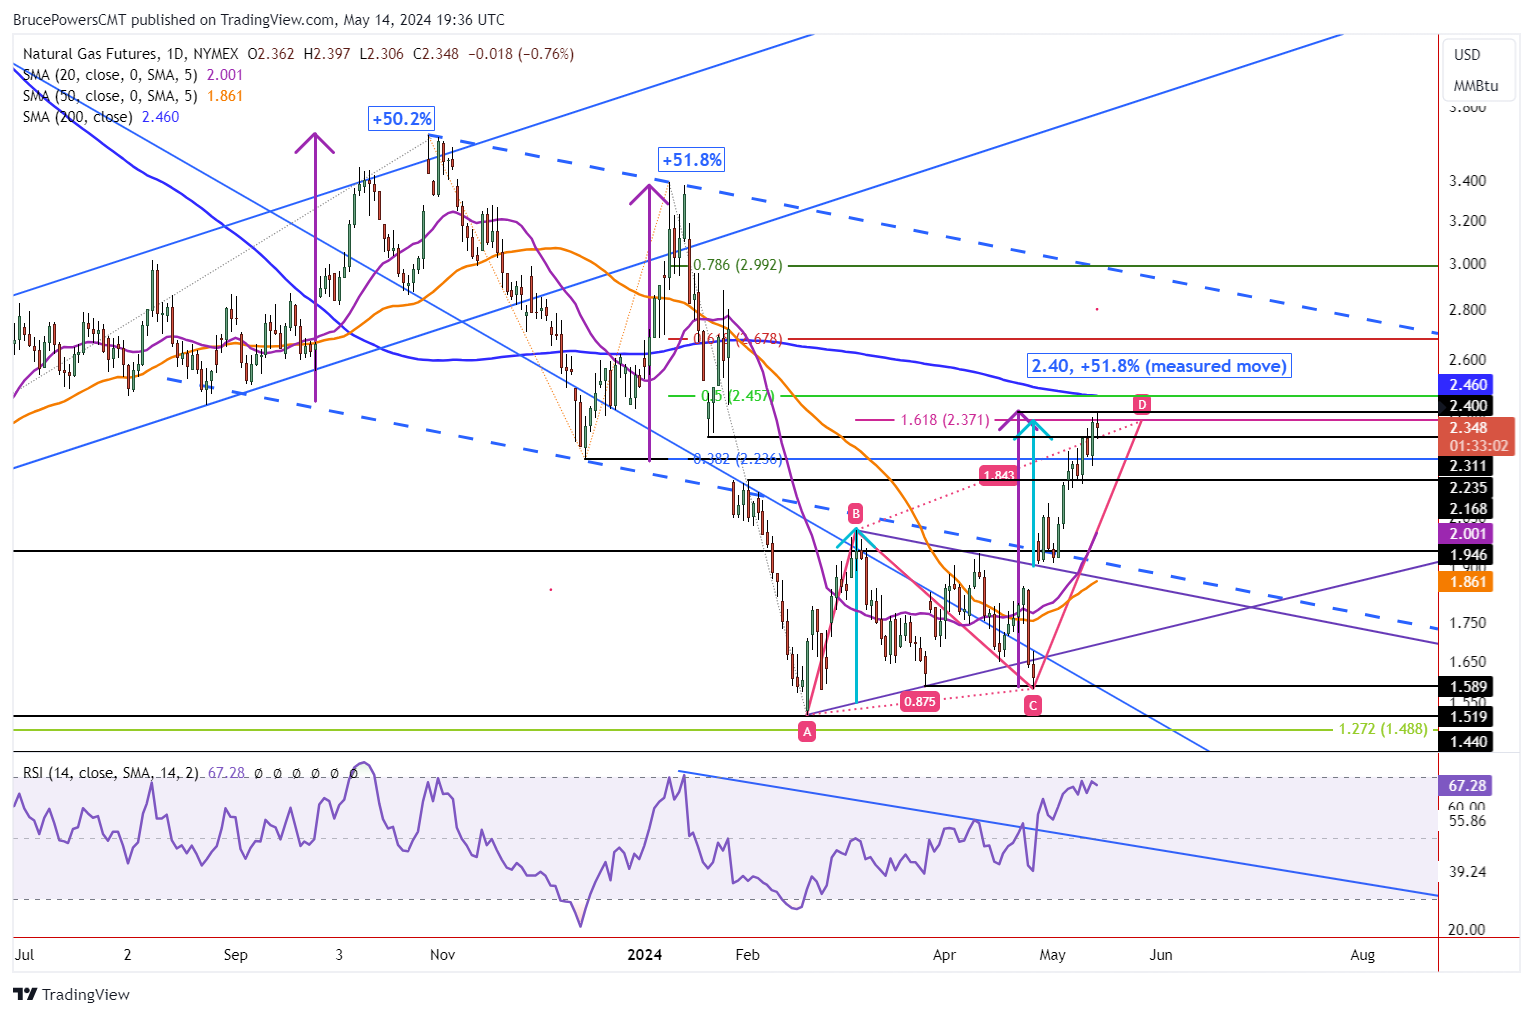
200-Day Line at 2.46 is Next Target
The next target zone is the 200-Day MA at 2.46. It is strengthened by the 50% retracement, which marks the same price. Natural gas is well on its way to that target, and it continues to have a good chance of being reached before resistance stops the ascent, possibly leading to a pullback. Further, the 50-Week MA (not shown) is slightly above the 200-Day line at 2.49. If the completion of the measured move at today’s high doesn’t end the ascent, a 2.46 to 2.48 target zone should be next on the agenda.
First Approach to 200-Day Line Could See Strong Resistance
It is common for price to be rejected from a long-term moving average the first time it is approached after being away from it for a while. Following the January 25 internal swing high natural gas dropped below the 200-Day line and accelerated to the downside.
The current rally is the first attempt since then to test the 200-Day line as resistance. However, if natural gas manages to break through the 200-Day line and the 50-Week line, and then stays above them, it would next be heading towards the 61.8% Fibonacci retracement at 2.68. Depending on when reached, the upper declining blue dashed channel line may have an impact as the channel line and 61.8% level may be near each other.
Near-term Support at 2.31
If instead of continuing to ascend, today’s high leads to a retracement, the first sign of it would be on a drop below today’s low of 2.31. The prior swing low and 38.2% retracement at 2.24 would the be the next lower possible support zone. Other price levels will be looked at in the future if the pullback scenario unfolds.
Read Full Story »»»
DiscoverGold
Float The Boat. The Energy Report
By: Phil Flynn | May 14, 2024
Get ready to float your oil boat as data from OPEC and floating storage suggests the global oil market tightening. While US crude oil inventory supply in recent weeks saw some surprising increases, the same is not true if you look at oil in floating storage around the globe which now is at the lowest level since February of 2020, falling to only 55.92 million barrels as of May 10. This data came from Bloomberg News that reported a stunning drop in floating storage of 11% since just last week. So, in other words, the concerns about global demand falling off the map were probably overstated and that’s one of the reasons why oil had a pretty decent performance, which has been unusual to start the week for a while. OPEC stands by its prediction that the global oil demand will rise by 2.25 million barrels a day ( Mn b/d) to 104.46mn b/d this year and by a further 1.85mn b/d to 106.31mn b/d next year, the group said in its latest Monthly Oil Market Report (MOMR). We are also getting oil price support on signs that US refineries are ramping up production.
That should start a string of crude oil supply draws and if demand holds up, we could start to realize that this selloff in oil prices last week on reduced war premium and interest rate concerns may have been overdone.
In fact, if you look at the recent pullback in oil, many traders believe that it isn’t about supply and demand for oil but really about the ability of the Federal Reserve to continue to float the economy. That’s why after the inflation data, the market is going to pay very close attention to what Fed Chairman Jerome Powell says today during his speech at 10:00 AM Eastern Time 9a central time. Biden lead inflation has been a problem for the Federal Reserve that initially had planned on an aggressive path of interest rate cuts. Obviously the inflation data changed their narrative and that’s why today’s producer price index number could be key for the direction not only of oil, but the stock market, bonds and other commodities today.
The Fed must realize that they can only control what they can control. They can’t control the aggressive spending coming out of Washington in the Biden administration. They can’t control Biden trying to buy votes by doing things like trying to pay off student loans even though it has been ruled unconstitutional. The Federal Reserve cannot control the border and they cannot control the fact that the Biden administration must spend your tax dollars to support this record surge of illegal immigration.
Not to mention Biden’s approval ratings which are terrible in part because of the failures of his aggressive anti fossil fuel agenda. We know that that US automakers are losing incredible amounts of money.
The Biden-Harris Administration brags that their Investing in America agenda has already catalyzed more than $860 billion in business investments through smart, public incentives in industries of the future like electric vehicles (EVs), clean energy, and semiconductors. Yet based on the track record in the real-world, money looks like it has been wasted if the US automakers must retreat from producing a product that the government wants to force people to buy but nobody wants. Which is probably a good definition of the failures of Bidenomics.
So how does Biden respond to the failure of his electric car push? Very simply by putting tariffs on China and blame them for their own failures. It’s the same playbook as blaming the automakers or the food makers for inflation without stopping to have any self-awareness that their policies of spending and printing money are the main causes of inflation if not the only cause. So the Biden administration says that the tariff rate on electric vehicles will increase from 25% to 100% in 2024. The tariff rate on lithium-ion EV batteries will increase from 7.5%% to 25% in 2024, while the tariff rate on lithium-ion non-EV batteries will increase from 7.5% to 25% in 2026. The tariff rate on battery parts will increase from 7.5% to 25% in 2024. That is going to make US electric cars even more expensive to produce because at the same time Biden is mining for the materials needed to make lithium batteries here in the United States. Stop and think about that for a while. The tariff rate on solar cells (whether assembled into modules) will increase from 25% to 50% in 2024. And I could go on but you kind of get the gist.
Biden’s agenda, when it comes to energy, isn’t really about energy security for the United States. As he has said himself, it’s more about trying to incorporate environmental justice for perceived wrongs to people of color in the past. It is also because Biden says he sees climate change as an existential threat even more dangerous than Iran, Hamas, Hezbollah, Russia, North Korea and other terror networks. Yet Russia continues to try to establish its dominance in global energy production. Russian have laughed off the price caps when it comes to their energy and that has not stopped Russia’s oil revenue from soaring. Russia’s federal budget revenues from the oil and gas industry showed a significant increase to 4.2 trillion rubles ($45.7 billion) in the January-April 2024 period, 82.2% higher than in the same period last year, the country’s Finance Ministry announced on Monday.
Russia reports they have discovered oil and potentially will claim that discovery on waters that are not theirs. The Guardian reported this week that, “Russia has found vast oil and gas reserves in the Antarctic, much of it in areas claimed by the UK. The surveys are a prelude to bringing in drilling rigs to exploit the pristine region for fossil fuels, MPs have warned. Reserves totaling 511bn barrels of oil – about 10 times the North Sea’s entire 50-year output – have been reported to Moscow by Russian research ships, according to evidence given to the Commons Environment Audit Committee (EAC) last week.
We also will look at the American Petroleum Institute supply report. There will be a focus on gasoline demand that in recent weeks has been pretty pathetic. Most people expect an uptick as the weather improves but we continue to see the stress of the American consumer play out on the open road. Bullish gasoline spreads that normally flourish this time of year continue to struggle. Today could be a very key day for the RBOB gasoline futures. Diesel prices have struggled as farmers have struggled to get the crop in as planting delays are hurting demand.
The natural gas recovery has been good to see for many producers as it has been a demand led recovery. There are increase flows to LNG export trains that has been a savior for the beleaguered market. While the Biden administration plays politics with liquefied natural gas which arguably could be the most important fuel source to drive the global economy, Qatar is looking to regain its position as one of the dominant players. Blomberg reports that, “With its 2030 LNG expansion plan, Qatar is looking to solidify its position as one of the world’s biggest producers of the fuel along with the US and Australia. Total Energies, Exxon, Shell and other international oil majors are shareholders in the first two phases of the project.
Read Full Story »»»
DiscoverGold
Natural Gas Surges to New Highs, Faces Potential Resistance Zone
By: Bruce Powers | May 13, 2024
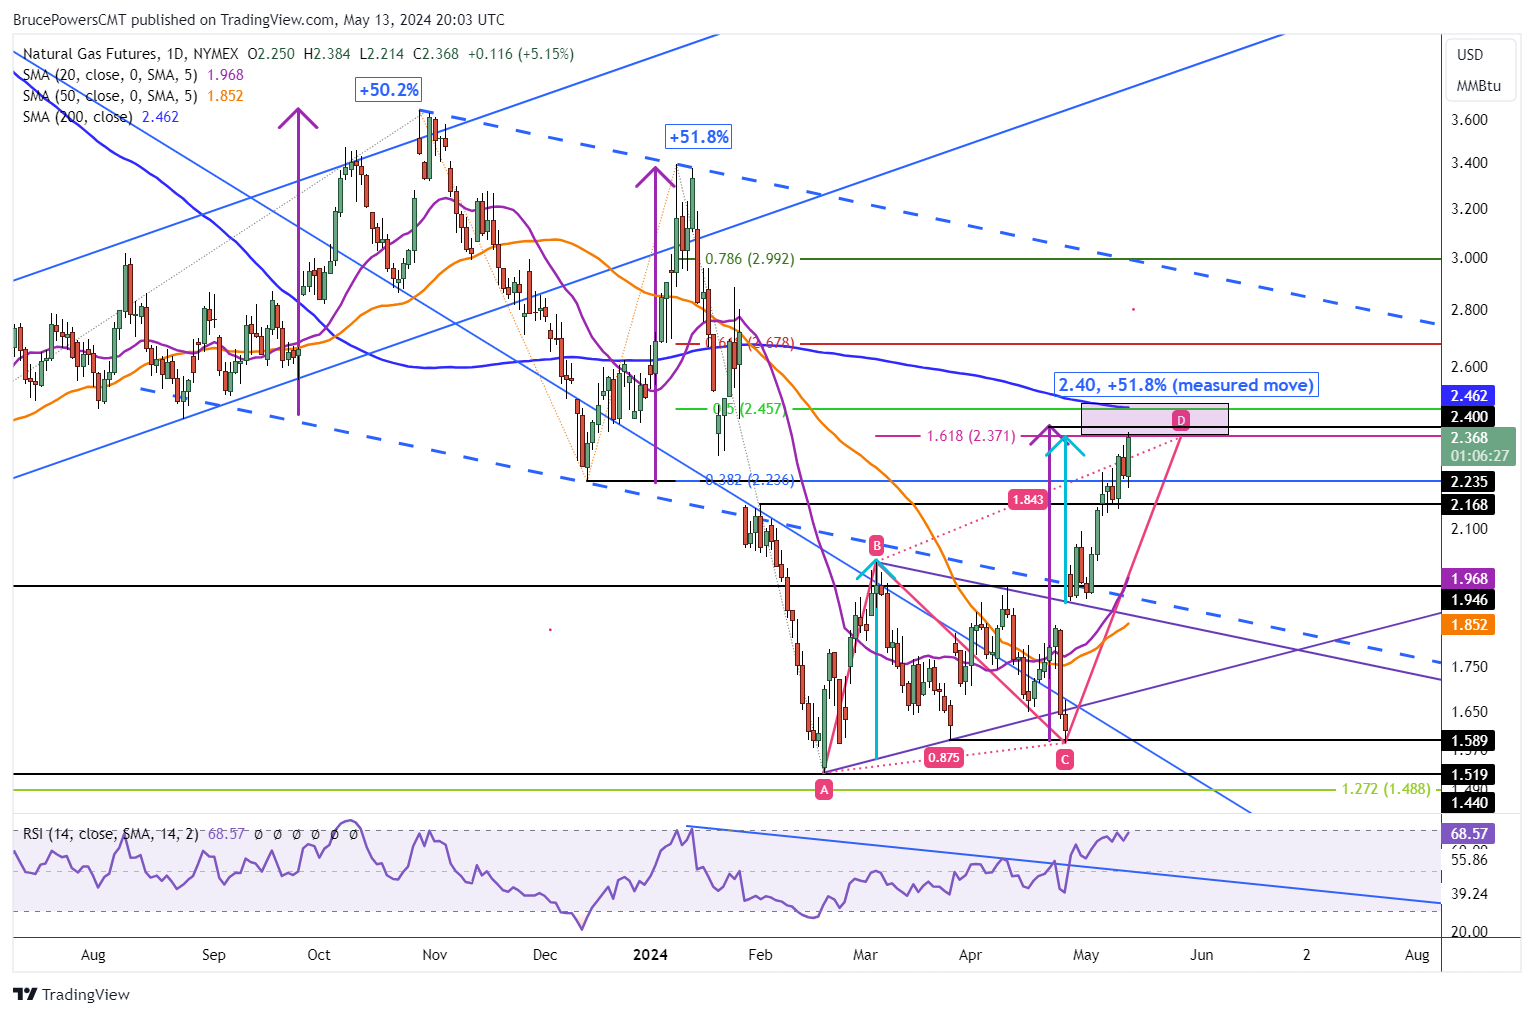
• Technical analysis highlights potential price reversal for natural gas, with resistance at 2.37 to 2.46 indicating a potential turning point.
Following a drop below Friday’s low earlier in Monday’s session, natural gas rallied to a new trend high, generating a bullish outside day. In addition, last week’s high was exceeded. If today’s close is above last week’s high of 2.34, another bullish clue will be indicated.
Demand remains strong at the time of this writing as trading continues near the highs of the day, which currently is 2.38. Natural gas has entered the start of a potential resistance zone that begins at 2.37 and ends around the 200-Day MA, now at 2.46. That range is derived from several pieces of analysis.
Weight of Technical Evidence
Like criminal investigations shown on TV, technical analysis also looks at the weight of evidence to assist in identifying what the market might be telling us. Clues are provided in price behavior and price patterns. The approaching resistance zone is a good example of this as there are at least five pieces of analysis pointing to potential resistance in the range of 2.37 to 2.46.
In other words, there is a confluence of potential price targets in that range. Either could turn the market down on their own. But when combined relatively close together they provide a warning sign to pay extra attention to price action as the zone is entered. And for simplicity, not all clues are included in today’s article.
Confluence of Price Targets from 2.37 to 2.46
The specific price levels identified are 2.37, 2.40 and 2.46. Two indicators point to 2.37, the completion of a rising ABCD pattern extended by the 161.8% Fibonacci ratio, sometimes referred to as the golden ratio, and a target from the bottom symmetrical triangle consolidation pattern (light blue arrows).
Next is the 2.40 price target. It is derived from the completion of a measured move that matches the percentage rise in the price of natural gas from the December 13 swing low. The December 13 rally ended with a 51.8% advance in the price of natural gas. Similarly, the current rally from the April 25 swing low, will be up by 51.8% at a price of 2.40.
Read Full Story »»»
DiscoverGold
YE Old Oil Conundrum. The Energy Report
By: Phil Flynn | May 13, 2024
If you wonder why U.S. consumer confidence is as bad as it is, just look at oil and gasoline. The price of oil is 8.7% higher than it was a year ago. The cost of gasoline is higher, even as consumers are consuming less of it. According to AAA, the cost of Regular Unleaded Gasoline is $3619 a gallon up from $3.537 a gallon a year ago. This comes as the Energy Information Administration reported that over the past four weeks, gasoline demand averaged 8.6 million barrels a day, down by 4.0% from the same period last year. And while we expect to see an uptick in demand as the weather warms up, it’s clear that consumers are feeling more stress from the inflationary policies of the government.
Oil is trying to bottom out as it looks ahead to what should be a very tight market globally. The demand for oil should be very close to record high even as we seem to be sputtering a bit here in the United States. The global supply and demand balance for oil, gasoline and diesel is still extremely tight. The oil market recently has taken a lot of war premium out of the price of oil. While the world is still a dangerous place with the Israeli movement on Rafah and the threats from Hezbollah and Houthi rebels, we haven’t seen a major disruption due to these tensions. We do know that the tightness of supply of oil and gas really is going to put more pressure on the Biden administration that is seeing its approval ratings plunge in every major poll. Why? It’s the economy stupid.
The Biden administration’s green energy policies have had a major part in raising the cost of oil and gasoline. There policies discouraged investment in gas but overregulation and threats against the oil and gas industry are going to increase inflationary pressures.
You can give tax breaks to electric cars, but you can’t make people buy them. The amount of money US automakers are bleeding with electric cars is almost amazing. The auto industry only moved into electric cars because the Biden administration promised massive subsidies and even with massive government subsidies you can’t sell an inferior product. Most Americans realize, for their needs, the electric car is impractical. Still the Biden administration refuses to back down on this electric car fantasy.
I have always supported all exploration and sources of energy from the very beginning. For many years I pointed out that this dream of an electric car transition was not possible. We do not have the power grid to support this along with the new demands for power coming from artificial intelligence, cryptocurrency mining and other power generated businesses. It also never makes sense from an environmental standpoint because it takes so much more fossil fuels to create an electric car and there’s very little benefit until these cars are on the roads for a very long time. While electric cars can be part of the solution, they will never be efficient enough to carry the entire U.S. economy on its back or on its wheels.
US carmakers are losing so much money on EVs, the Biden administration’s only plan is to try to put on sanctions on Chinese electric vehicles. Bloomberg News reports that, “Joe Biden will quadruple tariffs on Chinese electric vehicles and sharply increase levies for other key industries this week, unveiling the measures at a White House event framed as a defense of American workers, people familiar with the matter said. Biden will hike or add tariffs in the targeted sectors after nearly two years of review. The total tariff on Chinese EVs will rise to 102.5% from 27.5%, the people said, speaking on condition of anonymity ahead of the announcement. Others will double or triple in targeted industries, though the scope remains unclear according to Bloomberg.
Oil traders were very nervous over the weekend that Iraq did not plan to go along with the OPEC plus production cuts. Reuters reported that, “Iraq is committed to voluntary oil production cuts agreed by the Organization of the Petroleum Exporting Countries (OPEC) and is keen to cooperate with member countries on efforts to achieve more stability in global oil markets, Iraq’s oil minister told the state news agency on Sunday. The minister’s comments followed his suggestion on Saturday that Iraq had made enough voluntary reductions and would not agree to any additional cuts proposed by the wider OPEC+ producer group at its meeting in early June.
In Fact according to S@P Global OPEC crude oil production contracted 210,000 b/d in April to its lowest since August 2023 (not including Angola), but members subject to output quotas were still a collective 249,000 b/d above their caps.
Vindictive Joe Biden and his team of regulators are now going after big oil in the US adding to OPEC’s dominance. Last week they accused Scott Sheffield, the former CEO of natural resources, of attempting to collude with OPEC and its allies to increase prices. That opened a can of worms according to the Financial Times that will add even more to the cost of oil and gasoline. Not only do U.S. oil and gas industries have to compete with the likes of OPEC but they really have to compete and defend themselves against US regulators that seem to have a target on their backs. The Financial Times reported, ”The US shale oil industry faces a barrage of lawsuits alleging some of the largest companies in the sector colluded to curb output and raise prices, after similar claims were made by US antitrust regulators. ExxonMobil, Occidental Petroleum and Diamondback Energy are among the companies named in at least 10 class actions alleging they conspired to co-ordinate and constrain shale oil production, which had the effect of raising US retail petrol prices.”
Of course what they don’t tell you is that if the US oil and gas industry didn’t crack the shale oil code, we would all be paying much higher prices for oil and gasoline. Without the US shale industry we would be totally dependent on OPEC and Russia and Canada for our supplies. Our economy would be subservient to these oil producers. The Biden administration seems to want to lash out with regulations as opposed to understanding the challenges that the US oil and gas industry has to deal with in the real world not in the fantasy electric car world. This is a world where’re the demand for oil and coal and gas will reach all-time highs. This is a time when we should allow the US oil and gas industry to prosper because they are trying to power the US economy and increase our national security.
We all know about the vicious boom and bust cycles in the oil and gas market. It was not too long ago where we saw the oil and gas industry in the United states brought to its knees because of production war in OPEC. They saw the prices fall below zero and that threatened to put many U.S. oil and gas producers out of business. Without quick and decisive action by President Donald Trump, we would already be more dependent on Russia and OPEC for supply. Trump’s actions have kept prices from being much higher than they are today.
This comes from an administration that has put a target on the backs of the US oil and gas industry from day one. Biden killed the Keystone Pipeline for purely political reasons and added a slew of new regulations that could force many U.S. oil and gas producers out of business. Biden’s drilling moratoriums on federal lands and the politically motivated pause of LNG export terminal approvals have hurt us economically. This administration has total disdain for U.S. oil and gas industry yet they don’t have a realistic replacement. Instead, they push billions of dollars of taxpayer money into green energy boondoggle to try to show how they have virtue on climate change while the reality is sadly the opposite.
Despite the challenges last week in the week market action we do expect the market to bottom very shortly. Look to get hedged on oil and gas and look to buy option plays. Need ideas and which ones to buy, give me a call.
Natural gas is back from the dead! EBW analytics reports: the June contract launched higher last week as pipeline maintenance ratcheted back supply, Freeport returned all three LNG trains to service, and the technical outlook invited algorithmic buying—collectively sparking a short squeeze leading prices as high as $2.344. Over the weekend, ebbing pipeline maintenance allowed pipeline scrapes to indicate a five-week high in production and near-term consolidation is probable. Still, the rapid surge in NYMEX futures is indicative of medium-term upside potential into the summer season.
Read Full Story »»»
DiscoverGold
Commodity price changes over last year
By: Charlie Bilello | May 8, 2024
• Commodity price changes over last year
Cocoa: +191%
Copper: +16%
Gold: +14%
Aluminum: +10%
Brent Crude: +9%
WTI Crude: +8%
Zinc: +8%
Coffee: +7%
Silver: +7%
Heating Oil: +4%
US CPI: +3.5%
Gasoline: +3%
Wheat: -3%
Cotton: -7%
Sugar: -9%
Soybeans: -14%
Corn: -23%
Natural Gas: -24%
Read Full Story »»»
DiscoverGold
WTI Crude Oil CoT: Peek Into Future Through Futures, How Hedge Funds Are Positioned
By: Hedgopia | May 11, 2024
• Following futures positions of non-commercials are as of May 7, 2024.
WTI Crude Oil: Currently net long 214k, down 45.7k.

West Texas Intermediate crude rose 0.2 percent to $78.26/barrel this week, but oil bulls were on the defensive. The crude has been under pressure since tagging $87.67 on April 12th, having rallied from $67.71 last December.
This week, WTI dropped as low as $76.89 on Wednesday before bids showed up, but that was not enough to push it past the 200-day at $80.05, with the crude under the average for eight sessions now. The 50-day is above at $81.78.
Last week, the crude fell back into a well-established range between $71-$72 and $81-$82 that persisted for 19 months before the upper end gave way six weeks ago. This Friday, it rallied as high as $79.96 before sellers showed up.
If there is any consolation for the bulls, it is that Wednesday’s low successfully tested a rising trendline from last December’s low, for a weekly doji. That said, odds favor a breach ahead.
In the meantime, US crude production in the week to May 3rd was unchanged for nine consecutive weeks at 13.1 million barrels per day; 11 weeks ago, output was at a record 13.3 mb/d. Crude imports increased 197,000 b/d to seven mb/d. As did gasoline and distillate inventory, which respectively rose 915,000 barrels and 560,000 barrels to 228 million barrels and 116.4 million barrels. Crude stocks, however, dropped 1.4 million barrels to 459.5 million barrels. Refinery utilization rose one percentage point to 88.5 percent.
Read Full Story »»»
DiscoverGold
NY Crude Oil Futures »» Weekly Summary Analysis
By: Marty Armstrong | May 11, 2024
This market made a new high today after the past 2 trading days. The market opened higher and closed lower making it an outside reversal to the downside warning that a further decline is possible. Our projected support for tomorrow's closing lies at 7780. Therefore, the closing below the previous low creates an outside reversal to the downside which was a very dramatic swing of 2.27%. Volatility notwithstanding, the market finished on the weak side and it remains below all our internal momentum cyclical support models as well. We have elected 3 Bearish Reversals from the cyclical high established on 05/10.
Up to now, the market remains neutral on the momentum indicator yet bearish on the short-term trend indicator while the long-term trend and cyclical strength are bearish. This market is also trading mostly above the bank of eight moving average indicators suggesting it remains in a mixed posture for now.
During the last session, we did close above the previous session's Intraday Crash Mode support indicator which was 7595 settling at 7926. The current Crash Mode support for this session was 7830 which we penetrated intraday and closed below warning this market is in a panic type sell-off. The Intraday Crash indicator for the next session will be 7751. Remember, opening below this number in the next session will warn that the market may enter an abrupt panic sell-off to the downside. Normally, when you open back above this pivot number or closed back above it then the sell-off is subsiding. So, watch this number which is dynamic for it changes with each session. The Secondary Intraday Crash Mode support lies at 7510 which we are trading above at this time. A breach of this level with a closing below will signal that a sharp decline is possible.
Intraday Projected Crash Mode Points
Today...... 7830
Previous... 7595
Tomorrow... 7751
This market has declined 10% from the last important cyclical high of 8767. Since that last important cyclical high, the market has made lower low of late over the course of the last 1 event.
ECONOMIC CONFIDENCE MODEL CORRELATION
Here in NY Crude Oil Futures, we do find that this particular market has correlated with our Economic Confidence Model in the past. The Last turning point on the ECM cycle low to line up with this market was 2020 and 2009 and 2001 and 1998 and 1994. The Last turning point on the ECM cycle high to line up with this market was 2022 and 2018 and 2011 and 2000.
MARKET OVERVIEW
NEAR-TERM OUTLOOK
The historical broader tone of the NY Crude Oil Futures has been a bearish consolidation following the high established back in 2008. Since then, this market has created 2 reaction highs which have been unable to break this overall protracted bearish consolidating trend. Still, the major low was made in 2023 and the market has bounced back for the last year. The last Yearly Reversal to be elected was a Bullish at the close of 2023.
This market remains in a positive position on the weekly to yearly levels of our indicating models. Nevertheless, it closed last year on the weak side down from 2022. Pay attention to the Monthly level for any serious change in long-term trend ahead.
Looking at the indicating ranges on the Daily level in the NY Crude Oil Futures, this market remains moderately bearish position at this time with the overhead resistance beginning at 7841 and support forming below at 7755. The market is trading closer to the resistance level at this time.
On the weekly level, the last important high was established the week of April 8th at 8767, which was up 17 weeks from the low made back during the week of December 11th. We have seen the market drop sharply for the past week penetrating the previous week's low and yet it recovered to close above the previous week's close of 7811. We are trading below the Weekly Momentum Indicators warning that the decline is very significant and we need to pay attention to the timing and reversals. When we look deeply into the underlying tone of this immediate market, we see it is currently still in a weak posture. Immediately, this decline from the last high established the week of April 8th has been important closing sharply lower as well. Before, this recent rally exceeded the previous high of 7960 made back during the week of November 27th. Nonetheless, that high was actually lower than the previous high made the week of October 16th suggesting this market has really been running out of sustainable buying for right now. This immediate decline has thus far held the previous low formed at 6771 made the week of December 11th. Only a break of that low would signal a technical reversal of fortune and of course we must watch the Bearish Reversals. Right now, the market is below momentum on our weekly models casting a bearish cloud over the price action. Looking at this from a wider perspective, this market has been trading up for the past 21 weeks overall.
INTERMEDIATE-TERM OUTLOOK
YEARLY MOMENTUM MODEL INDICATOR
Our Momentum Models are declining at this time with the previous high made 2021 while the last low formed on 2023. However, this market has declined in price with the last cyclical low formed on 2023 warning that this market remains weak at this time on a correlation perspective declining in both price and Momentum.
Looking at the longer-term monthly level, we did see that the market made a high in September 2023 at 9503. After a four month rally from the previous low of 8346, it made last high in September. Since this last high, the market has corrected for four months. However, this market has held important support last month. So far here in May, this market has held above last month's low of 8070 reaching 8070.
Some caution is necessary since the last high 9503 was important given we did obtain one sell signal from that event established during September 2023. That high was still lower than the previous high established at 12368 back during June 2022. Critical support still underlies this market at 6700 and a break of that level on a monthly closing basis would warn of a further decline ahead becomes possible. Nevertheless, at this time, the market is still weak trading beneath last month's low.
DiscoverGold
Natural Gas Potential Retreat or Further Rally Ahead?
By: Bruce Powers | May 10, 2024
• Natural gas surged to new highs before meeting resistance, with potential for a retreat or further rally depending on key support and resistance levels.
Natural gas rises to a new trend high before hitting resistance at 2.34, the high for the day. It sold off from there intraday and is trading near the lows of the day at the time of this writing. Today’s high was a little shy of the next potential resistance zone, which begins at 2.37. It put the price of natural gas 48.1% above the April 25 swing low at 1.58.
Thursday was a wide range day and a little pause in the ascent is to be expected. It remains to be seen whether today’s high leads to a deeper retracement and it won’t be apparent unless yesterday’s low of 2.15 and the five-day low of 2.13 are broken to the downside. Until then the possibility of testing higher price levels remains.

Upside Target at 200-Day Moving Average
The 200-Day MA is at the top of the next higher price range at 2.46, along with the 50% retracement. These indicators themselves provide a realistic higher target for the current rally. However, there are several other factors that point to a price range from 2.37 to 2.46 as being significant. This doesn’t mean that higher prices are reached, but they could be. The 2.37 price level is identified twice. It is an initial target derived from measuring the bottom symmetrical triangle that natural gas broke out of on April 26. Also, a rising ABCD pattern with the CD leg extended by 161.8% of the AB leg completes at that price.
Measured Move Targets 2.40
There is also the completion of a measured move at 2.40. The measured move identifies price symmetry with the last large rally that began from the December swing low. During that advance the price of natural gas increased by 51.8%. On a percentage basis the current rally will match at 2.40. Again, this doesn’t mean it will be reached but when there are five indications identifying a similar price area, some attention is warranted.
Weekly Close May Provide a Clue
Since the week is about to end, the closing price relative to the week’s trading range may provide some guidance. In general, the higher natural gas closes above the halfway point of the weekly range, the stronger the close. The halfway point is at 2.24. Also, this week’s low of 2.13 is a key pivot level as it is a third sequential higher weekly low.
Read Full Story »»»
DiscoverGold
Crude Oil Continues to See Support
By: Christopher Lewis | May 10, 2024
• The oil market has seen a bit of buying this past week, after initially falling a bit. A this point, I suspect there is a lot of buying pressure underneath current levels.
WTI Crude Oil Weekly Technical Analysis
The West Texas Intermediate crude oil market initially started falling during the week but then turned around to show signs of strength. It looks as if we are threatening the $80 level which of course is a large round psychologically significant figure. It’s probably also worth noting that the 50% Fibonacci retracement level has offered support and therefore technical traders will be paying close attention.
If we can break above the $80 level, then I suspect that we will get more money flowing into the market, and this does make sense considering this time of year is typically a big travel season time. If we break above the $80 level, then it could very well send this market looking to the $82.50 level. Short-term pullbacks should more likely than not end up being buying opportunities.
Brent Crude Oil Weekly Technical Analysis
Brent has done the same thing and initially peaked just below the 50% Fibonacci retracement level only to turn around and rally towards the $84.50 level. If we can break above that, then we could go look into the $87.50 level and then eventually $90 above. Keep in mind that markets are not pricing in anything along the lines of a geopolitical risk and that is something that is a major influence on what could happen.
Perhaps some of the value traders and investors have stepped in and recognized that. Maybe that’s what this last week has been about. I do favor the upside. I don’t necessarily think we’re going to have a massive spike higher, but I do think that we will go higher from here. That being said, it doesn’t mean we go straight up in the air, just that we have a lot of reasons to continue to the upside.
Read Full Story »»»
DiscoverGold
Real Pain At The Pump. The Energy Report
By: Phil Flynn | May 10, 2024
The oldest gas price cliche in the oil industry and media is to say that when gasoline prices go up we feel “pain at the pump” or some derivative of that. The reason why we use the “Pain at the pump” phrase is there’s probably no other commodity in America that reflects the feeling of financial independence and confidence than the cost of a gallon of gasoline. The reason for that is gasoline is a necessity for almost every American whether they’re retired, going to work or maybe a vacation! In fact, even if you don’t drive an internal combustion engine vehicle or any vehicle at all, the cost of gasoline can impact you because it can raise the cost of other goods we all buy.
The Energy Information Administration (EIA)is predicting that U.S. retail gasoline prices across the United States will average near $3.70 per gallon from April through September, which is similar to prices during the same period last year. The fact is the current price of gasoline is weighing on the psyche of Americans at a very high level which is a warning sign perhaps for the over all health of our consumer driven economy. You can look at the cost of gasoline in gasoline demand and that can sometimes give you a better judge of the state of the US consumer than any consumer confidence index that’s been released.
We can clearly see the angst of the gas consumer because even as the current gas price according to AAA has fallen about 3 cents from a week ago to $3.636 cents a gallon, prices are still 10 cents a gallon higher than a year ago and that is taking a toll on demand as consumers are being hit not only with higher gas prices but inflation pressure that is unlike anything many Americans have seen in their lifetime.
The EIA showed that motor gasoline demand averaged 8.6 million barrels a day, down by 4.0% from the same period last year. So the question becomes whether that drop in demand is transitory or is it indicative of a potential consumer led recession. The University of Michigan consumer confidence reading is today but if you look at the last consumer confidence that we got from the Conference Board, it showed that consumer confidence fell for the third straight month and fell to the lowest level in nearly two years.
That is a concern because inflation is just killing the consumer. It also has huge ramifications for politics because the party in charge usually gets blamed for what’s wrong with the economy. And we know what’s wrong with the economy is inflation. And most economists know what causes inflation. Milton Friedman, the American economist from the University of Chicago who received the 1976 Nobel Memorial Prize in Economic Sciences, said it best that the only cause of inflation is government and only government, by changing their spending and money printing ways, can end it.
So again, the gasoline prices are really becoming a problem for Biden. Americans know Biden owns these higher gasoline prices. The average price of gasoline under President Trump was $2.57 a gallon for regular unleaded, and under Biden it’s over a dollar higher today. I heard one Biden apologist say when you look at the price of gasoline and you adjust it for inflation it’s not that bad. I wouldn’t suggest that Biden put that on a bumper sticker.
Americans know that Biden is overseeing one of the biggest bouts of inflation in recent history and as economist Steve Moore points out, Biden’s claim that inflation was 9% when he came into office was wrong. He said the reality is inflation was at a modern era low of 1.4% when Joe Biden took office and while the market did have to spend a lot of money to handle the pandemic shutdown, the real problem with this inflation is that Biden continues to spend money like a drunken sailor. In fact Biden’s only plan to address any problem is to just spend money.
His other plan is to malign the US oil and gas industry. No president has been more anti-American oil and gas in history. No president has ever issued as many executive orders as possible against oil and gas in history. The latest threat from Biden to US oil and gas is being reported by Bloomberg this morning. They reported that, “Climate activists who successfully pushed President Joe Biden to halt new US liquefied natural gas exports are setting their sights on proposed crude oil shipping facilities, after the administration approved a massive petroleum terminal last month. The administration should stop approvals of deepwater oil export facilities and reevaluate its approval process, the Sierra Club wrote on behalf of nearly 20 environmental and community groups in a letter Thursday to the White House and the Department of Transportation.” We know from Biden’s past decisions that he recently has been tending to give into pressure from the environmental fringe as he is desperate to keep their votes. Now here’s a tiscut and a tariff and a red and yellow basket.
Bloomberg reports that Joe Biden is set to unveil China tariffs as soon as next week, targeting key sectors including EVs, batteries and solar equipment. He’s expected to reject the across-the-board tariff hikes sought by Donald Trump. Biden just likes to do everything different from President Trump just because he despises the man. Whether it’s reversing President Trump’s border policy or his energy policies. Biden hands shifted gears and because of that, we’re seeing the results at the gas pump and when it comes to inflation.
So, you can see that oil is set for a weekly gain rate cut expectations have gone up and the geopolitical risk factors to oil have not gone away. We have seen a week where it’s very clear that OPEC is more than likely going to extend their production cuts into the end of the year with the possibility they will run into next year. We are seeing signs that the US energy industry may hit peak oil production because of new regulations put into place by the Biden administration. Reuters reported earlier this week that, “Republican presidential candidate Donald Trump vowed to reverse dozens of the Biden administration’s environmental rules and policies at a meeting with top U.S. oil executives, where he also asked them to raise $1 billion for his presidential campaign, the Washington Post reported on Thursday.
We still believe the weight to be long on breaks and we still think that people should be prepared for significant upside price risk.
Natural gas is really popping up after a bullish report yesterday. It looks like the worst is over for natural gas in the short term and the market looks like it’s breaking out. That is welcome news for many. Natural Gas hit a 14-week high on Monday and now with the bullish report it looks like we’re going to start going back up. Scott Disavino Reuters said that, “forecasts for higher demand over the next two weeks than previously expected as feedgas to liquefied natural gas (LNG) export plants increased with the return of Freeport LNG in Texas.
Read Full Story »»»
DiscoverGold
Gold Shows an Oil Price Bottom Ahead
By: Tom McClellan | May 9, 2024

Gold is valuable, not just as a tradable commodity, but because it knows things about the future which are useful. One of the things that gold knows is what crude oil prices are going to do.
The chart this week shows gold prices shifted forward by 19.8 months, and compared to crude oil prices. This time shift is done to better portray how gold's price movements get echoed after that length of time in the movements of oil prices.
This is assuredly not a perfect model, just a really good one. Occasionally it gets out of whack, most recently when Russia invaded Ukraine and disrupted the oil market in the process. But after every episode of the correlation getting weird, prices work extra hard to get back on track again.
Coming up, this model says that we have a bottom due in mid-2024, followed by a rise toward the end of the year. That oil price rise is not going to be good news for any federal politicians who may be running for reelection in November. And if the recent rally in gold prices (just off the right end of this chart) keeps going higher, that is going to mean higher oil prices 19.8 months later.

The chart below zooms in on this same comparison, and shows us that when we get up close, the correlation is not as tight.
In late 2023, crude oil prices turned down early and missed a top which gold had said should have come later in 2023. Since then, though, oil prices have gotten back on track again.
This chart says that the upcoming bottom is ideally due in June to July 2024. I would not recommend taking that literally, since actual arrivals of the turning points can be a little bit early or late, and still be considered "normal". The message one should take from this relationship is that a bottom is ahead, and still with more price damage before that bottom arrives. Then as summer gets closer, we should turn to other indicators to home in on signs that the price bottom for oil is arriving, and/or that an upturn is starting.
Tom McClellan
Editor, The McClellan Market Report
Read Full Story »»»
DiscoverGold
Natural Gas Targeting Higher Levels
By: Bruce Powers | May 9, 2024
• The current natural gas rally suggests a move towards 2.37-2.465, backed by various technical indications.
Natural gas triggered a bullish continuation today as it rallied above the prior trend high of 2.27. It is on track to possibly close above that price level and confirm the breakout. It will be a clearer sign of strength if it does close above 2.27. Resistance for the day was seen at a high of 2.31, an interim target defined from a prior swing low. Today’s advance followed a retest of support with a low of 2.15, before buyers took back control.
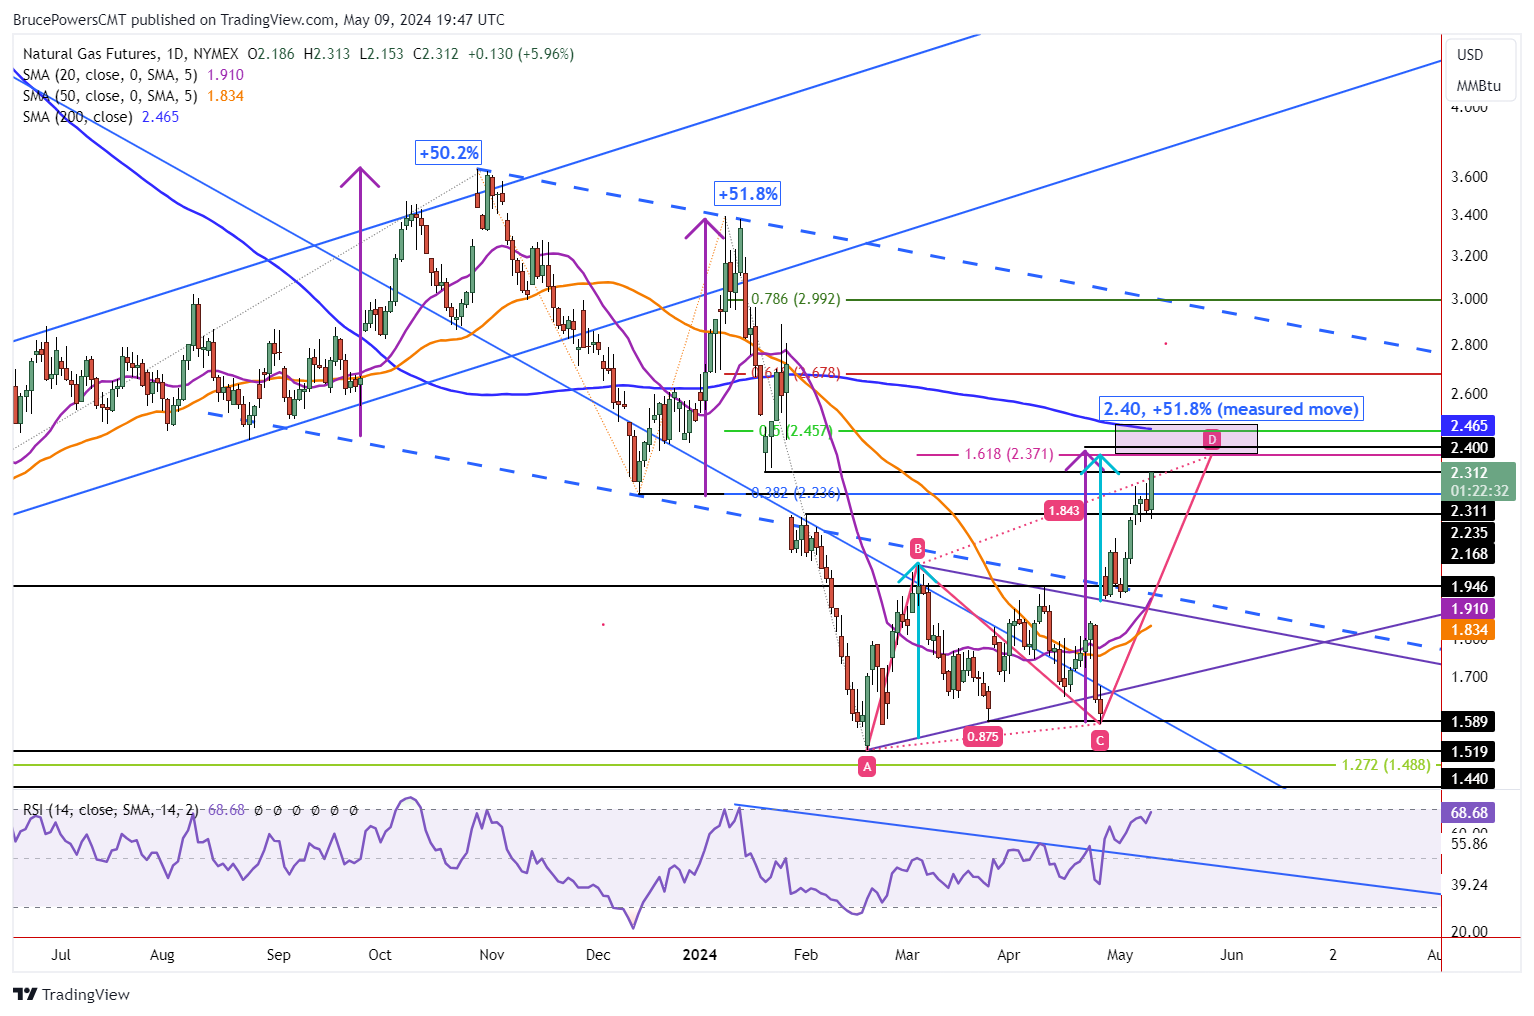
Bullish Price Action Improves Chance of Hitting 2.37 and Higher
Bullish price action seen today improves the chance that natural gas reaches the next higher target zone. It is anchored around the 200-Day MA, currently at 2.465. Given the current trajectory of the trend and the fact that the 200-Day line has not been tested as resistance since late-January, there is a good chance the 200-Day line may be reached. It is the top of a potential resistance zone that starts at 2.37, which is the completion of a rising ABCD pattern where the CD leg of the advance is 161.8% of the AB leg. Also, a minimum target from the bottom symmetrical triangle completes at 2.37 (light blue arrows).
Measured Move Completes at 2.40
A little higher, at 2.40, a measured move completes. That is where the current rally matches the advance from the December 13 low on a percentage basis. The December rise was 51.8% and the current rally matches at 2.40. It would reflect price symmetry between different swings. The December rally was the last advance that was greater than the previous three, which all followed the December rally. It is also close to a match with the rally that began from the August 24 swing low last year. And that rally was just prior to the December advance. Natural gas advanced by 50.2% from that low.
Can the price of natural gas extend beyond the 200-Day MA. Of course it can, but the resistance zone noted above is backed by multiple indications that a potentially significant resistance zone begins at 2.37. The risk of a retracement will be highest upon entering the 2.37 to 2.465 price zone.
Read Full Story »»»
DiscoverGold
Natural Gas Potential Pullback Ahead as Price Approaches Key Levels
By: Bruce Powers | May 8, 2024
• Natural gas price movement suggests potential for a deeper retracement, with key levels at 2.09, 2.01, and 1.95 to 1.93 on the downside.
Additional consolidation around this week’s high of 2.26 continues in natural gas today as it tests support around 2.17. The 2.17 price level was busted last week on the rally to the 38.2% Fibonacci retracement target zone and now is showing minor support. Further signs of strength were seen briefly earlier in today’s session as the 2.26 high was exceeded to reach 2.27. However, it looks like natural gas may end in the red and short-term bearish, in the lower third of the day’s price range. Subsequently, if it falls below today’s low of 2.17 a deeper retracement may be in the works. And a decline below Tuesday’s low of 2.14 would further secure the pullback.
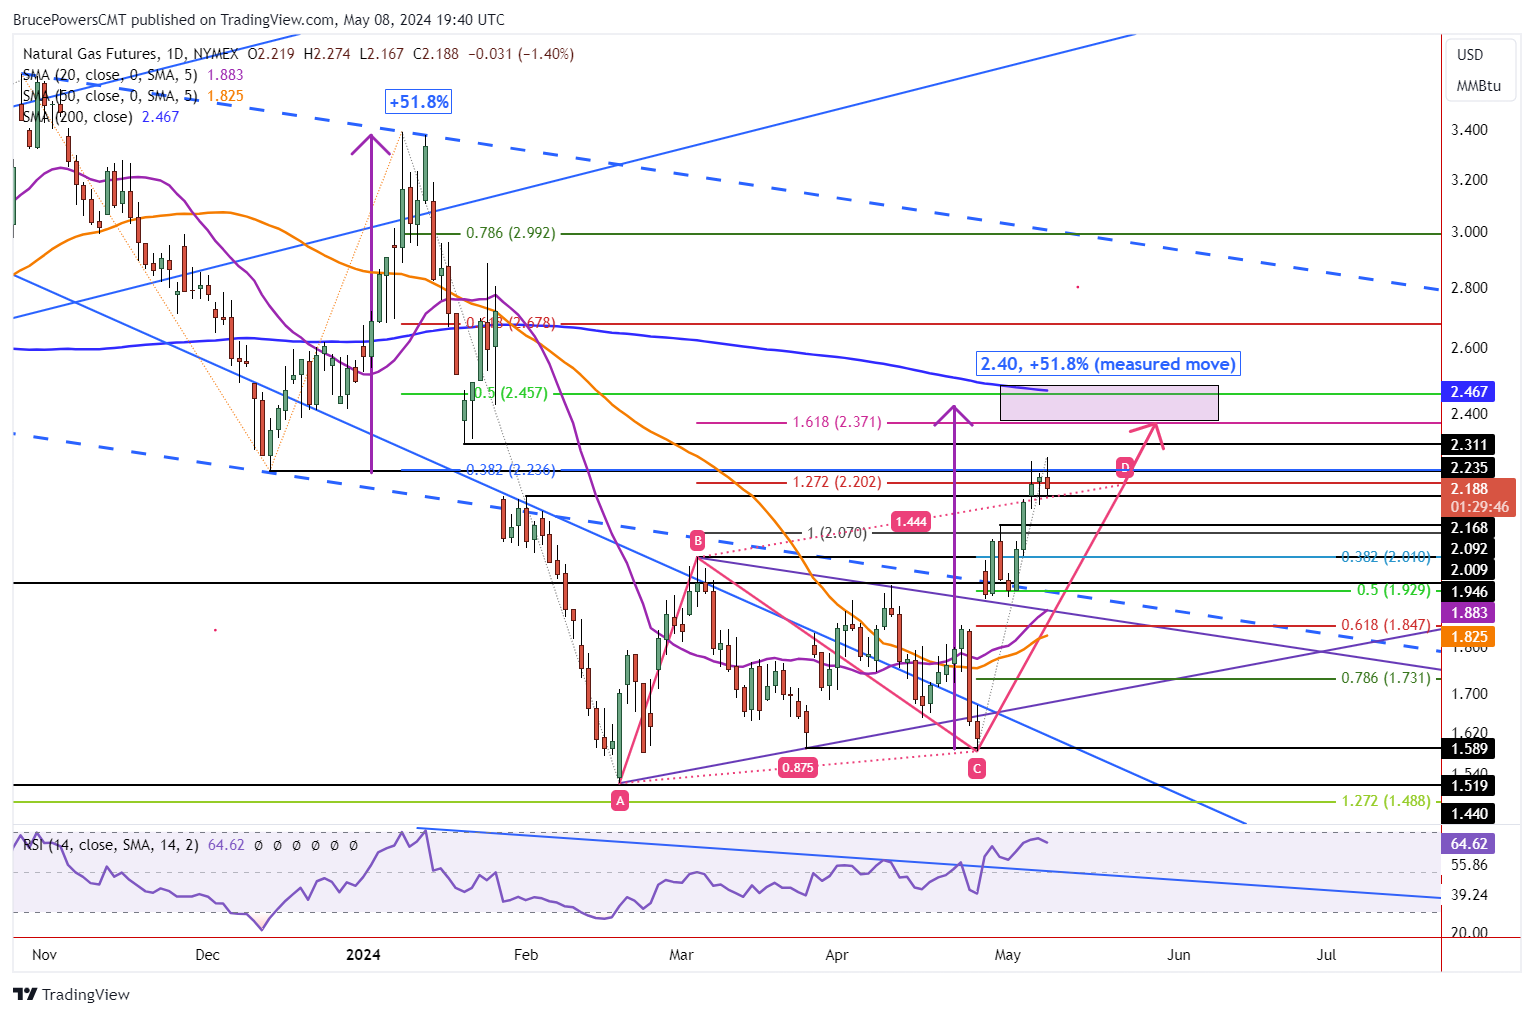
Failed Continuation
Price areas to watch on the way down include 2.09, 2.01, and a range from 1.95 to 1.93. The first level was previously the trend high from April 30. It is followed by the initial target from the rising ABCD pattern. And the lower range is derived from the April 2023 trend low and 50% retracement, respectively. Given today’s minor weakness following a new trend high, it looks likely that a pullback may come before new trend highs. Even if a new high is launched it may quickly encounter resistance as seen today as the launch pad is of questionable integrity.
Upside Target Begins at 2.37
Nevertheless, if the trend does continue higher, the next primary target zone is from around 2.37 to 2.47. The relatively long-range begins an approach towards the 200-Day MA at 2.40. A rising ABCD pattern with the CD leg extended by 161.8% of the AB leg is at 2.46. Moreover, a measured move completes at 2.40, followed by the 50% retracement at 2.37. The measured move is a match with the rally from the December 13 swing low on a percentage basis. That rally saw the price of natural gas rise by 51.8%. A similar percentage advance in the current rally completes at the 2.40 price level. The December 13 advance is being used as it was the largest advance of the past three rallies.
Read Full Story »»»
DiscoverGold
Crude Inventories Decline By 1.4 Million Barrels
By: Vladimir Zernov | May 8, 2024
Key Points:
• Strategic Petroleum Reserve increased from 366.3 million barrels to 367.2 million barrels.
• Domestic oil production remained unchanged at 13.1 million bpd.
• Oil prices rebounded from session lows as traders reacted to the report.
On May 8, 2024, EIA released its Weekly Petroleum Status Report. The report indicated that crude inventories declined by 1.4 milion barrels from the previous week, mostly in line with the analyst consensus. At current levels, crude inventories are about 4% below the five-year average for this time of the year.
Total motor gasoline inventories grew by 0.9 million barrels, while distillate fuel inventories increased by 0.6 million barrels.
Crude oil imports increased by 198,000 bpd from the previous week, averaging 7.0 million bpd. It should be noted that crude inventories declined despite the material increase in crude oil imports.
Strategic Petroleum Reserve increased from 366.3 million barrels to 367.2 million barrels as U.S. continued to buy oil for strategic reserves.
Domestic oil production remained unchanged at 13.1 million bpd, which is not surprising as oil prices have been moving lower in recent weeks.
WTI oil rebounded from session lows as traders reacted to the EIA report. Currently, WTI oil is trying to settle above the $78.50 level. The recent pullback was driven by the material decline in geopolitical risk premium for oil. Traders do not believe that Israel – Hamas conflict will lead to any disruptions in the oil supply.
Brent oil is trying to climb above the $83.00 level as traders focus on declining crude inventories in the U.S.
Read Full Story »»»
DiscoverGold
$OIL $XLE $BPENER - Recall we are under the kosh with the percentage of stocks on Point & Figure Buy signals having been up in reversal territory (Red Band)
By: Sahara | May 8, 2024
• $OIL $XLE $BPENER - Recall we are under the kosh with the percentage of stocks on Point & Figure Buy signals having been up in reversal territory (Red Band).
Where I showed the Bear 'Wedge's which have fulfilled their targets for the stocks...

Read Full Story »»»
DiscoverGold
Natural Gas Testing Resistance Levels Amidst Bullish Momentum
By: Bruce Powers | May 7, 2024
• As natural gas approaches resistance levels, a breakout above 2.23 could lead to testing higher potential resistance areas, including the 200-Day MA at 2.47.
Natural gas pauses its ascent to again test resistance around the 38.2% Fibonacci retracement, which is at 2.24. Today’s high was 2.23, at the time of this writing, and natural gas is poised to end Tuesday with an inside day bullish doji hammer candlestick pattern. It reflects continuing strength in the advance. Further, Monday’s high slightly exceeded the 38.2% resistance zone to reach a trend high of 2.26 before turning down. Another rise above the 38.2% price area could see a continuation of the rising trend if signs of strength continue thereafter.
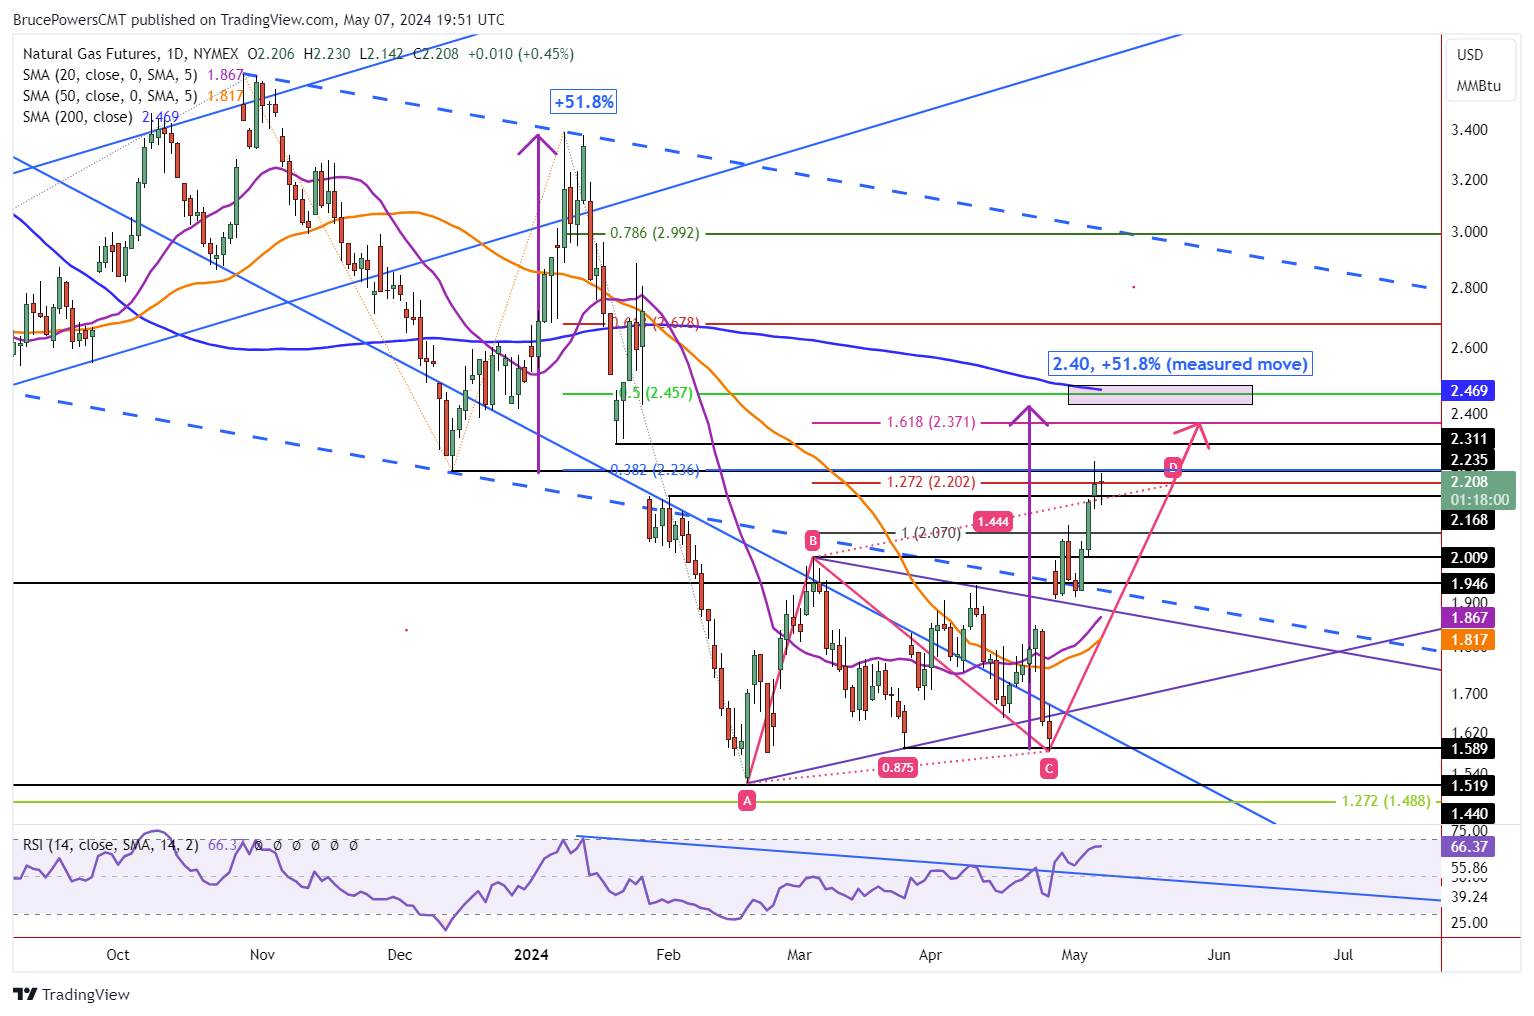
Inside Day Sets Up
An inside day provides a potential bull trend continuation setup. A decisive advance above today’s high would trigger the breakout. Then, further signs of strength should be seen to reflect increasing demand, including a daily close above today’s high. Once yesterday’s high is exceeded, the path is clear to test higher potential resistance areas. As noted in prior articles, the key higher price area to watch is around the 200-Day MA, now at 2.47. It is also marked by the 50% retracement at 2.46. In addition, a measured move completes at 2.40.
Measured Move Targets 2.40
The measured move is looking for a match with the mid-December rally on a percentage basis. That rally ended at a high of 3.39 to complete a 51.8% advance. A similar size move for the current rally completes at 2.40. It deserves attention especially since the target is close to the 200-Day line. When two or more indicators identify a similar price zone, it is the market’s way of identifying an area of interest. Since there is some distance to be traveled to approach the 200-Day line, it is anticipated to act as resistance on the first approach.
Watch Support on Deeper Pullback
Alternatively, if a deeper pullback happens before a bullish continuation, a drop below today’s low of 2.14 will provide the next sign of weakening. Yesterday’s low of 2.13 may act as near-term support, but if not the prior recent trend high at 2.09 is then a target. During uptrend, it is common for resistance around a prior trend high to act as support during pullbacks.
Read Full Story »»»
DiscoverGold
Interesting read
$WTIC $OIL - Seeking out the 3rd Target from that Bear Plot...
By: Sahara | May 7, 2024
• $WTIC $OIL - Seeking out the 3rd Target from that Bear Plot...

Read Full Story »»»
DiscoverGold
What Cut? The Energy Report
By: Phil Flynn | May 7, 2024
The oil market was trying to get its hands around the impact of Israel’s military operation in Gaza against a backdrop warning from a Chevron CEO about upside risk to the price of oil when Russia’s Alexander Novak seemed to pull cold water on one of the bullish oil market narratives.
Oil rose as Israeli forces took control of the Palestinian side of Rafah crossing in Gaza but was subdued as the operation looked very targeted and professional. That was after a desperate attempt by Hamas to try to convince the world that they have accepted the ceasefire proposal from Israel the only problem is that was not the ceasefire proposal that Israel offered.
While all the signs were pointing towards the fact that OPEC plus Russia was going to not only to follow through with their production 2.2 million barrel a day production cut into the end of the year possibly talk about extending those cuts into the New Year It was supposed to be augmented with makeup cuts from the producers like Kazakhstan and Iraq that had over produced.
And instead of that tidy little narrative overnight Russians Novak talked about the possibility of increasing oil production.
Novak suggested that under the OPEC deal, it may still be possible to increase oil production. He suggested that no deal has been agreed to and it’s still being analyzed by Russia.
Russia’s Novak of course has always played” bad cop” going into these OPEC plus meetings. Disagreement on production cuts years ago between OPEC and Russia was one of the reasons why they had a production war which eventually caused oil prices to crash to below zero. Novak said that “There is no need to predict further OPEC+ steps, we must look at the market.
And right now, based on the way the markets have been acting, OPEC needs to act as it seems like the market is less concerned about tight supply than it was just a few weeks ago.
Surprise increases in U.S. oil supplies and a drop in US exports suggest that perhaps global demand isn’t as strong as it should be.
John Kemp at Reuters points out that went through the wells calendar spreads have narrowed sharply over the last month in other words flipping from concerns about undersupply to supply so it will be more comfortable in the second half of the year.
If that is the case, then OPEC needs to show solidarity and continue along with their production cuts in Russia’s gentle threat that they could increase oil production is one of the reasons why oil prices have given up some of its gains overnight.
My take on this story from Russia is that it’s just typical pre-OPEC meeting positioning. I think OPEC plus Russia is gonna speak loud and strong because they don’t want to give up the dominance that they have achieved in securing its market share, While there are definitely some issues as far as producers that want to produce more that they will have to deal with I think that will be a problem for next year. I think the entire group realizes that they need to stick together, and they will probably achieve their objective of reducing global supplies in the next couple of months. That means that you should be prepared for upside price risks going forward,
As far as the geopolitical risk factors Biden administration as saying that, if need be, they will be able to tap the Strategic Petroleum Reserve even though they have taken steps to drain it down to its lowest levels in decades. President Joe Biden’s energy adviser Amos Hochstein said on Monday that the U.S. has sufficient supply of oil in the Strategic Petroleum Reserve to address any supply concerns and is monitoring markets on how to use it.
From a technical area of the market still looks extremely oversold at this point and more than likely as close to a bottom seasonal demand should pick up and it’s very clear that the Energy Information Administration has consistently underestimated demand for both gasoline and diesel.
This comes as the CEO of Chevron Mike Wirth is reiterating his warning that there are significant upside price risks to oil.
He also said that natural gas demand will rise on electricity consumption from data centers. He says that Wind and solar still face challenges meeting peak demand due their reliance on variable weather.
He says that reliable baseload power is needed to support renewables and natural gas is the most likely source, he said.
Remember how Transportation Secretary Pete Buttigieg was telling us what a great deal electric car were? Remember how he seemed to blame everybody for not buying that electric car when gasoline prices went up.
I assume he was talking about getting away so away from some of those gasoline taxes that the federal government collects or perhaps the state government collects, where the local government collects. Well now it appears that governments across the globe now want the drivers of electric cars to pay their fair share.
The Financial Times reports that ‘Global policymakers are imposing new taxes on electric vehicles as the shift away from combustion engines threatens to leave a $110bn hole in government revenues owing to a drop in receipts from fuel duties.” So the old adage remains, If you build it! They will tax it!
The UK, New Zealand, Israel and the majority of US states are among jurisdictions introducing tax changes and charges on EVs and hybrid vehicles designed to raise funds and compensate for declines in petrol and diesel excise taxes. The measures are varied, running from registration fees to road usage charges based on mileage and taxes on public charging points. EV owners and green campaigners say they will slow society’s switch from gas-guzzling vehicles to lower-emissions alternatives.”
Reuters is reporting that oil output at Kazakhstan’s giant oilfield Tengiz, operated by Chevron-led CVX.N Tengizchevroil, declined by 25% over May 1-5 from April’s average level to 474,000 barrels per day (bpd), a source familiar with the data told Reuters on Monday.
Natural Gas is risng as US production is falling and demand is rising. Nat gas production in the US fell to 96.9 in May down from 98.1 in April. Increased flows to Freeport and Delays in Cheniere maintenance is helping reduce the Nat gas glut. The long term outlook for gas is getting stronger as green energy realities are sinking in.
Oil Price reports that Back in January, Cheniere predicted that China’s demand for LNG exports could double over the next decade, as reported by the South China Morning Post (SCMP). In the U.S., electricity demand is expected to soar by up to 20% by 2030, based on April data from Wells Fargo, with natural gas demand potentially increasing by 10 billion cubic feet per day as a result. Additionally, Goldman Sachs predicts that natural gas will account for 60% of new electricity demand from data centers, compared to estimated 40% market share for renewables, with gas pipeline operators to benefit significantly.
Read Full Story »»»
DiscoverGold
If we can stay in the $75-$85 a barrel range for the short to mid-term I will be happy.
Natural Gas Bullish Continuation Stalls at Resistance Zone
By: Bruce Powers | May 6, 2024
• With natural gas reaching highs and strong upward momentum, a pullback may occur before a continuation higher, providing better risk-reward opportunities.
Natural gas advanced on Monday, reaching a high of 2.26, at the time of this writing. It was the third day in a row that it rallied. Each of the prior two days ended strong, in the top quarter of the day’s range. Earlier, it looked like today’s session may also end strong, but the situation has weakened somewhat intraday.
Upward momentum has been strong as the two previously identified resistance targets at 2.20 (rising ABCD pattern, 127.2% extended target (D)) and 2.24 (38.2% Fibonacci retracement and swing low support from December 13) were exceeded to the upside. An intraday pullback followed the 2.62 high, with lower price levels being tested as support.
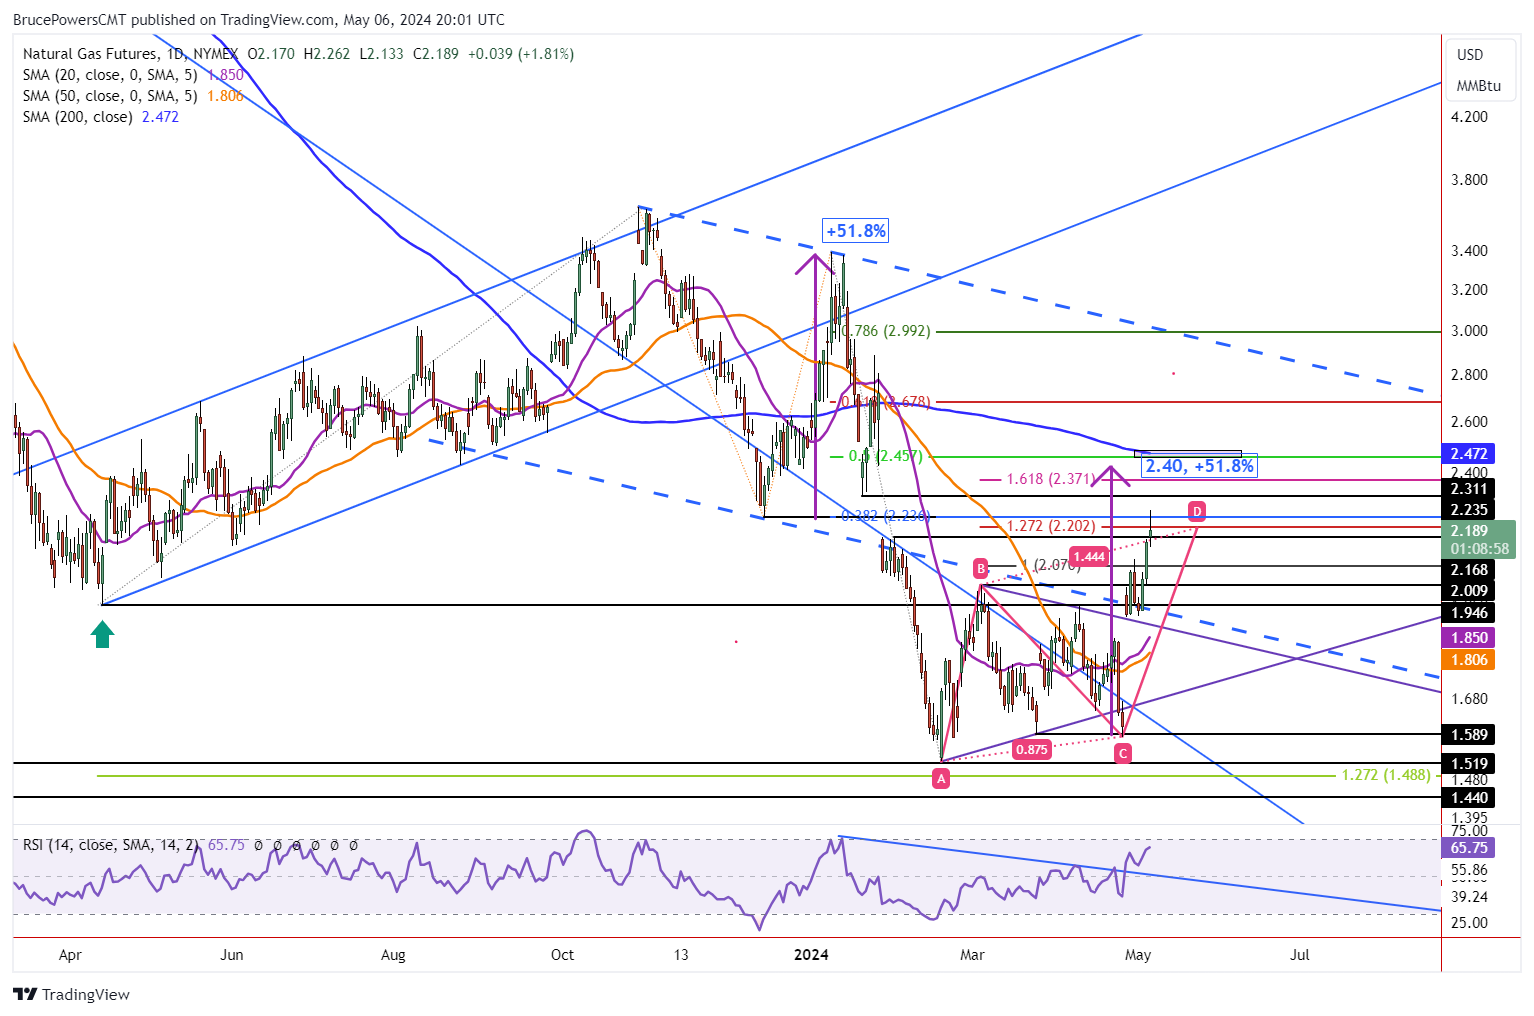
Next Bullish Signal, Above Monday Highs
Following today’s close, a bull trend continuation signal will be generated on a rally above today’s high and confirmed on a daily close above it. However, given that the ascent has stalled within a target zone, the potential for a pullback prior to a continuation higher has increased. This would be healthy for the advance and provide better risk reward opportunities for the next rally.
Pullback May be Short Lived
Last week’s pullback was shallow, indicating underlying strength in demand. A somewhat similar short-term pullback may occur off today’s high. Significant potential support is noted at last week’s low of 1.91 and it marks the maximum decline anticipated for the near-term bullish outlook to be maintained. But support should be seen higher. Watch the 2.17 price zone (resistance and now potential support from February 1 high) and today’s low of 2.13.
Measured Move Points to 2.40 Possibly
The current upswing in natural gas has exceeded the three previous rallies of 22.3%, 32%, and 24.8%, reflecting improving demand. As of today’s high, it was up by 42.9% from the most recent swing low at 1.58 (C). The relative performance confirms that the buyers are back in charge. Analysis of time provides additional supporting evidence for the bull move as the current advance was faster than the prior three.
This is another way to confirm strength as the current advance is only on its seventh day and the three prior rallies completed in three to 11 days. So, based on time there could be further upside. Also, taking a measured move of the fourth most recent rally, that began from the December 13 swing low, further supports a bullish scenario. That rally was 51.8% in 20 trading days. Similar performance in the current move would occur around a 2.40 target zone.
Read Full Story »»»
DiscoverGold
Price Matters. The Energy Report
By: Phil Flynn | May 6, 2024
While some in the marketplace are concerned about weak demand, a move by Saudi Arabia to raise their price for oil seems to suggest that they’re not that concerned. Consider the fact that the well prices according to technical analysis, West TX intermediate crude prices are close to the 100-day moving average and now are the most oversold on a 14-day relative strength index basis since they bottomed out last December.
Now with the Gaza ceasefire talks falling apart, as was expected, the market is starting to realize that the geopolitical risk factors have not gone away. Reports say that Israel is warning Palestinians to evacuate parts of Rafah as they prepare to move to remove Hamas from the area. Reports say Israel struck an area overnight from which Kerem Shalom was attacked. Israel Prime Minister Benjamin Netanyahu made it very clear that just ending the war in Gaza would keep Hamas in power and that would pose a threat that Israel cannot accept. They would be willing to pause fighting in Gaza in order to secure the release of hostages but obviously it doesn’t look like that’s going to happen.
This comes as Saudi Arabia and OPEC plus used their market might and sent a message signaling that they’re not only going to continue their voluntary production cuts into the end of the year but potentially in the New Year. On top of that, the market pricing and the potential for even deeper cuts as Iraq has vowed to make compensation cuts this year of 602,000 barrels a day, we also have a commitment from Kazakstan vowing to reduce production by an additional 389,000 barrels a day.
Bloomberg reported that Saudi Arabia raised the price of its flagship crude to Asia for a third consecutive month, as the kingdom tries to tighten the oil market to prevent a global surplus. Saudi Aramco raised the June official selling price of Arab Light crude for customers in Asia by 90 cents to $2.90 a barrel above the regional Oman-Dubai benchmark, according to a price list seen by Bloomberg. It compares with an increase of 60 cent forecast in a Bloomberg survey of six refiners. Prices for other lighter and heavier varieties were also increased from May.
Gasoline demand in recent weeks has been poor and even though there are reports that it’s improving. In the big picture, Woods MacKenzie is predicting that gasoline demand will be weak because of the greater adoption of electronic vehicles. There are reports that quote penetration of electronic vehicles has been increasing in the US and China this year. Chinese gasoline demand will only grow by 10,000 barrels a day due to a higher electronic vehicle uptake.
Yet despite spite recent mixed signals about U.S. oil demand, the reality is that we’re seeing the science of supplies are going to tighten. We did see a big drop in rig counts for both oil and natural gas last week.
The weekly count for oil dropped to 499 from 506, while gas lost three rigs week to week at 102, Baker Hughes said Friday. The miscellaneous tally grew by two to four. A year earlier, the US had 588 oils, 157 gas and three miscellaneous rigs in operation, the company’s data showed.
We see signs that demand should pick up this weather starts to kick in to more summer like temperatures. I think that last week was a great buying opportunity.
Reports that the Freeport LNG export terminal was taking more inflows last week and they hope that power generation for artificial intelligence and Bitcoin mining and data centers will create an explosion in demand for natural gas next year. It is giving the markets some hope in the face of pretty overwhelming supplies. The market is trying to bottom, and it still might be a good time to buy some long-term calls.
Read Full Story »»»
DiscoverGold
Crude Oil Investors Turn Cautiously Bullish Amid Global Tensions
By: James Hyerczyk | May 6, 2024
Key Points:
• Oil futures rise with geopolitical tensions, Saudi pricing.
• Saudi Arabia hikes prices for Asian, European markets.
• OPEC+ likely to extend production cuts into June.
Crude Oil Futures Gain
Oil futures saw a slight increase on Monday as market conditions were influenced by geopolitical tensions and strategic pricing adjustments by Saudi Arabia. This shift comes in response to heightened tensions in the Middle East and adjustments in Saudi crude pricing.
At 09:27 GMT, Light Crude Oil Futures are trading $78.92, up $0.81 or +1.04%.
Saudi Pricing and Market Impact
In a significant move, Saudi Arabia has raised the official selling prices (OSPs) for its crude destined for Asia, Northwest Europe, and the Mediterranean for June. This adjustment reflects the kingdom’s anticipation of robust demand during the summer months. Despite a sharp decline in prices last week, with ICE Brent falling over 7%, the new week opened with a stronger price footing due to tightened supply expectations.
Geopolitical Tensions and Oil Supply Risks
The ongoing conflict between Israel and Hamas introduces an element of uncertainty, heightening the geopolitical risk premium initially. However, this risk premium has subsided as immediate threats to oil supply routes have not materialized, and diplomatic efforts towards a ceasefire continue, albeit with challenging negotiations ahead.
U.S. Production and Rig Count Trends
Domestically, the U.S. oil landscape is witnessing a reduction in operational rigs, indicating a potential tightening of oil supply. The latest report from Baker Hughes highlights a significant drop in oil rigs, marking the most substantial weekly decline since November 2023. This could hint at a cautious production stance amidst fluctuating market conditions.
OPEC+ Production Strategy
Looking ahead, OPEC+ is likely to maintain its current production cuts into the upcoming review in June. The decision aims to stabilize the market, particularly as global inventories have not decreased as expected earlier this year. Despite pressures to increase production due to growing outputs from non-OPEC+ members like the U.S., Canada, Brazil, and Guyana, any potential increase by OPEC+ might be minimal and largely symbolic given the current market equilibrium.
Market Forecast: Cautiously Bullish Outlook
Given the ongoing geopolitical risks, strategic price adjustments by major producers, and the current balance of supply and demand, the market outlook remains cautiously bullish. Investors and traders should keep a close watch on further developments in geopolitical events and OPEC+ decisions, as these will be pivotal in determining market directions in the near term. The market’s reaction to these elements will set the path for oil prices in the upcoming weeks.
Technical Analysis
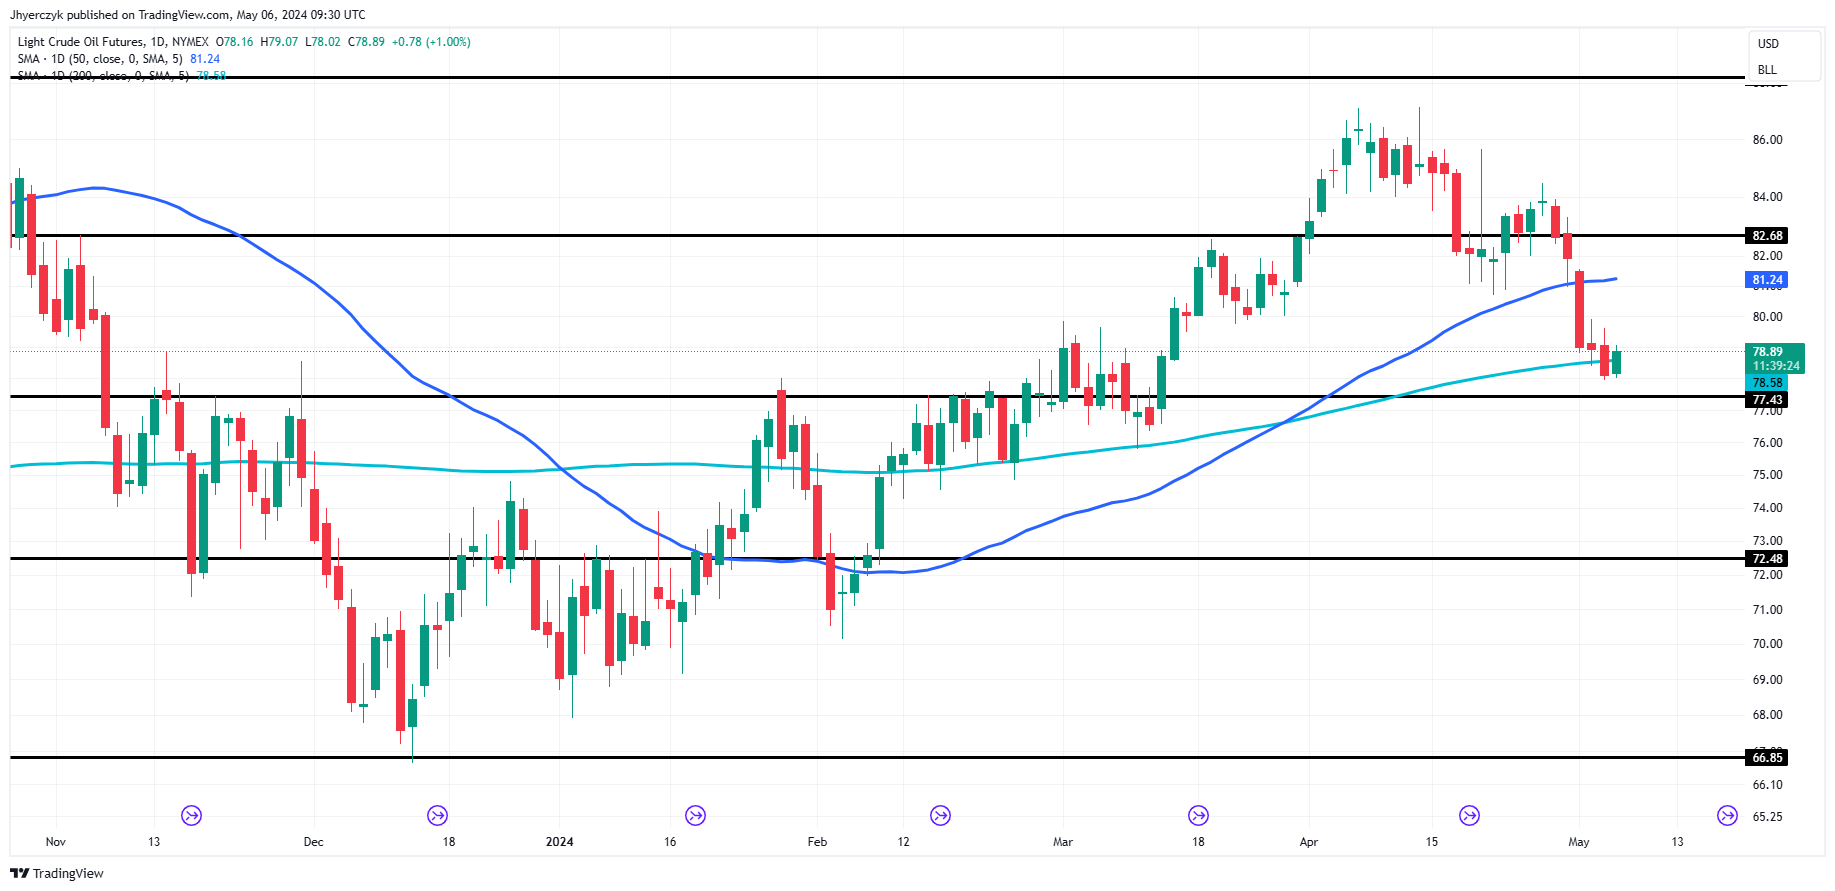
Daily Light Crude Oil Futures
Light crude oil futures are edging higher on Monday, but inside Friday’s range. This chart pattern suggests transition as well as investor indecision and impending volatilty. All this is taking place while the market is straddling the 200-day moving average at $78.58.
The 200-day MA is not only controlling the long-term direction of the market, but today it is likely to act like a short-term pivot.
Since sentiment seems to have shifted to cautiously bullish, a sustained move over $78.58 could lead to increased momentum with the primary upside target the 50-day moving average at $81.24. This indicator is controlling the intermediate-term trend.
Read Full Story »»»
DiscoverGold
WTI Crude Oil CoT: Peek Into Future Through Futures, How Hedge Funds Are Positioned
By: Hedgopia | May 4, 2024
• Following futures positions of non-commercials are as of April 30, 2024.
WTI Crude Oil: Currently net long 259.7k, down 18.8k.

West Texas Intermediate crude dropped in all sessions this week, down 6.9 percent for the week to $78.11/barrel. This was the third down week in four. The crude rallied from $67.71 last December to $87.67 on April 12th before coming under pressure.
This week, both the 50- and 200-day were breached. WTI concurrently fell back into a well-established range between $71-$72 and $81-$82 that persisted for 19 months before the upper end gave way five weeks ago. Even more important, it ended the week right on a rising trendline from last December’s low. A likely breach can eventually open the door toward the lower end of the range in question.
In the meantime, US crude production in the week to April 26th was unchanged for eight consecutive weeks at 13.1 million barrels per day; 10 weeks ago, output was at a record 13.3 mb/d. Crude imports increased 275,000 b/d to 6.8 mb/d. As did crude and gasoline inventory, which respectively rose 7.3 million barrels and 344,000 barrels to 460.9 million barrels and 227.1 million barrels. Distillate stocks, however, dropped 732,000 barrels to 115.9 million barrels. Refinery utilization declined one percentage point to 87.5 percent.
Read Full Story »»»
DiscoverGold
NY Crude Oil Futures »» Weekly Summary Analysis
By: Marty Armstrong | May 4, 2024
NY Crude Oil Futures closed today at 7811 and is trading up about 9.01% for the year from last year's settlement of 7165. Caution is required for this market is starting to suggest it could now decline on the MONTHLY level. As of now, this market has been rising for 4 months going into May suggesting that this has been a bull market trend on the monthly time level. As we stand right now, this market has made a new low breaking beneath the previous month's low reaching thus far 7796 while it's even trading beneath last month's low of 8070.
ECONOMIC CONFIDENCE MODEL CORRELATION
Here in NY Crude Oil Futures, we do find that this particular market has correlated with our Economic Confidence Model in the past. The Last turning point on the ECM cycle low to line up with this market was 2020 and 2009 and 2001 and 1998 and 1994. The Last turning point on the ECM cycle high to line up with this market was 2022 and 2018 and 2011 and 2000.
MARKET OVERVIEW
NEAR-TERM OUTLOOK
The historical broader tone of the NY Crude Oil Futures has been a bearish consolidation following the high established back in 2008. Since then, this market has created 2 reaction highs which have been unable to break this overall protracted bearish consolidating trend. Still, the major low was made in 2023 and the market has bounced back for the last year. The last Yearly Reversal to be elected was a Bullish at the close of 2023.
This market remains in a positive position on the weekly to yearly levels of our indicating models. Nevertheless, it closed last year on the weak side down from 2022. Pay attention to the Monthly level for any serious change in long-term trend ahead.
Looking at the indicating ranges on the Daily level in the NY Crude Oil Futures, this market remains in a bearish position at this time with the overhead resistance beginning at 8095.
On the weekly level, the last important high was established the week of April 8th at 8767, which was up 17 weeks from the low made back during the week of December 11th. We have seen the market drop sharply for the past week penetrating the previous week's low and it closed beneath that low which was 8070. This was a very bearish technical indicator warning that we have a shift in the immediate trend. We are trading below the Weekly Momentum Indicators warning that the decline is very significant and we need to pay attention to the timing and reversals. When we look deeply into the underlying tone of this immediate market, we see it is cautiously starting to weaken since the previous high at 3070 made 1197 weeks. Immediately, this decline from the last high established the week of April 8th has been important closing sharply lower as well. Before, this recent rally exceeded the previous high of 7960 made back during the week of November 27th. Nonetheless, that high was actually lower than the previous high made the week of October 16th suggesting this market has really been running out of sustainable buying for right now. This immediate decline has thus far held the previous low formed at 6771 made the week of December 11th. Only a break of that low would signal a technical reversal of fortune and of course we must watch the Bearish Reversals. Right now, the market is below momentum on our weekly models casting a bearish cloud over the price action. Looking at this from a wider perspective, this market has been trading up for the past 20 weeks overall.
INTERMEDIATE-TERM OUTLOOK
YEARLY MOMENTUM MODEL INDICATOR
Our Momentum Models are declining at this time with the previous high made 2021 while the last low formed on 2023. However, this market has declined in price with the last cyclical low formed on 2023 warning that this market remains weak at this time on a correlation perspective declining in both price and Momentum.
Looking at the longer-term monthly level, we did see that the market made a high in September 2023 at 9503. After a four month rally from the previous low of 8346, it made last high in September. Since this last high, the market has corrected for four months. However, this market has held important support last month. So far here in May, this market has held above last month's low of 8070 reaching 8070.
Some caution is necessary since the last high 9503 was important given we did obtain one sell signal from that event established during September 2023. That high was still lower than the previous high established at 12368 back during June 2022. Critical support still underlies this market at 6700 and a break of that level on a monthly closing basis would warn of a further decline ahead becomes possible. Nevertheless, at this time, the market is still weak trading beneath last month's low.
DiscoverGold
Natural Gas Eyes on Further Gains
By: Bruce Powers | May 3, 2024
• Natural gas breaks to a new trend high of 2.16, triggering a monthly breakout. It is likely to close strong, hinting at a continuation higher into next week.
Natural gas breaks out to a new trend high of 2.16 on Friday and it is on track to close strong, in the upper quarter of the day’s range. If it does, a continuation higher heading into next week looks to be on the table. The weekly chart is also set to end strong for the second week in a row.
Further, a monthly breakout triggered today on a move above April’s high of 2.09. Today’s high approached a resistance zone from late-January and early-February with a high for the range at 2.17. If that high gets busted, higher price levels become targets.
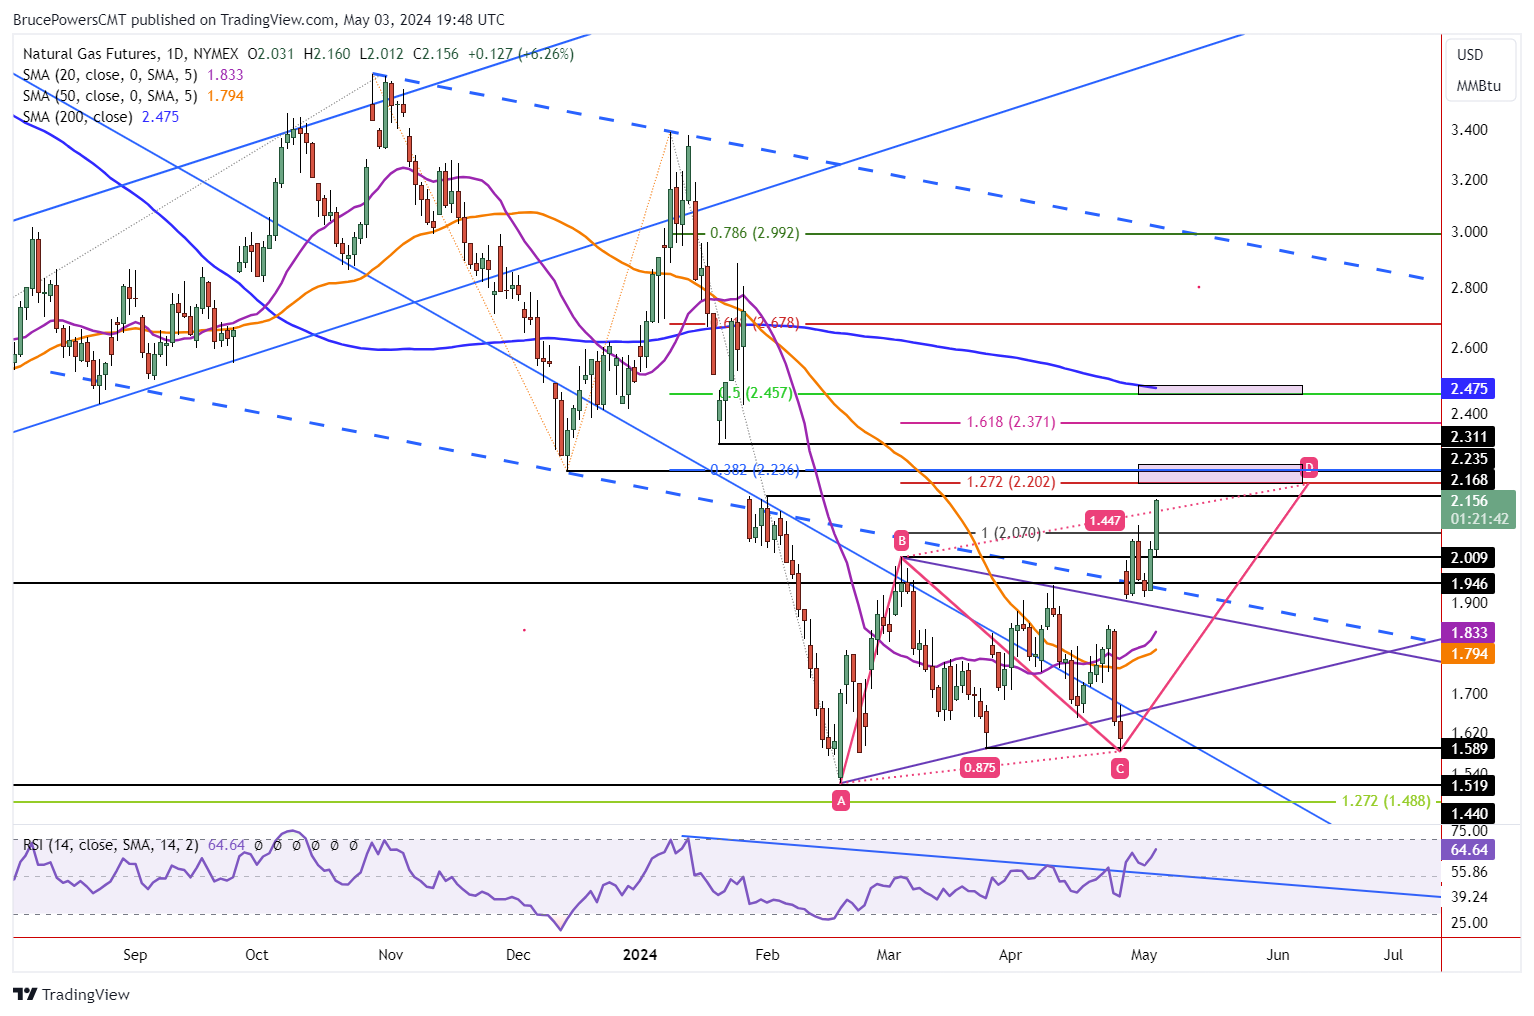
Improvement in Momentum
Given the improvement in momentum and the likely strong closing price for the week, the initial targets could eventually be exceeded. That is, if demand remains strong. The next target zone begins with the completion of an extended rising ABCD pattern at 2.20. That is where the CD leg of the advance is 127.2% of the AB leg.
Nonetheless, an initial Fibonacci retracement of 38.2% is at 2.24, with that price level confirmed by previous support from the December 11 swing low. If natural gas can get through that price level and keep rising it may have a chance to eventually test resistance around the 200-Day MA, which is currently at 2.47.
Signs of Strength in Monthly Chart
Confirmation of strength on both the monthly and weekly charts provides further evidence for a bullish reversal of the bottom from February. This means that that rally should have more to go, and it may just be getting started. Today’s price action extends an advance off support around the lower blue dash trend channel line.
In general, once prices rise above from support at the bottom of a channel, an eventual target is the top channel line. This doesn’t mean it will be reached, just that it could be. Of course, the price represented by the upper line will depend on when it is reached, given that it is downward sloping. However, given that it is now a potential target, it may make the lower price targets more likely to be reached.
Read Full Story »»»
DiscoverGold
Crude Weekly Price Forecast – Crude Falls Hard to Test Support
By: Christopher Lewis | May 3, 2024
• The oil markets have fallen a bit during the trading week, as we are now looking for some kind of reason to get long again. Remember, there are a multitude of noisy reasons to be in this market at the moment.
WTI Crude Oil Weekly Technical Analysis
The West Texas Intermediate crude oil market has plunged for the week, but quite frankly, at this point in time, I think it continues to see a lot of support underneath, as a lot of questions are now being asked about whether or not there is going to be a geopolitical risk premium attached to this market.
I think it’s a huge mistake to take that out and all it would take is one errant headline to send this market straight back up in the air. Typically, this time of year, we do see a bit of a demand increase for crude oil due to driving and flying. And now the questions around jobs have come into the fray.
As of Friday, we saw the US print much less than anticipated. So, the question will be whether or not demand will pick up or fall if the Federal Reserve cuts rates. Typically, that means oil goes higher over the longer term. And although I don’t call for that, I recognize that if we could reach the $80 level and recover that to the upside, we could see buyers come back in.
Brent Crude Oil Weekly Technical Analysis
Brent markets look very much the same, with the $84.50 level being a significant barrier that if we can overcome, I think a lot of traders will get involved and try to run Brent to the $90 level. I have no interest in shorting the oil markets, although it doesn’t look as bullish as it once did. I think this is a situation where if oil starts to fall apart, you’re probably going to have better short trades against other things because if oil falls apart, that means the economic conditions are probably falling apart as well. That being said, I expect a little bit of a recovery, but whether or not we break out to the upside remains to be seen.
Read Full Story »»»
DiscoverGold
Play It! The Energy Report
By: Phil Flynn | May 3, 2024
I was shocked to hear there was gambling going on at Ricks Café and equally shocked to hear that Biden’s price caps on Russian oil have failed. In 2022 the administration of Joe Biden tried to impose a price cap to cut oil revenues for Russia, a major source of funding for its war against Ukraine. Now as my buddy Anas Alhajji points out, the Russian Urals crude price is about $15 above the price cap and is very concerned about who is going to tell Treasury Secretary Yellen or Biden.
Of course if Ms. Yellen or Biden read my report back then, I could have saved them the trouble of putting on the ill-fated price cap in the beginning. I predicted that the price caps would fail and if they asked me, who knows, it could have been the start of a beautiful friendship.
I’m no good at being noble, but it doesn’t take much to see that the problems with price caps are that they never work, and never have worked. People will either find a way around them or if they are truly enforced, it will lead to shortages. You show me a price cap, then I will show you a shortage. Yet the shortage did not happen because the price caps were never enforced.
This week Reuters reported that a group of Western insurers said a Russian oil price cap has become unenforceable and only pushed more ships into joining a shadow fleet, delivering one of the harshest rebukes to the measure that had been meant to cut revenue to the Kremlin. Now there are more calls in congress to lift the Russian oil price caps and try – maybe – some sanctions that might work.
First the Biden administration has been trying to convince people over the last couple of years that the price caps were working. Now it’s clear that they never really did work and I told them that.
Biden’s spendthrift ways of throwing money at the electric car industry, as we said, was doomed to fail and it is failing. Biden’s attacks on the US oil and gas industry and the reversal of many of Trump’s policies on energy was the start of his problems. Killing pipelines, drilling moratoriums and extreme regulations are some of the factors that is causing inflation. His tapping of the Strategic Petroleum Reserve for purely political purposes was part of his ill fated energy policy. Biden’s foreign policy in the Middle East by going hard on Saudi Arabia and soft on Iran has had devastating consequences for the globe. Biden’s energy policies may very well be the reason why he could lose his reelection. Maybe he’ll always have Paris. Paris, as in the Paris Climate accord, at least until the next president pulls out of it. Here’s looking at you, kid.
Yet this week it was the Fed that did more to bring down oil prices than anything Biden or Janet Yellen did. This week the story was bigger than expected increase in crude oil supplies, disappointing gasoline demand and real concerns that the Federal Reserve was going to have to induce a recession to get inflation under control. The problems are being complicated by a slowdown in US manufacturing and talk of the possibility of stagflation is permeating the marketplace. This puts emphasis on today’s jobs report. The other thing that we’ve seen in oil this week is the unwinding of geopolitical risk factors. It’s almost amazing to me that oil prices took seriously the possibility that ceasefire talks were going anywhere, but they obviously did.
It’s going to be interesting to see how oil traders will prepare for what may be coming this weekend as many sources believe that Israel will start to move into Rafah this weekend. This comes as the Wall Street Journal reports that, “The Pentagon is shifting jet fighters, armed drones and other aircraft to Qatar, repositioning its forces to get around restrictions on conducting airstrikes from an air base long used by the U.S. in the United Arab Emirates. The U.A.E. informed the U.S. in February that it would no longer permit American warplanes and drones based at Al Dhafra air base in Abu Dhabi to carry out strikes in Yemen and Iraq. That has prompted U.S. commanders to send the additional aircraft to Al Udeid air base in Qatar, the small Persian Gulf monarchy that hasn’t imposed similar restrictions, U.S. officials said.”
Oil should be close to the low and the correction should be over. If the jobs market is not too hot, then the bottom should be in as the risk premium goes back in.
Natural gas is putting up a good fight in the face of an overwhelming supply. Codes for the US domestic natural gas market is in fact that natural gas prices are historically cheap and data centers unquenchable demand for power continues to grow to incredible heights. With the emergence of cryptocurrencies, artificial intelligence, electricity demand is going to be going through the roof and is it possible that the US natural gas market will be saved by this incredible surge and demand. More on that next week.
Read Full Story »»»
DiscoverGold
Natural Gas Potential for Bullish Trend Continuation
By: Bruce Powers | May 2, 2024
• Weekly chart shows bullish continuation, with last week's high of 2.00 a key level to watch.
Natural gas triggered a bullish reversal on a rise above Wednesday’s narrow range day high on Thursday before encountering resistance at 2.05 and stalling the ascent. This increases the chance that the low of 1.91 from the past week will maintain support. However, further bullish follow-through is necessary to further confirm the indication. Once today’s session is complete, that will start to happen on a rally above today’s high. But there will not be a bullish trend continuation signal until the recent high of 2.09 is exceeded to the upside.

Bullish Weekly Signal
A bullish continuation on the weekly chart was triggered this week further supporting a continuation higher for natural gas. Last week’s high of 2.00 is the price level to watch relative to this week’s closing price. It is currently trading above that price level and a daily close above it will confirm the bullish move on a weekly time frame. Keep in mind that the larger time frames influence the shorter time frames.
Low Volatility Leads to Higher Volatility
Further, volatility in the price of natural gas dropped during the formation of the bottom symmetrical triangle consolidation pattern. What usually follows low volatility? Higher volatility. In other words, the stage is set for a potential rally into higher price zones. That doesn’t mean it goes straight up. There is still the possibility of a dip below this week’s low of 1.91. But it becomes less likely if this week ends above 2.00.
Signs of Strengthening
This week’s high of 2.09 completed an initial rising ABCD target at 2.07 and the high reached the underside of the 20-Week MA, an obvious location for possible resistance, which is what happened. Further supporting a continuation higher is the relationship with the declining blue dashed parallel trend channel. The area around the lower channel line has acted as support for five days and now strength is returning. That is a sign of progress as the top channel line becomes a potential target once this week’s high is exceeded. This doesn’t mean it will be reached but the possibility exists. Therefore, the chance of eventually reaching lower targets increases.
Read Full Story »»»
DiscoverGold
Lack Of Further Progress. The Energy Report
By: Phil Flynn | May 2, 2024
Commodity volatility went crazy as the Federal Reserve signaled, “the lack of further progress on there are inflation target in recent months” shook up a whole host of commodities. We started with dramatic moves in grains, meats, industrial metals, and precious metals and of course in oil that not only had to deal with the Federal Reserve seemingly putting off interest rate cuts, but also a very disappointing weekly inventory report that suggests that U.S. oil demand is sputtering. Yet the further lack of interest rate cuts and the drop in oil prices means that OPEC plus could extend its voluntary production cuts beyond the second quarter and into the New Year. The plunge in oil might reverse if OPEC sources are correct and OPEC signals an extension of the cuts then more than likely this is going to be a trial balloon, but our expectations are very clear. If prices don’t hold this area, then OPEC will extend cuts and possibly even work towards a larger cut in production.
While the weekly demand numbers for total petroleum products came in at an impressive 20.417 million barrels of oil a day, we saw an uptick in gasoline demand which was up 195,000 barrels a day from the week before and is still coming in at a weak 8.618 million barrels a day. Distillate demand was also up week over week, coming in at 3.678 million barrels a day. But where you see the demand discrepancy is when you look at the four-week moving average, for example gasoline averaged 8.6 million barrels a day which is down by 3.6% from the same period last year. The weakness in gasoline demand probably reflects the big drop that we saw in consumer confidence last week.
This is a warning sign that high inflation is really starting to cut into the consumer’s ability to spend the money. Now if you put this in the context of the Federal Reserve coming out saying that they are going to have to potentially pause an interest rate cut, it means that there’s going to be more pain for consumers because the only way you’re going to bring down gasoline demand is to make the economy tougher for most people.
We were expecting a bigger uptick in gasoline demand this week and while the weekly numbers have not been so accurate, the trend is not encouraging. The data shows a drop in distillate inventory that if you look at the four-week moving average, is down 8.2% from the same period a year ago. The other main reason why the report came out as bearish as it did was the fact that we saw commercial crude inventories surge by 7.3 million barrels from the previous week. Not all of that was demand related but due to a surprising increase in U.S. oil imports and a big decrease in U.S. oil exports from the record-breaking numbers that we’ve been seeing. US crude exports fell from 5.179 million barrels a day to 3.918 million barrels a day, down 1.261 million barrels a day. US crude oil imports on the other hand rose to 2.854 million barrels a day and that was up from 1.318 million barrels a day the week before.
The market also seemed to be removing some of the geopolitical risk and worst-case scenarios. Even with the hopes of a ceasefire deal between Hamas and Israel falling apart, the market seems unfazed that it’s going to have any negative consequences for the flow of oil.
Get geopolitical risks remain. Overnight it was reported that Ukraine drones hit a Rosneft refinery. Bloomberg reported that Ukrainian drones hit a major oil refinery owned by state-controlled Rosneft PJSC in Ryazan, southeast of Moscow, just as the facility’s crude-processing had recovered from a previous strike. The overnight attack caused a fire at the plant, a person in the Ukraine military who is familiar with the matter told Bloomberg News.
Apparently the Wall Street Journal reported that they found evidence of collusion! They reported that Ex-Pioneer CEO Scott Sheffield was barred from the Exxon Board in the merger between the two companies. The Journal says that antitrust enforcers are set to allege Scott Sheffield discussed coordinating oil-production levels with other producers and OPEC. Exxon agreed in October to buy Pioneer for $60 billion in stock, marking its biggest deal since it merged with Mobil in the late 1990s and the largest oil-and-gas deal in two decades. The WSJ says that they will all edge that Sheffield engaged in collusive activity that could have raised the price of oil, these people said. The allegations will include that Sheffield sent hundreds of messages to representatives of the Organization of the Petroleum Exporting Countries about market dynamics, including pricing and production levels.
The Journal, in a must read, said that, “For years, investors urged frackers to stop overspending on drilling new wells and pumping ever-increasing amounts of crude, and instead to keep production largely flat, which would increase cash flows and enable higher returns to shareholders. It took years—and a crippling pandemic—for shale producers to agree.” U.S. frackers fiercely competed for years with OPEC for market share. At a 2017 dinner in Houston, shale executives sat down for a first-of-its-kind dinner with Mohammad Barkindo, then the secretary-general of OPEC. Sheffield attended the dinner, during which Barkindo discussed OPEC negotiations on cutting oil output, among other topics.”
This is going to be interesting. Many investors and people in the oil industry believe that when the US frackers started to over produce and flood the market with oil that it was not a good business decision.
The column of oil depressed prices and many of the producers racked up huge debt. OPEC on the other hand is a well oiled machine these days and they can really have an impact on global inventories. The question becomes at what point does collusion crossover with common sense.
Many people in the industry think that shell producers were derelict in their duty by not cutting back production earlier. One of the things I used to write during those days is that the frackers used to try to lose money on every barrel then try to make up for that in volume. Of course the commodity markets are probably the best way to hedge the risk of the boom and bust industry. But perhaps there has to be a better way for the US oil and gas industry to judge the market so that they can stay competitive with the likes of OPEC and Russia.
After the huge sell off the last couple of days as we ended the big plunge on the last trading day of April and we continued to sell off on the first day of May, we do believe that we’re getting pretty close to a value range for oil. While there still could be some downside today this will probably be a good opportunity to put on your spring hedges.
Natural gas is attempting to bottom but failed when the rest of the global markets seemed to fall apart. Today is going to be a big day as far as the natural gas injection number. We’re looking for an increase of 54 BCF.
The Biden administration’s attitude towards the energy policy is to throw as much of it on the wall and see what will stick. New rules by Bidens Environmental Protection Agency is going to compel coal and natural gas power plants to cut or capture 90% of their carbon pollution by 2032 according to the very optimistic but not very scientific EPA. They say this is going to reduce carbon dioxide emissions by 75% compared to its peak in 2005. The EPA wants to use 2005 as a benchmark because it makes them look good. The Biden administration wants to push through as many environmental rules as they can we regardless of the economic fallout because they need to start pleasing their environmental base that is turning against them. Biden’s approval ratings are in the sewer and in desperation they’re going to throw out as much as they can in the next few months.
West Virginia attorney general Patrick Morrisey he said he’s going to challenge the new EP rules in court he said that the US Supreme Court has placed significant limits on what the Environmental Protection Agency can do and we plan on ensuring that those limits are repelled and we expect that once again we will prevail on this out of control EPA.
Read Full Story »»»
DiscoverGold
Fed Freak Out. The Energy Report
By: Phil Flynn | May 1, 2024
Oil prices tried to stay strong in the face of the market doing a Federal Reserve freak out. Rumors that the Fed today is going to be extremely hawkish, even reports of potentially talking about raising rates before the end of the year, caused a major sell off in a lot of the markets. That wave of pessimism eventually dragged oil down and took the products with it.
Obviously, the fear of a more hawkish Fed and even a delay of interest rates could slow the economy and could slow the demand for oil at the same time. The rate differentials between the US dollar and other commodities could keep oil prices under pressure. It’s a story and they’re sticking to it.
Economic data yesterday though may suggest that the Fed is getting too hawkish and might be premature as consumer confidence is plummeting, falling to a reading of 97 yesterday when the expectations were for it to come in at 104.7. This came as manufacturing data in Chicago took a dive.
After the close it didn’t help that the American Petroleum Institute (API) reported a whopping 4.906-million-barrel increase in crude supplies. While oil products saw a supportive 1.48 million barrel drop in gasoline supplies and an equally supportive 2.187 million barrel drop in distillate supplies. The market was overwhelmed with the size of the crude oil supply increase.
It’s going to be interesting to see if today’s Energy Information Administration (EIA) report confirms the crude oil increase and if they do, what makes up that increase. We’ll look at production and see if it’s a case of reduced refinery runs or more just an aberration.
The concerns about slowing demand or the potential slowing of demand come as OPEC has shown further commitment to reducing global oil supplies. In the latest Reuters survey, they show that oil output from OPEC fell by 100,000 barrels a day in March as exports from Iran, Iraq and Nigeria seem to be signaling better compliance from the countries that have been over producing.
Geopolitical risk factors continue to be at play but the fact that Israel has not invaded Rafah just yet seems to be taking some of that risk premium off the table. The latest news is Hamas is saying that they’re still studying the recent ceasefire offer. Yet Israel has ceasefire or no ceasefire, they’re going to eliminate Hamas. This comes as reports say that the Biden administration is going to welcome in refugees from the Gaza Strip into the United States.
The Biden administration offers new rules that will add to the cost of energy and inflation. My friend Mike “Mish” Shedlock reports that, “New Biden Energy Rules Will Raise the Cost of a New Home by $31,000.” He says that new HUD energy rules will raise the cost of home construction by imposing stricter building codes. Payback time is 90 years. Maybe time to bring back the 100 year mortgage?
Now The United States Department of Energy (DOE) has decided to mandate federal agencies to construct only fossil fuel-free buildings starting 2030. “DOE estimates that over the next 30 years, the new rule will reduce carbon emissions from federal buildings by 2 million metric tons and methane emissions by 16 thousand tons—an amount roughly equivalent to the emissions generated by nearly 310,000 homes in one year, while also reducing infrastructure costs”. The rule, which enforces the 2007 Energy Independence and Security Act, applies to construction projects with start dates that fall in 2025 or later. The rule requires projects breaking ground in 2025–29 to be designed in such a way that fossil fuel energy in each building is 90 percent lower relative to 2003 levels. Projects that begin construction 2030 or later must cut consumption by 100 percent relative to 2003 levels. The sense is that the Biden administration is trying to push through as much crazy stuff regulation as they can because they think they’re going to lose the election.
Bloomberg writes that, “Nations from the Group of Seven have agreed to work to reduce their reliance on “civil nuclear-related goods” from Russia, as major industrialized nations work to reset their energy plans while isolating Moscow. G-7 energy ministers said their countries will engage in a multilateral effort to promote a diversified fuel supply chain free from Russian influence, according to the closing statement from a meeting in the Italian city of Turin. The ministers also committed to promoting fusion as a future energy source alongside regulatory efforts. Germany had previously objected to any reference to nuclear power as part of the group’s initiatives for so-called green transition.
Gold prices also pulled back on the Fed concerns but MarketWatch cited healthy investment from the over the counter market as well as central bank purchases according to a report from the world council that was released on Tuesday. Total first-quarter gold demand, which includes the investment and industrial sectors and central-bank purchases, climbed 3% from the same period a year ago to 1,283.3 metric tons — the strongest first quarter since 2016, according to the World Gold Council report. The total demand figure included 136.4 metric tons in over-the-counter (OTC) purchases, characterized by market participants trading directly with each other, it said. That’s more than triple the year-ago amount of 42.7 metric tons.
Saudi Arabia and Iran met to try to develop a road map for economic cooperation in the public and private sector. Both sides said the talks were constructive in these two adversaries are trying to find a way to work together.
The New York Times reported that, “the Biden administration on Tuesday released rules designed to speed up permits for clean energy while requiring federal agencies to more heavily weigh damaging effects on the climate and on low-income communities before approving projects like highways and oil wells. As part of a deal to raise the country’s debt limit last year, Congress required changes to the National Environmental Policy Act, a 54-year-old bedrock law that requires the government to consider environmental effects and to seek public input before approving any project that necessitates federal permits. That bipartisan debt ceiling legislation included reforms to the environmental law designed to streamline the approval process for major construction projects, such as oil pipelines, highways and power lines for wind- and solar-generated electricity. The rules released Tuesday, by the White House Council on Environmental Quality, are intended to guide federal agencies in putting the reforms in place.
The morning after a big sell off in the oil makes it harder to recover. Margin selling and position adjustment is adding to early morning weakness. Still oil is at a value range and after we get through the EIA and Fed, we should start the trek higher.
Natural gas is trying to find a bottom against incredible odds. Look to buy long dated calls.
Read Full Story »»»
DiscoverGold
$WTIC $Oil - Slipped its Daily 150/MA (Dotted-Grey) and testing the edges of the 'Bowl'
By: Sahara | May 1, 2024
• $WTIC $Oil - Latest
Slipped its Daily 150/MA (Dotted-Grey) and testing the edges of the 'Bowl'.
Be aware of the bearish plot tho...

Read Full Story »»»
DiscoverGold
Natural Gas Price Forecast: Current Patterns and Potential Price Targets
By: Bruce Powers | May 1, 2024
• Natural gas has exceeded its first target in a rising ABCD pattern, with trading now eyeing a test of support in a declining channel. Recent highs suggest the potential for further price increases.
Natural gas exceeded its first target today at the completion of a rising ABCD pattern. The high for Tuesday is 2.09 and the pattern target was 2.07. Resistance was seen off the high and trading is happening at the lows of the day at the time of this writing. It looks like a test of support at the lower declining blue dashed parallel channel may be in the works.
The April 14 swing low of 1.95 can be used as a proxy for the line if reached today as it is crossing the dashed line. Otherwise, watch for support at or above the top boundary line (purple) of the symmetrical triangle bottom. The three-day low of 1.91 can be used as a proxy for the line, however, keep in mind that the line will represent a lower price in the future given its downward slope.
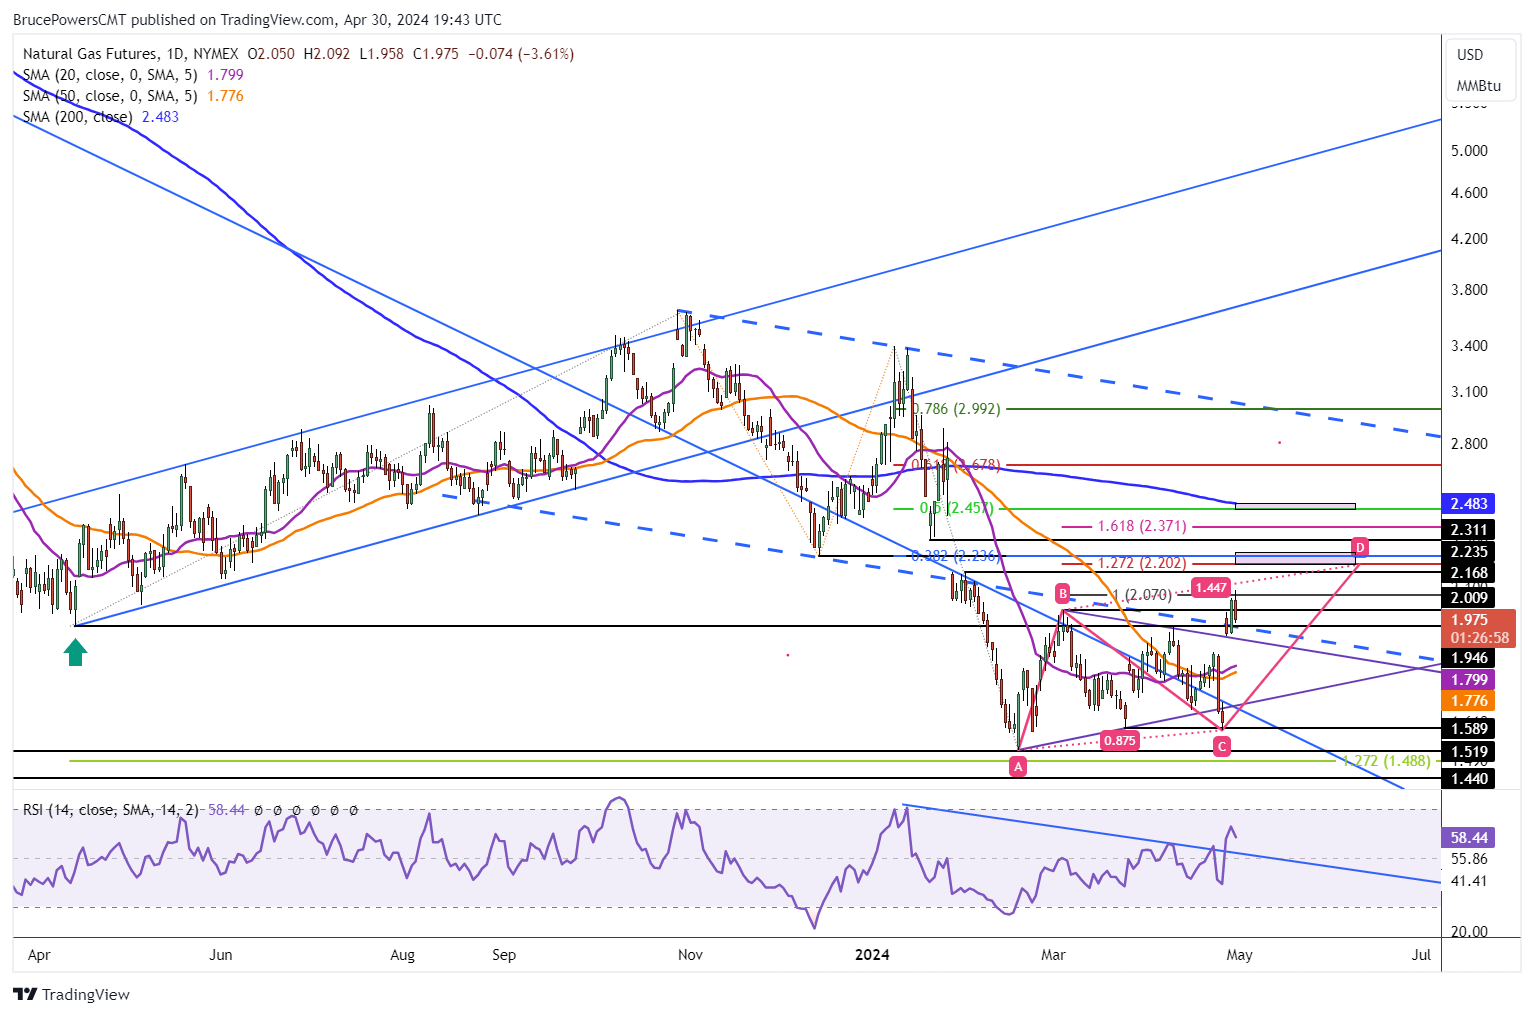
Highest Daily Closing Price in 59 Days
On Monday natural gas ended the session at its highest daily closing price in 59 days. Along with today’s new recent high, it looks like it is telegraphing higher prices. If it continues to rise, and there is a good chance it will, the next higher ABCD pattern target is up at 2.20. That price is within a target zone from around 2.17 to 2.24 and it includes the 38.2% Fibonacci retracement at 2.24.
Further up is the price area around the 200-Day MA at 2.48. Notice that the moving averages are showing improving demand. Recently, the purple 8-Day MA crossed up through the orange 50-Day MA after being below it for some months. Further, the relative strength index momentum oscillator (RSI) recently broke a trendline to the upside.
Below 1.91, Likely Leads to Test of Support Lower Down
Ideally for the bulls, natural gas stays above the April 26 gap day low support price of 1.91 during retracements. If so, the above bullish case becomes more likely and may occur faster than otherwise. However, if the 1.91 price level fails to act again as support and is broken to the downside, a test of lower price levels becomes likely. Lower meaning, from 1.90 to the 1.61 closing price from the day before the gap. The April 23 high of 1.85 and the 20-Day and 50-Day MAs from 1.80 to 1.78 are two price areas that stand out.
Read Full Story »»»
DiscoverGold
Making Russian Oil Great Again. The Energy Report
By: Phil Flynn | April 30, 2024
Oil prices, after dipping yesterday on cease fire talks, reacted to an announcement of the start of an important Canadian oil pipeline and a report that Biden will ease sanctions on Russian banks to allow energy deals to help keep prices lower headed into his election, are now back on the rise as geopolitical risk factors realities resurface. Israeli Prime Minister Benjamin Netanyahu is warning that, “Israel will enter city of Rafah in south Gaza to eliminate Hamas, with or without a ceasefire and hostage release deal.” Mr. Netanyahu says that they have begun evacuating Palestinians from Rafha in preparation for an upcoming operation. Hamas said they will respond in writing to Israel’s ceasefire proposal but are not giving a time as to when they will do so.
The market is now starting to realize that Israel’s attack on Rafha is a match that will be played and asked to increasingly worry about the fallout. This comes as Biden’s administration is showing signs of panic surrounding the potential price spike that may be coming ahead of the Presidential election.
Oil prices took a dip after the Treasury Department renewed sanction relief for at least 10 Russian banks, including the Central Bank, to allow energy-related operations amid rising energy cost. Bloomberg says that, “General License No. 8I allows Central Bank of the Russian Federation; Vnesheconombank; Otkritie; Sovcombank; Russia’s largest state-owned bank Sberbank; VTB Bank; the country’s top private bank Alfa-Bank; Rosbank; Zenit and Bank Saint-Petersburg to engage in production, refinement, transport, purchase of crude oil, natural gas and petroleum products. The License also allows for operations related to coal, agricultural products used to make biofuels, wood, uranium, development, production of power including nuclear, thermal and other sources.
This easing comes after the Biden administration discouraged Ukraine from hitting Russia where it hurts and that is their oil and gas sector. The pressure for Ukraine to quit attacking Russia’s oil and gas infrastructure comes because of that could cause prices to rise.
And of course, as I predicted, the so-called Russian price cap has become an abject failure. Bloomberg News is reporting, “A Group of Seven-imposed cap on the price of Russia oil is becoming increasingly unenforceable, an organization at the heart of the global insurance industry said, offering one of the most direct criticisms yet of measures that were meant to deprive the Kremlin of petrodollars. About 800 oil tankers that were previously covered by member organizations of the International Group of P&I Clubs have migrated into what’s known as a shadow-fleet, the club said in a written submission to a UK government inquiry on the effectiveness of sanctions on Russia. In addition, there’s no way for insurers to check whether traders are genuinely sticking to the price cap. The policy “appears increasingly unenforceable as more ships and associated services move into this parallel trade,” the International Group’s submission said. It “is concerned that increasing responsibility and obligations on companies in the G-7 coalition will result in a further migration of trade activities and ancillary services outside of the G-7.”
The other report that put a little downward pressure on prices was the long-awaited announcement of the start of the Canada’s Trans Mountain pipeline expansion. Reuters reported that Canada’s Trans Mountain pipeline expansion (TMX) is set to enter partial operation on May 1, years behind schedule and at more than four times the original cost – but with the potential to affect oil flows even outside North America. The expanded pipeline will ship an extra 590,000 bpd from Alberta to Canada’s Pacific Coast, giving Canada’s heavy crude producers access to U.S. West Coast and Asian markets, and boosting prices for their grades. I guess this might be a good time to mention that the old Keystone XL pipeline would have been up and running for years helping to ease prices and improve the oil flow. Of course, somebody decided to kill the approval of that at the last minute, I wonder who that might be?
Behind all the drama, we’re also seeing signs of global demand that continues to be strong for oil and suggests a very tight global oil market. Saudi Arabia reportedly feels confident enough to raise prices for most oil grades to Asia. This comes as the OPEC secretary general suggests that crude oil demand will grow by 2.2 million barrels a day in 2024 and confirmed that OPEC production cuts are going to continue through the end of the year. So, more demand and less supplies are normally very bullish.
At the same time we’re continuing to get warnings about underinvestment in future supplies of oil and natural gas. A big part of the reason is politicians that are obsessed with climate targets and not reality. A couple years ago, when I was doing the speaking circuit at different events talking about oil, I used to get a lot of blowback from my thesis that the world was not going to run out of oil. In those days the thesis of “peak oil” was all the rage. Peak oil was the contention that conventional sources of crude oil had already been reached and we were about to reach maximum production capacity worldwide that was supposed to diminish significantly.
“Twilight in the Desert” was a bestselling book about peak oil production in Saudi Arabia and many people believed that the United States oil production was already in an irreversible decline and the country’s economy might collapse if we couldn’t find ways to import more supplies of natural gas. Yet I never believed those doom and gloom predictions and was what you might call a peak oil denier. They said I ignored science, and that oil was a finite resource. On and on they went.
Even though I was in the minority and took a lot of heat for it, I had a belief in the power of the market. That when prices got high enough, we would find a way to find more oil. I believe that the free market and free market capitalism would drive innovation and even though I might not have known exactly how it was going to play out, I knew that the world would not run out of oil anytime soon and probably not ever. Price and profit incentive would drive innovation and I knew that we would find a way.
Let us fast forward to a report yesterday by the Energy Information Administration (EIA) that would have been the fantasy 20 years ago. The EIA reported that U.S. oil and natural gas reserves hit a record high this year. They said it couldn’t be done 20 years ago but the US oil and gas industry did it anyway. The EIA said that, “U.S. crude oil and lease condensate proved reserves increased 9% from 44.4 billion barrels to 48.3 billion barrels at year-end 2022. U.S. crude oil and lease condensate production increased 6% in 2022. In Texas, which has more proved reserves of crude oil and lease condensate than any other state, proved reserves increased 9% in 2022 (1.7 billion barrels), the largest net increase in any state).
In New Mexico, crude oil and lease condensate proved reserves increased 26%, the second-largest net increase (1.3 billion barrels). In North Dakota proved reserves increased 14%, the third-largest increase (0.6 billion barrels).
The 12-month, first-day-of-the-month average spot price for West Texas Intermediate (WTI) crude oil at Cushing, Oklahoma, increased by 43%, from $66.26 per barrel in 2021 to $94.54 per barrel in 2022.
Proved reserves of U.S. natural gas increased 10%, from 625.4 Tcf at year-end 2021 to 691.0 Tcf at year-end 2022, establishing a new record for natural gas proved reserves in the United States for a second consecutive year. Natural gas proved reserves in Alaska increased 25% in 2022, raising that state’s total from 99.8 Tcf to 125.2 Tcf—the largest increase of all states in 2022.
Natural gas did get a bit of a bounce and stational electric demand hit a near record high for this time of year. Early season cooling demand in the southeast is causing prices to go a bit higher. In 2022, U.S. natural gas exports were 6.9 Tcf, the highest volume on record. Cheap natural gas prices also had a part in lowering the demand for wind generated electricity which fell for the first time since 1990s. U.S. electricity generation from wind turbines decreased for the first time since the mid-1990s in 2023 despite the addition of 6.2 gigawatts (GW) of new wind capacity last year. Data from our Power Plant Operations Report show that U.S. wind generation in 2023 totaled 425,235 gigawatthours (GWh), 2.1% less than the 434,297 GWh generated in 2022.
Read Full Story »»»
DiscoverGold
Natural Gas Bullish Momentum Continues
By: Bruce Powers | April 29, 2024
• With a breakout above 2.01, natural gas is eyeing targets at 2.07 and then 2.20, supported by a potential retracement to 2.22 before aiming for the 200-Day MA at 2.49.
Natural gas rose above Friday’s high on Monday before triggering a breakout above the top of a symmetrical triangle at 2.01 (B). The high of the day at the time of this writing was 2.04, which was followed by an intraday pullback. Of interest will be the daily close.
A daily close above 2.01 will be a stronger sign of strength than a close below it as it would confirm the breakout above (B). Also, keep an eye on today’s close relative to Friday’s high. Once a daily close above 2.01 confirms the bullish breakout, natural gas should be ready to proceed towards higher target areas.
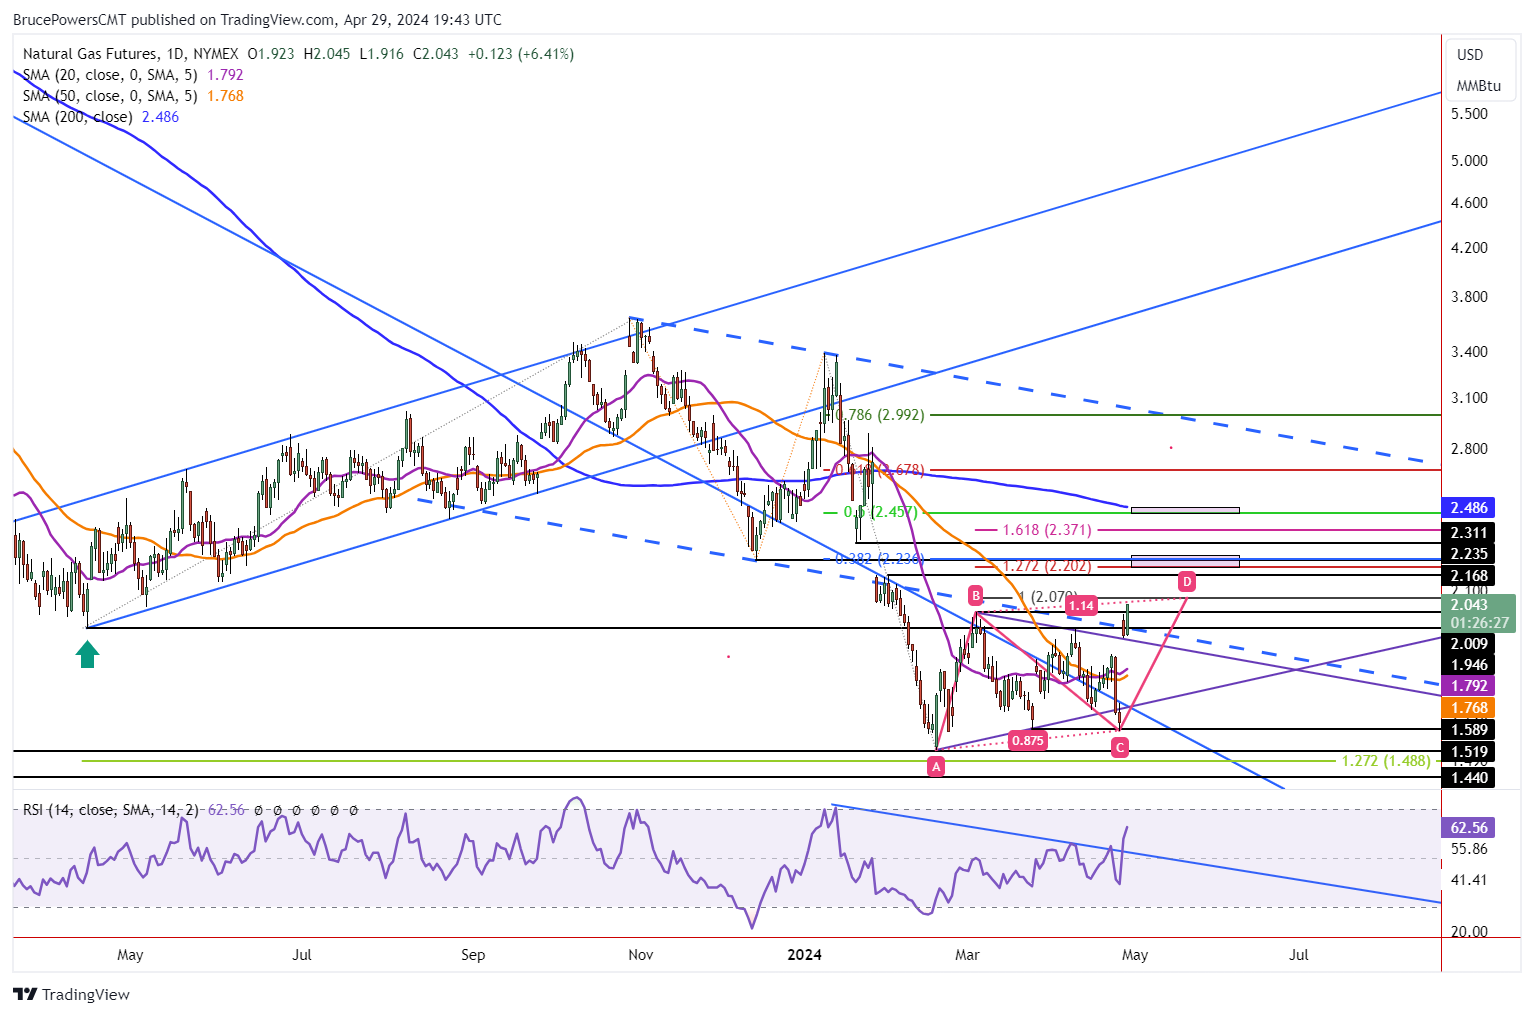
Upside Targets
The first upside target is close by at 2.07. If hit, it will complete an initial target for a rising ABCD pattern that is identifying price symmetry between the AB and CD legs of the advance. However, since it is close to the top of a symmetrical triangle higher prices remain on the radar. The second target from the ABCD pattern is 2.20. That target completes an ABCD pattern where the CD leg is extended by 127.2% of the AB portion of the advance.
It begins with a target range from 2.07 to the prior December 13 swing low at 2.24. Inside that price range is the completion of a 38.2% Fibonacci retracement at 2.24. Generally, a 38.2% retracement is usually the more common minimum retracement that might be seen. This means that since natural gas is showing improving strength, the 38.2% retracement should eventually be reached, at a minimum.
Signs of Strength
Last Friday natural gas rose above the lower dashed blue channel line before ending the day below it. Today, it is on track to close above it for the first time. The lower line is parallel to the top falling dashed blue line that connects the October and January swing highs. Further, natural gas is set to end on Monday at its highest daily closing price since February 5. If the top of the first target zone at 2.235 is exceeded, the next higher zone is around the 200-Day MA, currently at 2.49. It is further anchored by the 50% retracement at 2.46.
Read Full Story »»»
DiscoverGold
$WTIC $OIL - A Bearish 'Evening Star' Tri-Candle Plot is in the making on a Daily Basis at the Uppr 'Flag' Level & Key/MA's...
By: Sahara | April 29, 2024
• $WTIC $OIL - Update
A Bearish 'Evening Star' Tri-Candle Plot is in the making on a Daily Basis at the Uppr 'Flag' Level & Key/MA's...

Read Full Story »»»
DiscoverGold
Oil Coil. The Energy Report
By: Phil Flynn | April 29, 2024
Oil prices are coiling as the market tries to determine whether a push by US Secretary of State Anthony Blinken to convince Hamas to release hostages in return for a cease fire will bear any fruit. Mr. Blinken says that Hamas needs to decide, and it needs to decide quickly, on what he says is a proposal that is extremely generous. Mr. Blinken is also warning Israel that they need to do more to get humanitarian aid into Gaza.
While the market has seen some easing of risk premium as the threat of a direct confrontation between Israel and Iran has gone away, the ongoing drama in the continuing risk of supply against what should be record-breaking demand is going to keep the market well supported. There is a little bit of concern about Chinese demand that last month hit a 13-month low and talk that Iran is having a harder time moving their barrels of oil. Is it possible that Iran is having a harder time moving their barrels of oil because demand is slowing or is it possible that people are starting to find Iranian oil a little bit too hot to handle. This all comes against a backdrop of tightening global supply and more pressure by many in congress to actually enforce sanctions on Iran, a novel idea as far as the Biden administration is concerned. Energy Tidbits reported that global oil in floating storage fell by 32.67 million barrels in the last two weeks to just 16.64 million barrels of oil.
The other concern for Biden is rising inflation and gasoline prices that according to Triple A have eased a bit coming in at $3.659 which is a bit higher than yesterday but 2 cents lower than a week ago. That’s still 5 cents higher a gallon than a year ago. This comes as a CNN poll shows that 61% of Americans believe Biden’s presidency is a failure. The growing pressure on Biden to do something about gasoline prices could lead to another Strategic Petroleum Reserve release as the administration has already hinted, they may do just that. Yet that will be met with a lot of dissension from the Republicans who realized that the damage that the Biden administration has done by misusing the strategic reserve is going to cost taxpayers a lot of money over the long run.
In the short run supplies in the US should tighten again this week. We are looking for a 3-million-barrel drawdown in crude oil supplies and we’re looking for a 2 million barrel drop in distillate inventories and a 1 million barrel drop in gasoline inventories. We are also looking for refinery runs to uptick by 0.5%.
The risk of products going higher is still high. Tass, the Russian news agency, reported that the Slavyansk refinery in Russia’s Krasnodar Krai, which was attacked by Ukrainian drones on 27 April, has been forced to suspend some operations. “The plant’s operations have been partially suspended. Exactly 10 UAVs flew directly into the territory of the refinery, causing a severe fire. There may be some undetected damage,” said Eduard Trudnev, the security director of the company that operates the Slavyansk refinery, as quoted by Tass. It is not reported which operations have been suspended or whether the plant is operating at all.
Reuters also reported that, “The U.S. military said on Sunday it had engaged five unmanned drones over the Red Sea that, “presented an imminent threat to U.S. coalition and merchant vessels in the region. “U.S. Central Command did not say in the statement if the drones were destroyed. Marine Log reported that, “After a period with few reports of Houthi activity, the Iranian-backed group has resumed its targeting of merchant shipping, with Al Arabiya and other regional news outlets quoting the Houthi’s military spokesman as saying the group had attacked the “U.S. ship Maersk Yorktown and an American destroyer in the Gulf of Aden and Israeli ship MSC Veracruz in the Indian Ocean.” According to U.S. Central Command: “At 11:51 a.m. (Sanaa time) on April 24, a coalition vessel successfully engaged one anti-ship ballistic missile (ASBM) launched from Iranian-backed Houthi terrorist-controlled areas in Yemen over the Gulf of Aden. The ASBM was likely targeting the MV Maersk Yorktown, a U.S.-flagged, owned, and operated vessel with 18 U.S. and four Greek crew members. There were no injuries or damage reported by U.S., coalition, or commercial ships.”
When you look at the preponderance of market action, it seems like the oil market as well as the petroleum products are coiling for a potential big move. We think the risk of an upside move is more likely.
Natural gas has some glut issues to deal with. EBW analytics reported that Freeport LNG’s false start raised demand-side concerns into early May to amplify the downturn. Although weakness appears likely to linger in the near term, however, dry gas production continuing to grind lower may offer notable upside potential into mid-summer. For the natural gas market, we’re looking for a 92 BC injection this week.
Read Full Story »»»
DiscoverGold
Crude Continues to Sort Itself Out
By: Christopher Lewis | April 29, 2024
• The crude oil markets continue to be noisy, but at this point I think it has more likely buying pressure than selling when it comes to anything longer-term.
WTI Crude Oil Technical Analysis
The WTI crude oil market has gone back and forth during the course of the trading session here on Monday, as we are trying to sort out where to go next. Underneath we have the 50 day EMA, which is sitting right around the $81.50 level and is rising.
That has offered significant support over the last couple of trading sessions. So, at this point in time, I think a pullback is more likely than not going to offer a buying opportunity based on value. On the other hand, if we do turn around and break above the top of the Friday session, then it’s very likely we will go looking to test the $85 level above, which had been a major barrier.
Brent Crude Oil Technical Analysis
All things being equal, I do not have any interest in selling oil in the Brent market. It looks very much the same as crude oil. Factors continue to come in and look at geopolitics, the supply chain issues and of course, demand this time of year is generally positive for petroleum. So, I am looking to buy both grades of crude oil be it Brent or WTI.
But I also recognize that we are currently essentially in the middle of consolidation here in the Brent market. So it’s more or less a 50-50 shot as to where we go next. I prefer to buy dips in this market, especially if we get near the 50 day EMA, which is right around the $86 level above. We have a major ceiling at $90, which has a lot of psychology attached to it as well, so that might be difficult to overcome.
Read Full Story »»»
DiscoverGold
Almost every time 14-day highs on energy stocks hit this 3-4% level, $XLE goes risk-on
By: TrendSpider | April 26, 2024
• Almost every time 14-day highs on energy stocks hit this 3-4% level, $XLE goes risk-on.
Last week we touched it and have already seen a nice bounce.

Read Full Story »»»
DiscoverGold
WTI Crude Oil CoT: Peek Into Future Through Futures, How Hedge Funds Are Positioned
By: Hedgopia | April 27, 2024
• Following futures positions of non-commercials are as of April 23, 2024.
WTI Crude Oil: Currently net long 278.4k, down 21.7k.
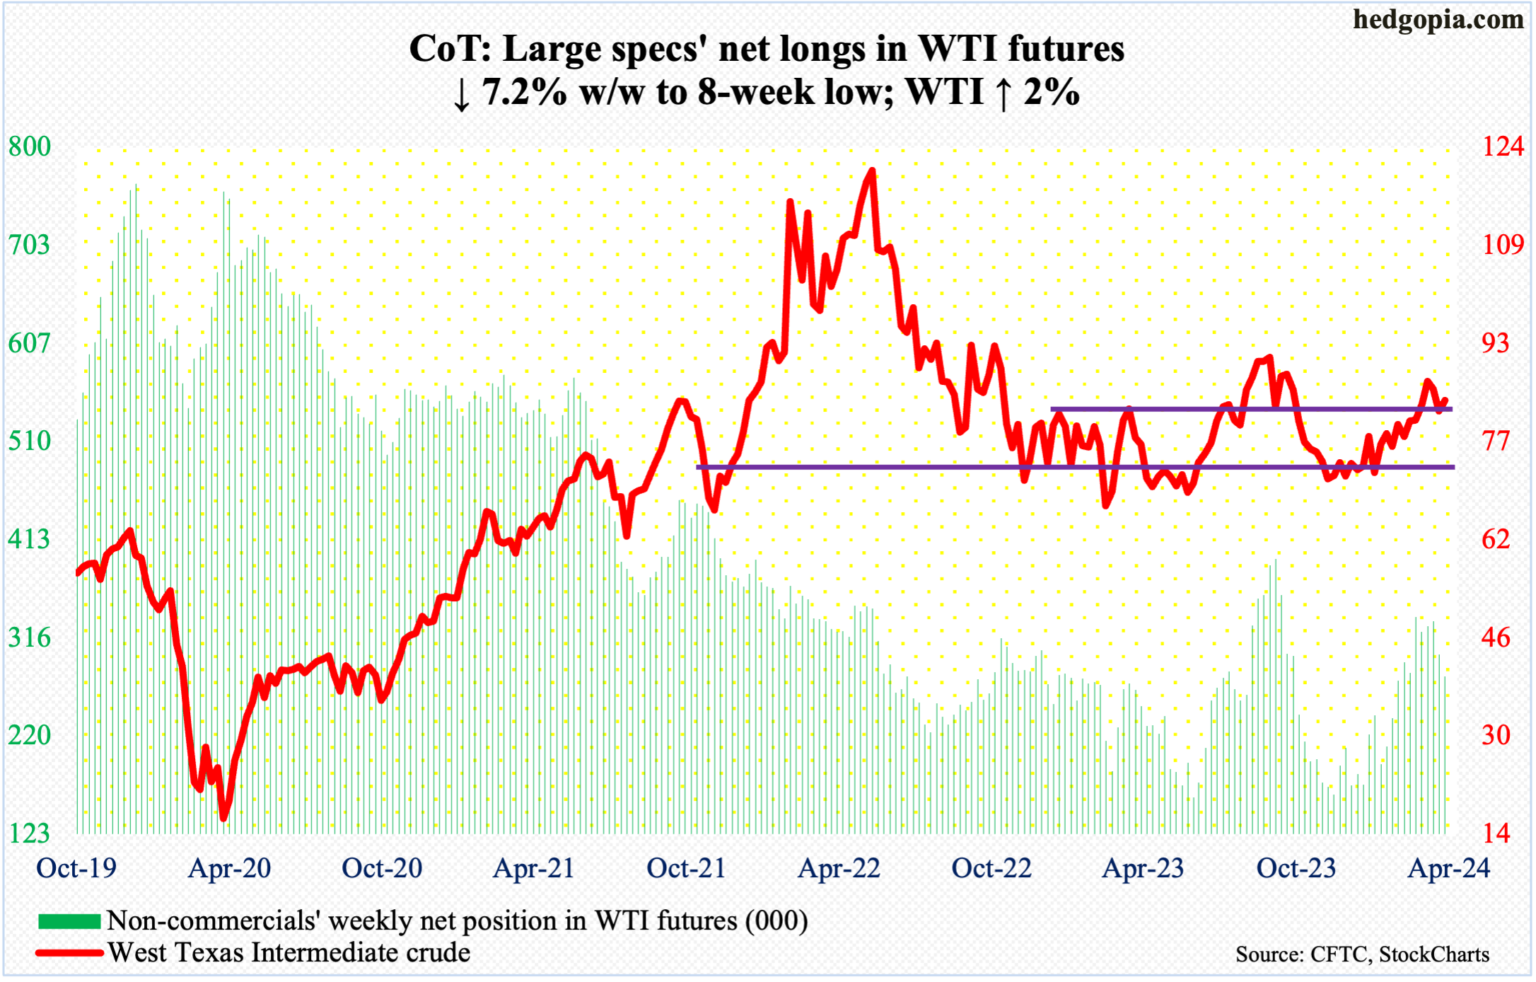
After dropping from $87.67 on the 12th to Monday’s low of $80.70, West Texas Intermediate crude quickly gave back nearly seven points intraday in seven sessions. Earlier, it bottomed at $67.71 last December.
Selling stopped at the 50-day, with the crude hugging the average ($81.49) for four sessions, ending the week up two percent to $83.85/barrel. With this, oil bulls also defended breakout retest at $81-$82. WTI went back and forth between $71-$72 and $81-$82 for 19 months before pushing through the upper end a month ago.
The weekly remains overbought, but the ball remains with the bulls so long as they defend $81-$82.
In the meantime, US crude production in the week to April 19th was unchanged for seven consecutive weeks at 13.1 million barrels per day; nine weeks ago, output was at a record 13.3 mb/d. Crude imports increased 36,000 b/d to 6.5 mb/d. As did distillate inventory, which rose 1.6 million barrels to 116.6 million barrels. Stocks of crude and gasoline, however, dropped 6.4 million barrels and 634,000 barrels respectively to 453.6 million barrels and 226.7 million barrels. Refinery utilization rose four-tenths of a percentage point to 88.5 percent.
Read Full Story »»»
DiscoverGold
NY Crude Oil Futures »» Weekly Summary Analysis
By: Marty Armstrong | April 27, 2024
NY Crude Oil Futures closed today at 8385 and is trading up about 17% for the year from last year's settlement of 7165. Caution is required for this market is starting to suggest it may now decline on the MONTHLY level. At the moment, this market has been rising for 3 months going into April reflecting that this has been only still, a bullish reactionary trend. As we stand right now, this market has made a new high exceeding the previous month's high reaching thus far 8767 while it has not broken last month's low so far of 7679. Nevertheless, this market is still trading above last month's high of 8321.
Up to now, we still have only a 3 month reaction rally from the low established during December 2023. We must exceed the 3 month mark in order to imply that a trend is developing.
ECONOMIC CONFIDENCE MODEL CORRELATION
Here in NY Crude Oil Futures, we do find that this particular market has correlated with our Economic Confidence Model in the past. The Last turning point on the ECM cycle low to line up with this market was 2020 and 2009 and 2001 and 1998 and 1994. The Last turning point on the ECM cycle high to line up with this market was 2022 and 2018 and 2011 and 2000.
MARKET OVERVIEW
NEAR-TERM OUTLOOK
The historical broader tone of the NY Crude Oil Futures has been a bearish consolidation following the high established back in 2008. Since then, this market has created 2 reaction highs which have been unable to break this overall protracted bearish consolidating trend. Still, the major low was made in 2023 and the market has bounced back for the last year. The last Yearly Reversal to be elected was a Bullish at the close of 2023.
This market remains in a positive position on the weekly to yearly levels of our indicating models. Nevertheless, it closed last year on the weak side down from 2022. Pay attention to the Monthly level for any serious change in long-term trend ahead.
The perspective using the indicating ranges on the Daily level in the NY Crude Oil Futures, this market remains moderately bullish currently with underlying support beginning at 8343 and overhead resistance forming above at 8455. The market is trading closer to the support level at this time.
On the weekly level, the last important high was established the week of April 8th at 8767, which was up 17 weeks from the low made back during the week of December 11th. We have seen the market drop sharply for the past week penetrating the previous week's low and yet it recovered to close above the previous week's close of 8222. We are still trading neutral on the Weekly Momentum Indicators and this is a warning that initial support has been breached. This strongly implies we should pay close attention now to the Weekly Bearish Reversals. If we begin to elect Weekly Bearish Reversals, then we are dealing with a more sustainable near-term correction. When we look deeply into the underlying tone of this immediate market, we see it is currently still in a semi neutral posture despite declining from the previous high at 8767 made 2 weeks ago. Still, this market is within our trading envelope which spans between 5669 and 10409.
INTERMEDIATE-TERM OUTLOOK
YEARLY MOMENTUM MODEL INDICATOR
Our Momentum Models are declining at this time with the previous high made 2021 while the last low formed on 2023. However, this market has declined in price with the last cyclical low formed on 2023 warning that this market remains weak at this time on a correlation perspective declining in both price and Momentum.
Looking at the longer-term monthly level, we did see that the market made a high in September 2023 at 9503. After a four month rally from the previous low of 8346, it made last high in September. Since this last high, the market has corrected for four months. However, this market has held important support last month. So far here in April, this market has held above last month's low of 7679 reaching 7679.
Some caution is necessary since the last high 9503 was important given we did obtain one sell signal from that event established during September 2023. That high was still lower than the previous high established at 12368 back during June 2022. Critical support still underlies this market at 6700 and a break of that level on a monthly closing basis would warn of a further decline ahead becomes possible. Nevertheless, at this time, the market is still weak.
DiscoverGold
|
Followers
|
100
|
Posters
|
|
|
Posts (Today)
|
0
|
Posts (Total)
|
10923
|
|
Created
|
04/21/06
|
Type
|
Free
|
| Moderators DiscoverGold | |||
Welcome to: Oil & Natural Gas - Energy - Commodities - Resources
Under Contruction:
OIL & GAS STOCK NEWS.COM
TICKER SPY.COM for DD & research
PLEASE READ - This is concern for all , market maker signal for shares.
100-I need shares
200-I need shares badly,but do not take it down
300-take the price down to get shares
400-trade it sideways based on supply and demand
500-gap one way or another,to the direction of the 500 trade.
ADDING THIS 4/22/06: In my experiences I Noticed When In Sub Penny Add a Zero!! - Mick
***DISCLAIMER***
- The Board Monitor and The Board Assistants herewith, are not licensed brokers and assume NO responsibility for the actions, investment decisions, and or messages posted on this forum.
- We do NOT recommend that anyone buy or sell any securities posted herewith. Any trade entered into risks the possibility of losing the funds invested.
- There are no guarantees when buying or selling any security.
PLEASE MARK BOARD & MODS -- PLUS SIGN UP FOR OUR EMAIL LIST!
| Volume | |
| Day Range: | |
| Bid Price | |
| Ask Price | |
| Last Trade Time: |


