


| Followers | 690 |
| Posts | 144980 |
| Boards Moderated | 34 |
| Alias Born | 03/10/2004 |
Tuesday, May 07, 2024 4:56:27 PM
By: Bruce Powers | May 7, 2024
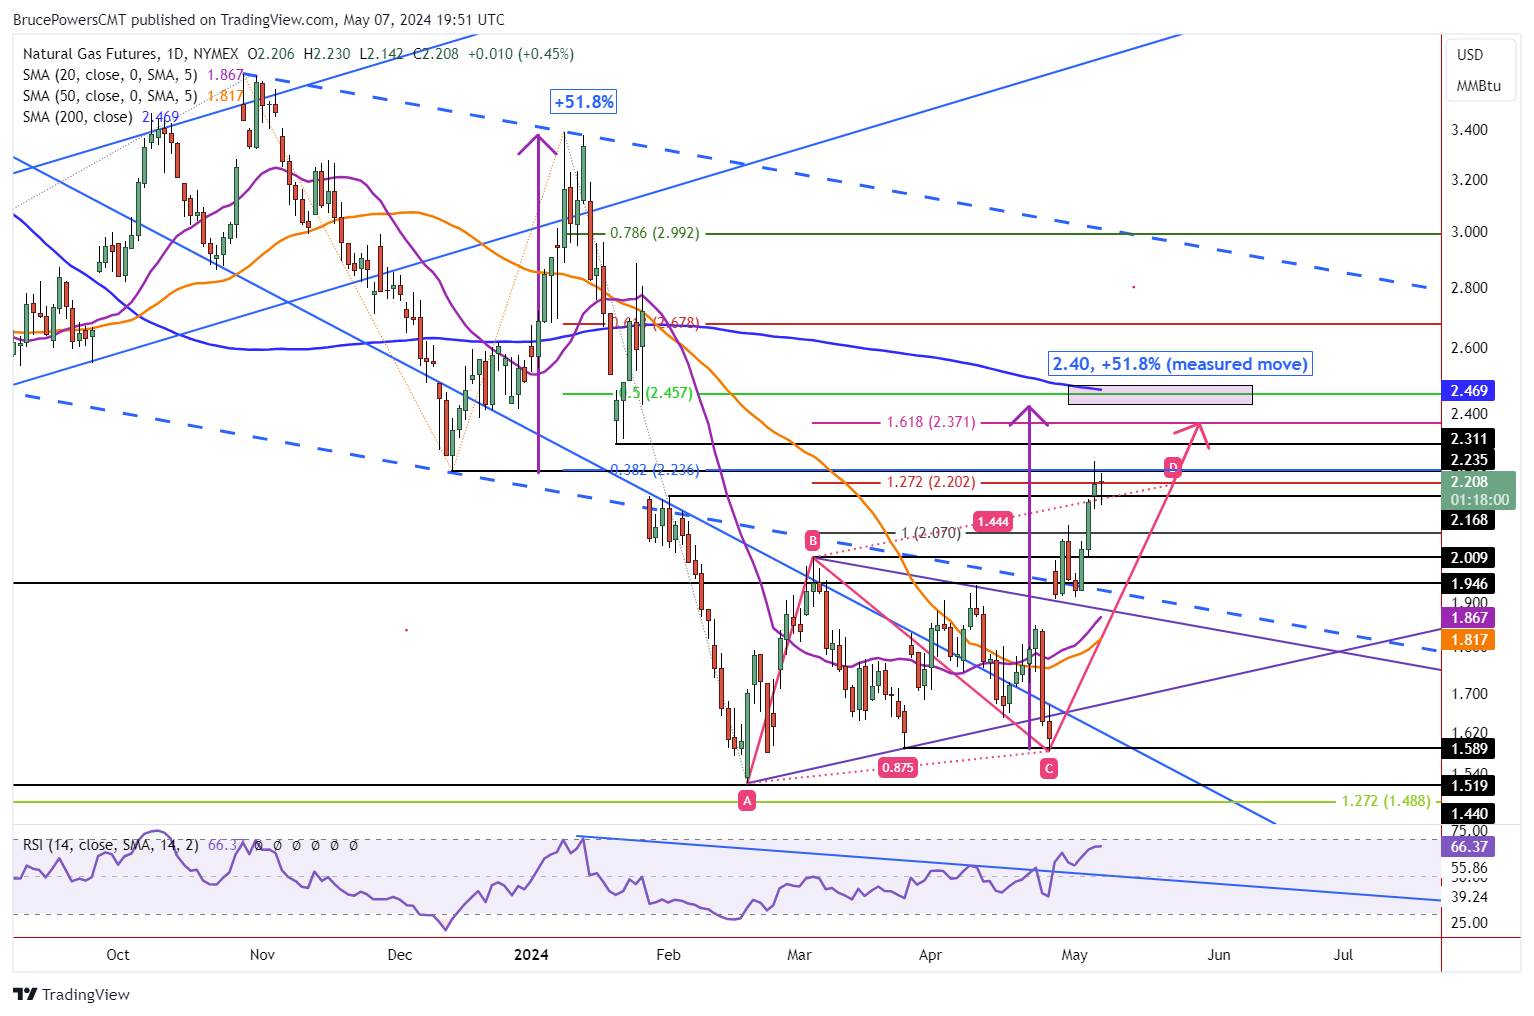
• As natural gas approaches resistance levels, a breakout above 2.23 could lead to testing higher potential resistance areas, including the 200-Day MA at 2.47.
Natural gas pauses its ascent to again test resistance around the 38.2% Fibonacci retracement, which is at 2.24. Today’s high was 2.23, at the time of this writing, and natural gas is poised to end Tuesday with an inside day bullish doji hammer candlestick pattern. It reflects continuing strength in the advance. Further, Monday’s high slightly exceeded the 38.2% resistance zone to reach a trend high of 2.26 before turning down. Another rise above the 38.2% price area could see a continuation of the rising trend if signs of strength continue thereafter.
Inside Day Sets Up
An inside day provides a potential bull trend continuation setup. A decisive advance above today’s high would trigger the breakout. Then, further signs of strength should be seen to reflect increasing demand, including a daily close above today’s high. Once yesterday’s high is exceeded, the path is clear to test higher potential resistance areas. As noted in prior articles, the key higher price area to watch is around the 200-Day MA, now at 2.47. It is also marked by the 50% retracement at 2.46. In addition, a measured move completes at 2.40.
Measured Move Targets 2.40
The measured move is looking for a match with the mid-December rally on a percentage basis. That rally ended at a high of 3.39 to complete a 51.8% advance. A similar size move for the current rally completes at 2.40. It deserves attention especially since the target is close to the 200-Day line. When two or more indicators identify a similar price zone, it is the market’s way of identifying an area of interest. Since there is some distance to be traveled to approach the 200-Day line, it is anticipated to act as resistance on the first approach.
Watch Support on Deeper Pullback
Alternatively, if a deeper pullback happens before a bullish continuation, a drop below today’s low of 2.14 will provide the next sign of weakening. Yesterday’s low of 2.13 may act as near-term support, but if not the prior recent trend high at 2.09 is then a target. During uptrend, it is common for resistance around a prior trend high to act as support during pullbacks.
Read Full Story »»»
 DiscoverGold
Information posted to this board is not meant to suggest any specific action, but to point out the technical signs that can help our readers make their own specific decisions. Caveat emptor!
• DiscoverGold
Kona Gold Beverage, Inc. Updates Multi-Million Dollar Merger and Posts Over $1.2 Million in Q3 Revenues • KGKG • Nov 15, 2024 10:36 AM
HealthLynked Corp. Announces Third Quarter and Year-to-Date 2024 Results with Strategic Restructuring, Third-Party Debt Repayment, and Core Technology Focus • HLYK • Nov 15, 2024 8:00 AM
Alliance Creative Group (ACGX) Releases Q3 2024 Financial and Disclosure Report with an increase of over 100% in Net Income for 1st 9 months of 2024 vs 2023 • ACGX • Nov 14, 2024 8:30 AM
Unitronix Corp. Publishes Its Cryptocurrency Portfolio Strategy • UTRX • Nov 14, 2024 8:05 AM
Avant Technologies and Ainnova Tech Form Joint Venture to Advance Early Disease Detection Using Artificial Intelligence • AVAI • Nov 12, 2024 9:00 AM
Swifty Global Announces Launch of Swifty Sports IE, Expanding Sports Betting and Casino Services in the Irish Market • DRCR • Nov 12, 2024 9:00 AM

