


| Followers | 686 |
| Posts | 142323 |
| Boards Moderated | 35 |
| Alias Born | 03/10/2004 |
Thursday, May 16, 2024 5:23:44 PM
By: Bruce Powers | May 16, 2024
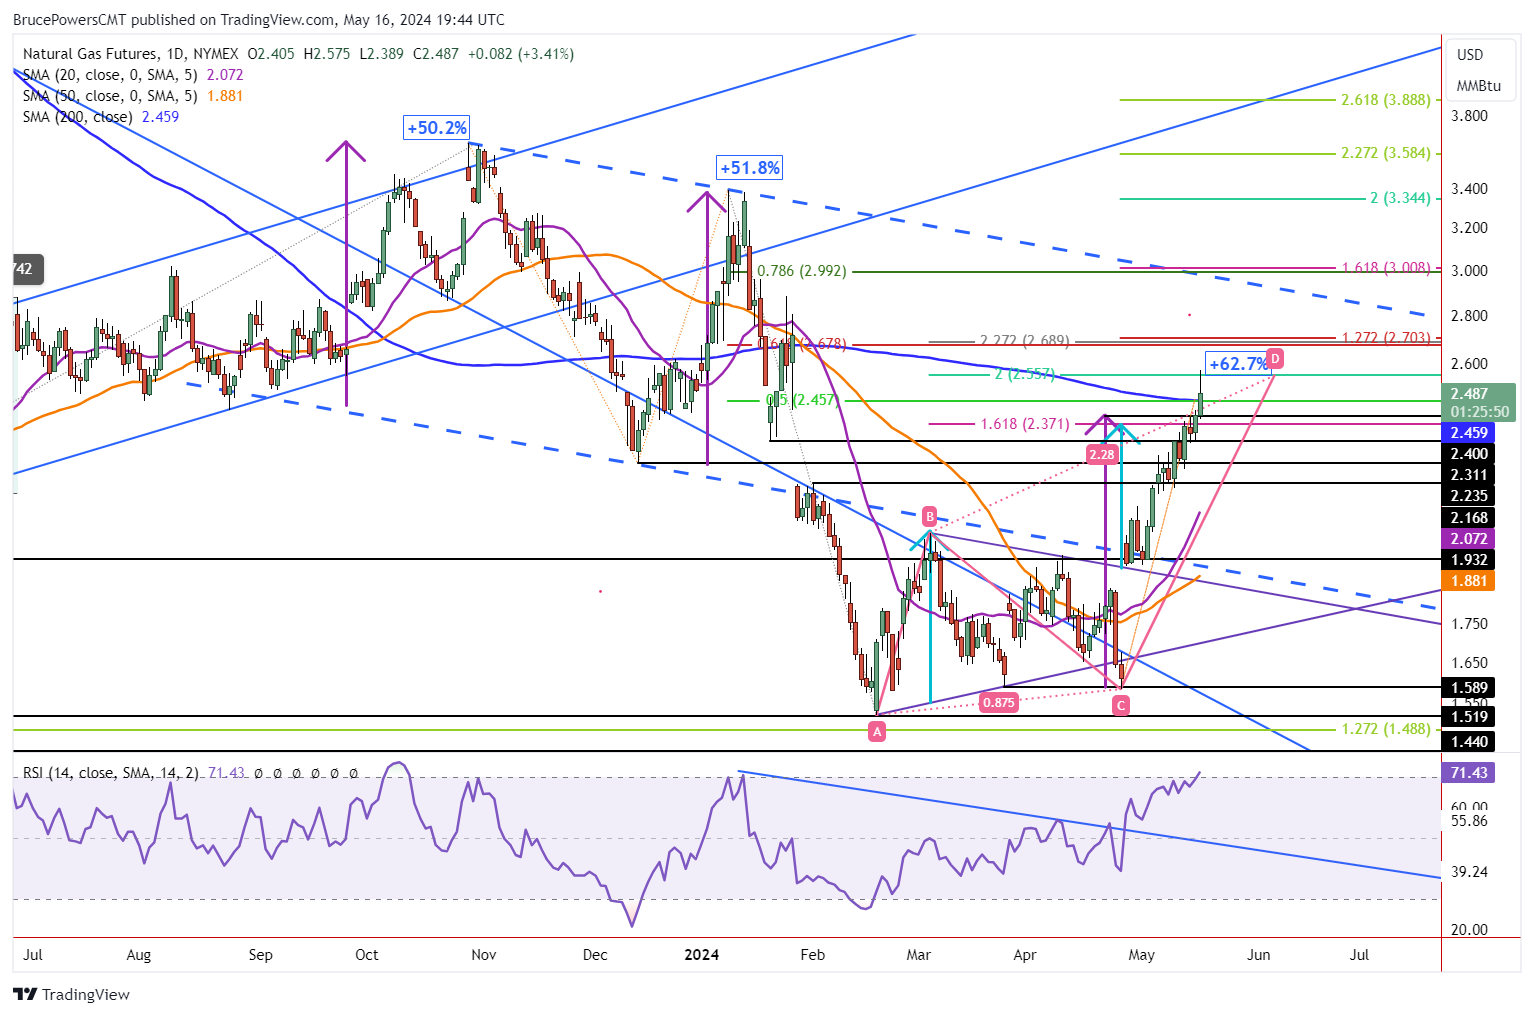
• The recent surge in natural gas prices has been remarkable, with the commodity hitting a new high and breaking through key resistance levels.
Natural gas blasted through potential resistance at the 200-Day MA on Thursday to hit a new trend high of 2.575. Resistance then kicked in leading to an intraday pullback. That high completed a rising ABCD pattern where the CD leg was 200% of the advance in the AB leg of the pattern. The 200-Day MA is at 2.46 and natural gas continues to trade above that price level at the time of this writing. A daily close above the 200-Day line indicates that the uptrend may have more to go.
Can Strength Continue?
Certainly, today’s bullish price action is a sign of strength as natural gas recently busted through three price zones that could have seen resistance, especially the 200-Day line. However, can demand remain strong enough to take out today’s high and keep rising? That remains to be seen.
Rally Extended
The current rally is extended and closer to a top than it has been. As of today’s high, natural gas is up by 62.7% from the April 25 swing low at 1.58. That makes the current rally the largest on a percentage basis since the initial trend low from February 2023. Nevertheless, if the 200-Day MA can continue to act as support, the price of natural gas has a chance of continuing its rise. The next higher target zone is at 2.68 to 2.70. Those price levels are the 61.8% Fibonacci retracement and a 127.2% extension of a 51.8% measured move (purple arrows) that matches the rally beginning in August 2023, respectively. The high target is the top blue dashed falling channel line.
Drop Below 2.39 Should Lead to Deeper Pullback
A decisive drop below the 200-Day MA may provide an initial indication that a retracement may be coming. But a drop below today’s low of 2.39 will provide a clearer short-term bearish signal. Potential support from the 20-Day MA is down at 2.07. Higher price levels to watch on the way down are marked on the chart in black right extended lines from prior swing highs and lows. They include 2.31, 2.23, and 2.17. Fibonacci levels will be added on the chart if a retracement begins.
Read Full Story »»»
 DiscoverGold
Information posted to this board is not meant to suggest any specific action, but to point out the technical signs that can help our readers make their own specific decisions. Caveat emptor!
• DiscoverGold
Mass Megawatts Announces $220,500 Debt Cancellation Agreement to Improve Financing and Sales of a New Product to be Announced on July 11 • MMMW • Jun 28, 2024 7:30 AM
VAYK Exited Caribbean Investments for $320,000 Profit • VAYK • Jun 27, 2024 9:00 AM
North Bay Resources Announces Successful Flotation Cell Test at Bishop Gold Mill, Inyo County, California • NBRI • Jun 27, 2024 9:00 AM
Branded Legacy, Inc. and Hemp Emu Announce Strategic Partnership to Enhance CBD Product Manufacturing • BLEG • Jun 27, 2024 8:30 AM
POET Wins "Best Optical AI Solution" in 2024 AI Breakthrough Awards Program • POET • Jun 26, 2024 10:09 AM
HealthLynked Promotes Bill Crupi to Chief Operating Officer • HLYK • Jun 26, 2024 8:00 AM

