| Followers | 689 |
| Posts | 143817 |
| Boards Moderated | 35 |
| Alias Born | 03/10/2004 |
Monday, April 29, 2024 6:00:21 PM
By: Bruce Powers | April 29, 2024
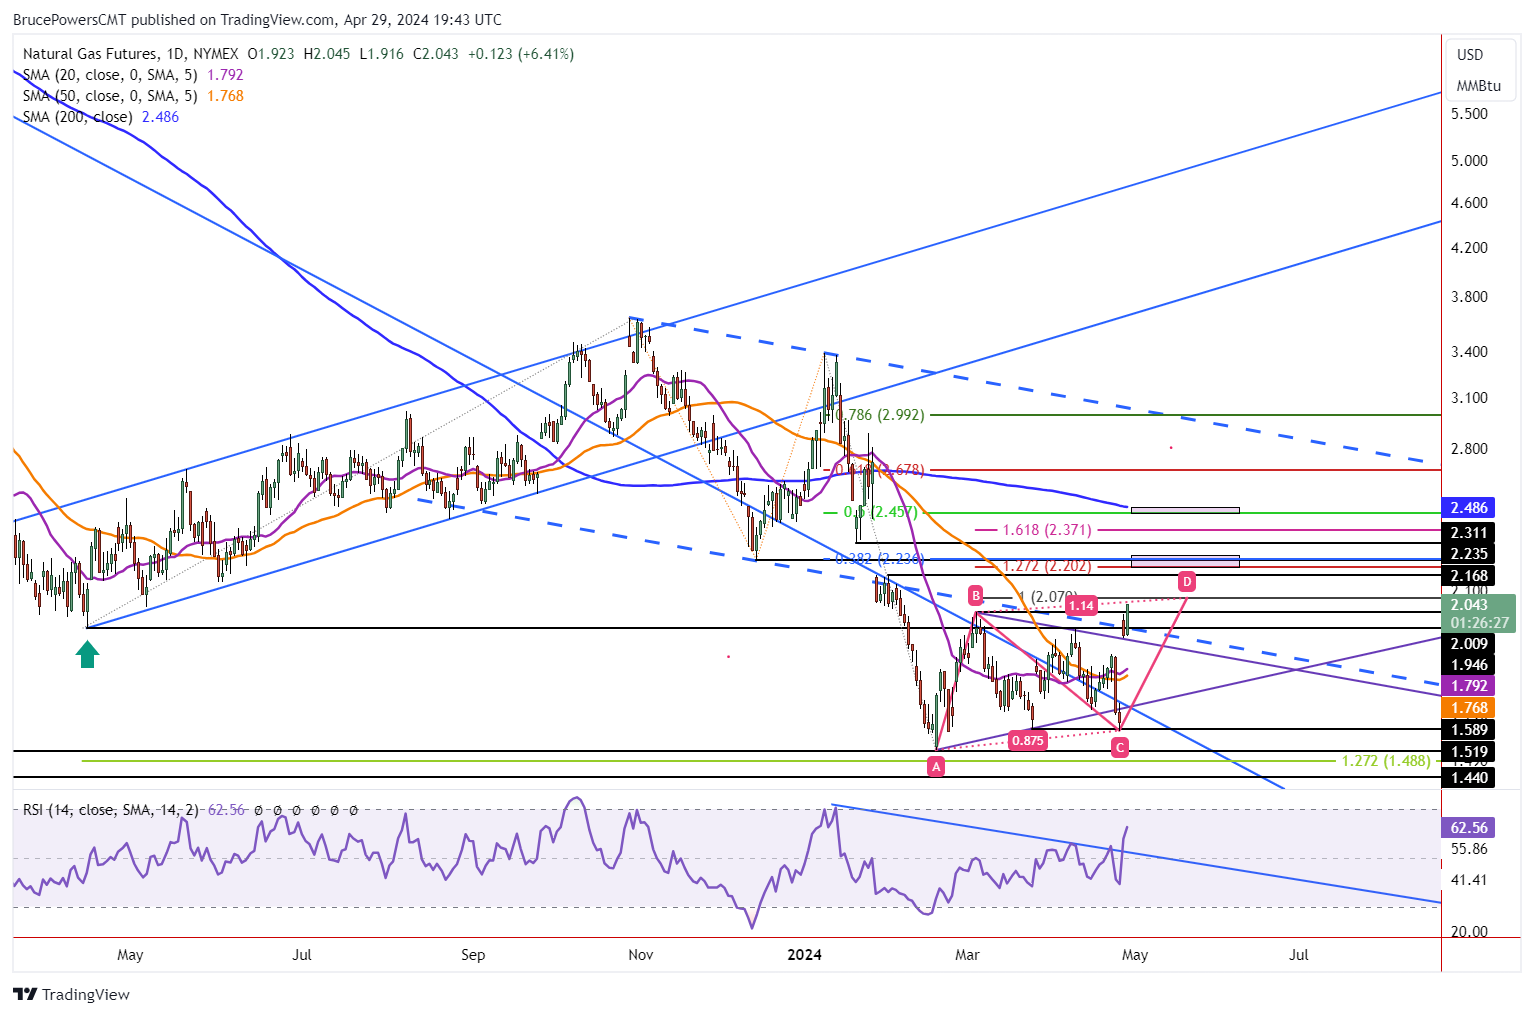
• With a breakout above 2.01, natural gas is eyeing targets at 2.07 and then 2.20, supported by a potential retracement to 2.22 before aiming for the 200-Day MA at 2.49.
Natural gas rose above Friday’s high on Monday before triggering a breakout above the top of a symmetrical triangle at 2.01 (B). The high of the day at the time of this writing was 2.04, which was followed by an intraday pullback. Of interest will be the daily close.
A daily close above 2.01 will be a stronger sign of strength than a close below it as it would confirm the breakout above (B). Also, keep an eye on today’s close relative to Friday’s high. Once a daily close above 2.01 confirms the bullish breakout, natural gas should be ready to proceed towards higher target areas.

Upside Targets
The first upside target is close by at 2.07. If hit, it will complete an initial target for a rising ABCD pattern that is identifying price symmetry between the AB and CD legs of the advance. However, since it is close to the top of a symmetrical triangle higher prices remain on the radar. The second target from the ABCD pattern is 2.20. That target completes an ABCD pattern where the CD leg is extended by 127.2% of the AB portion of the advance.
It begins with a target range from 2.07 to the prior December 13 swing low at 2.24. Inside that price range is the completion of a 38.2% Fibonacci retracement at 2.24. Generally, a 38.2% retracement is usually the more common minimum retracement that might be seen. This means that since natural gas is showing improving strength, the 38.2% retracement should eventually be reached, at a minimum.
Signs of Strength
Last Friday natural gas rose above the lower dashed blue channel line before ending the day below it. Today, it is on track to close above it for the first time. The lower line is parallel to the top falling dashed blue line that connects the October and January swing highs. Further, natural gas is set to end on Monday at its highest daily closing price since February 5. If the top of the first target zone at 2.235 is exceeded, the next higher zone is around the 200-Day MA, currently at 2.49. It is further anchored by the 50% retracement at 2.46.
Read Full Story »»»
 DiscoverGold
Information posted to this board is not meant to suggest any specific action, but to point out the technical signs that can help our readers make their own specific decisions. Caveat emptor!
• DiscoverGold
North Bay Resources Announces Mt. Vernon Gold Mine Bulk Sample, Sierra County, California • NBRI • Sep 11, 2024 9:15 AM
One World Products Issues Shareholder Update Letter • OWPC • Sep 11, 2024 7:27 AM
Kona Gold Beverage Inc. Reports $1.225 Million in Revenue and $133,000 Net Profit for the Quarter • KGKG • Sep 10, 2024 1:30 PM
Element79 Gold Corp Announces 2024 Clover Work Plans & Nevada Portfolio Updates • ELMGF • Sep 10, 2024 11:00 AM
Nightfood Holdings Inc. Completes Major Step on Uplist Journey by Closing Strategic All-Stock Acquisition of CarryoutSupplies.com • NGTF • Sep 10, 2024 8:15 AM
Element79 Gold Corp. Announces Sale of 100% Interest in Elder Creek, North Mill Creek, and Elephant Projects to 1472886 B.C. Ltd. • ELEM • Sep 9, 2024 9:34 AM


