


| Followers | 686 |
| Posts | 142269 |
| Boards Moderated | 35 |
| Alias Born | 03/10/2004 |
Friday, May 03, 2024 5:09:55 PM
By: Bruce Powers | May 3, 2024
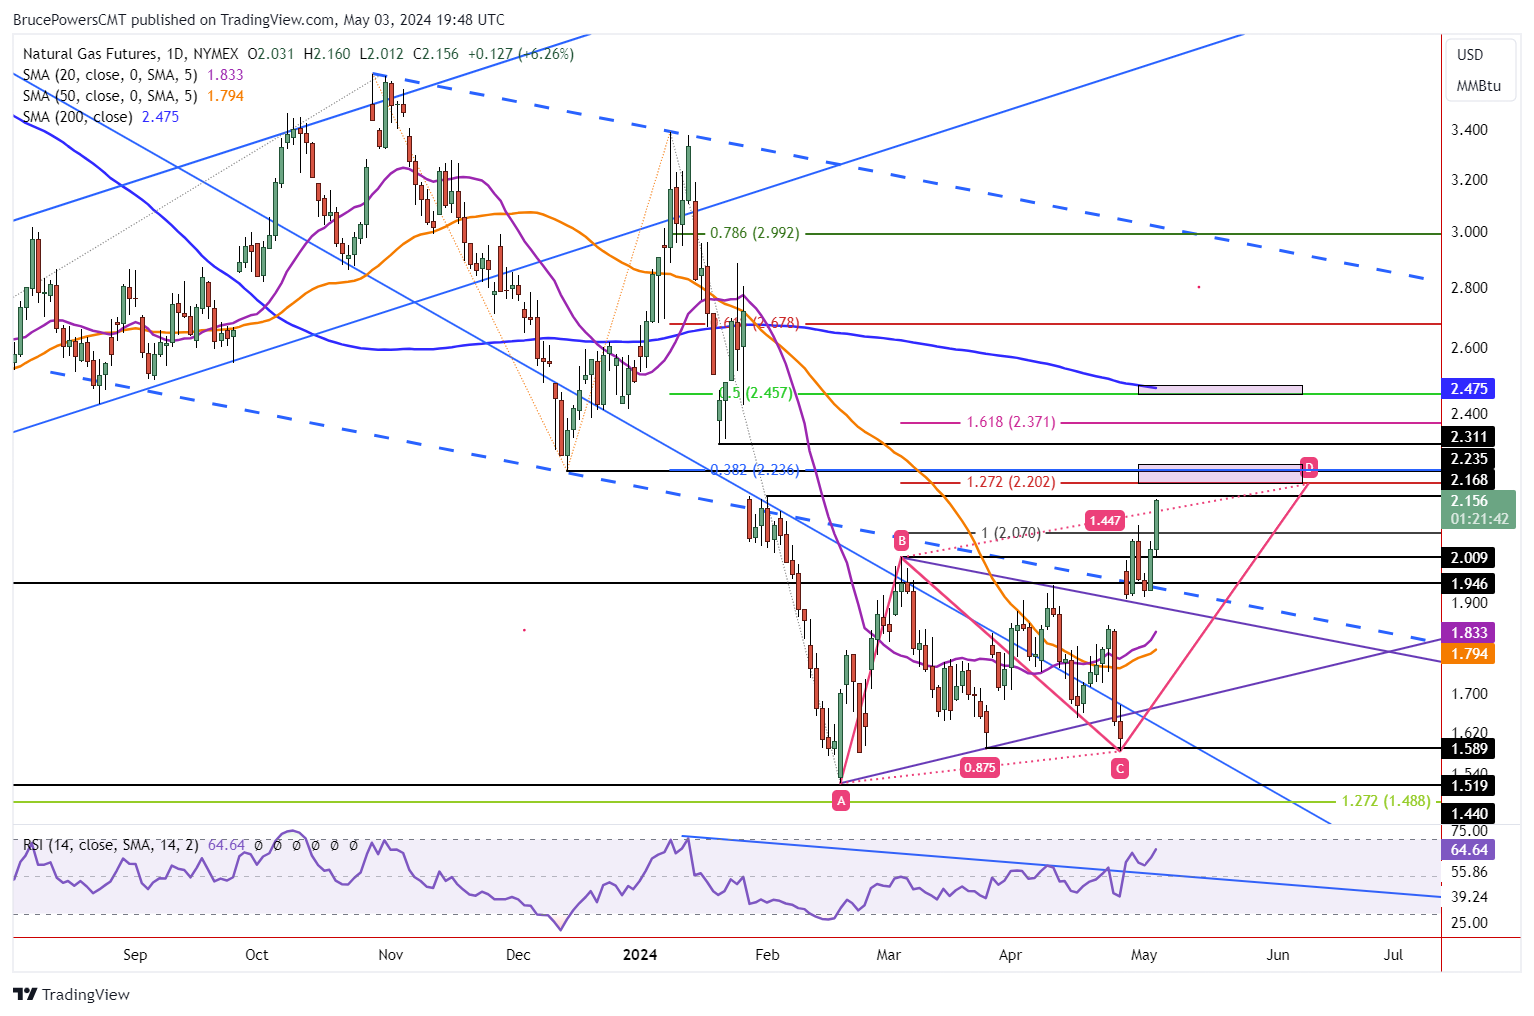
• Natural gas breaks to a new trend high of 2.16, triggering a monthly breakout. It is likely to close strong, hinting at a continuation higher into next week.
Natural gas breaks out to a new trend high of 2.16 on Friday and it is on track to close strong, in the upper quarter of the day’s range. If it does, a continuation higher heading into next week looks to be on the table. The weekly chart is also set to end strong for the second week in a row.
Further, a monthly breakout triggered today on a move above April’s high of 2.09. Today’s high approached a resistance zone from late-January and early-February with a high for the range at 2.17. If that high gets busted, higher price levels become targets.
Improvement in Momentum
Given the improvement in momentum and the likely strong closing price for the week, the initial targets could eventually be exceeded. That is, if demand remains strong. The next target zone begins with the completion of an extended rising ABCD pattern at 2.20. That is where the CD leg of the advance is 127.2% of the AB leg.
Nonetheless, an initial Fibonacci retracement of 38.2% is at 2.24, with that price level confirmed by previous support from the December 11 swing low. If natural gas can get through that price level and keep rising it may have a chance to eventually test resistance around the 200-Day MA, which is currently at 2.47.
Signs of Strength in Monthly Chart
Confirmation of strength on both the monthly and weekly charts provides further evidence for a bullish reversal of the bottom from February. This means that that rally should have more to go, and it may just be getting started. Today’s price action extends an advance off support around the lower blue dash trend channel line.
In general, once prices rise above from support at the bottom of a channel, an eventual target is the top channel line. This doesn’t mean it will be reached, just that it could be. Of course, the price represented by the upper line will depend on when it is reached, given that it is downward sloping. However, given that it is now a potential target, it may make the lower price targets more likely to be reached.
Read Full Story »»»
 DiscoverGold
Information posted to this board is not meant to suggest any specific action, but to point out the technical signs that can help our readers make their own specific decisions. Caveat emptor!
• DiscoverGold
Bantec's Howco Short Term Department of Defense Contract Wins Will Exceed $1,100,000 for the current Quarter • BANT • Jun 25, 2024 10:00 AM
ECGI Holdings Targets $9.7 Billion Equestrian Apparel Market with Allon Brand Launch • ECGI • Jun 25, 2024 8:36 AM
Avant Technologies Addresses Progress on AI Supercomputer-Driven Data Centers • AVAI • Jun 25, 2024 8:00 AM
Green Leaf Innovations, Inc. Expands International Presence with New Partnership in Dubai • GRLF • Jun 24, 2024 8:30 AM
Bemax Inc. Positions to Capitalize on Industry Growth with New Improved Quality of Mother's Touch® Disposable Diapers • BMXC • Jun 24, 2024 8:00 AM
Last Shot Hydration Drink Announced as Official Sponsor of Red River Athletic Conference • EQLB • Jun 20, 2024 2:38 PM

