


| Followers | 686 |
| Posts | 142323 |
| Boards Moderated | 35 |
| Alias Born | 03/10/2004 |
Monday, May 13, 2024 4:50:05 PM
By: Bruce Powers | May 13, 2024
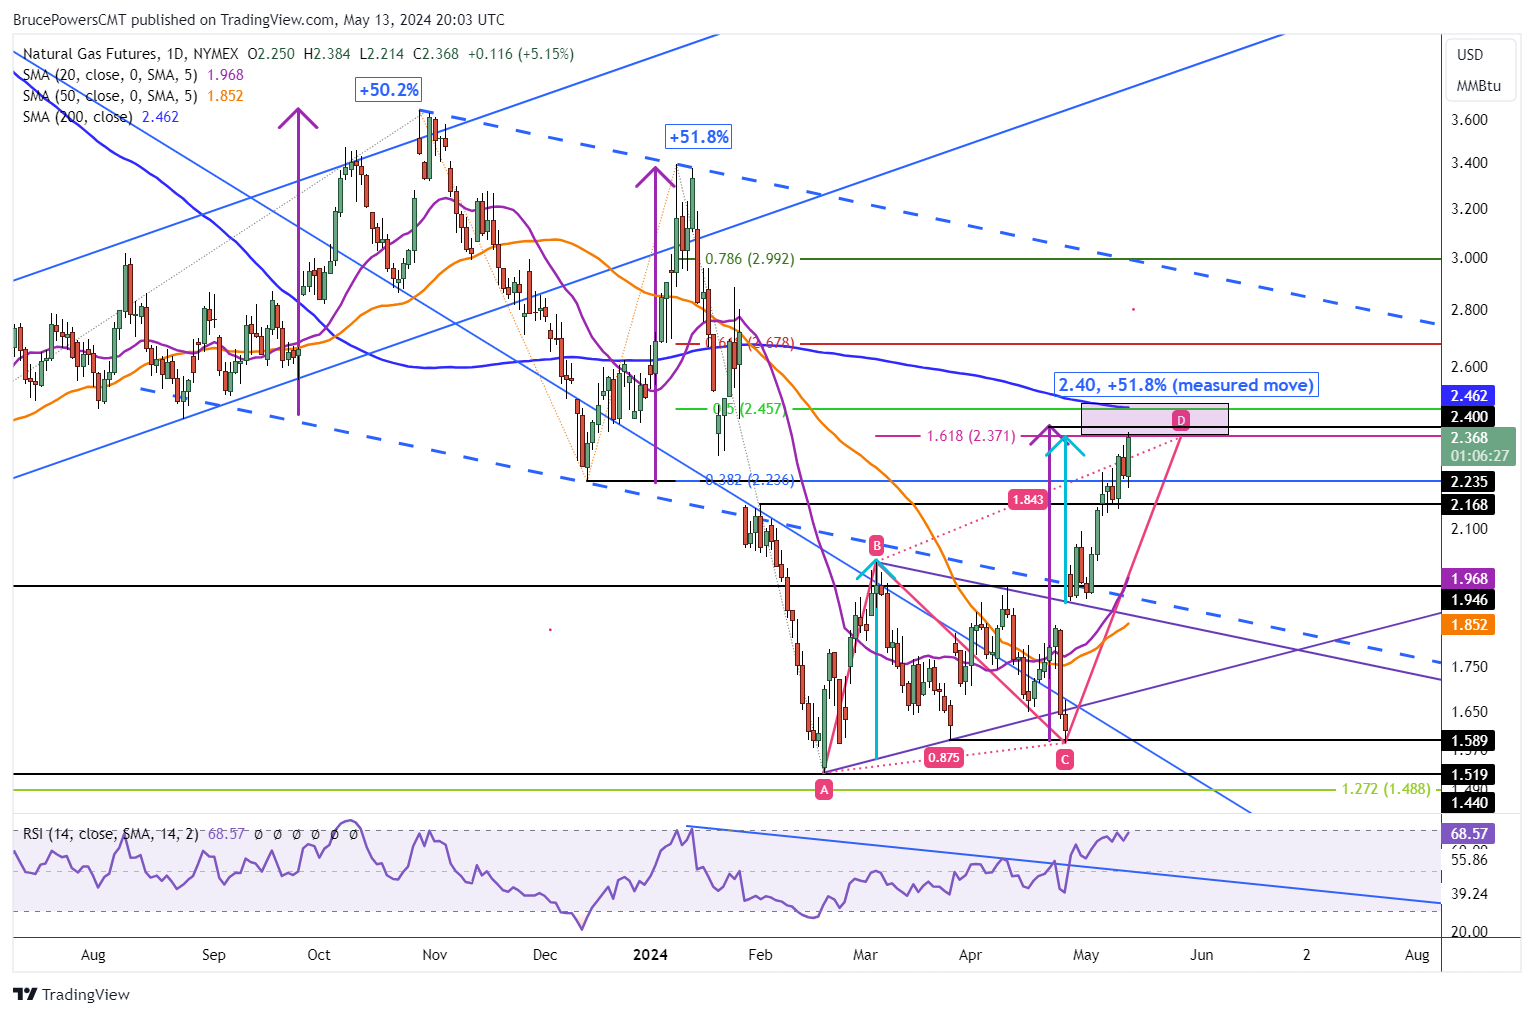
• Technical analysis highlights potential price reversal for natural gas, with resistance at 2.37 to 2.46 indicating a potential turning point.
Following a drop below Friday’s low earlier in Monday’s session, natural gas rallied to a new trend high, generating a bullish outside day. In addition, last week’s high was exceeded. If today’s close is above last week’s high of 2.34, another bullish clue will be indicated.
Demand remains strong at the time of this writing as trading continues near the highs of the day, which currently is 2.38. Natural gas has entered the start of a potential resistance zone that begins at 2.37 and ends around the 200-Day MA, now at 2.46. That range is derived from several pieces of analysis.
Weight of Technical Evidence
Like criminal investigations shown on TV, technical analysis also looks at the weight of evidence to assist in identifying what the market might be telling us. Clues are provided in price behavior and price patterns. The approaching resistance zone is a good example of this as there are at least five pieces of analysis pointing to potential resistance in the range of 2.37 to 2.46.
In other words, there is a confluence of potential price targets in that range. Either could turn the market down on their own. But when combined relatively close together they provide a warning sign to pay extra attention to price action as the zone is entered. And for simplicity, not all clues are included in today’s article.
Confluence of Price Targets from 2.37 to 2.46
The specific price levels identified are 2.37, 2.40 and 2.46. Two indicators point to 2.37, the completion of a rising ABCD pattern extended by the 161.8% Fibonacci ratio, sometimes referred to as the golden ratio, and a target from the bottom symmetrical triangle consolidation pattern (light blue arrows).
Next is the 2.40 price target. It is derived from the completion of a measured move that matches the percentage rise in the price of natural gas from the December 13 swing low. The December 13 rally ended with a 51.8% advance in the price of natural gas. Similarly, the current rally from the April 25 swing low, will be up by 51.8% at a price of 2.40.
Read Full Story »»»
 DiscoverGold
Information posted to this board is not meant to suggest any specific action, but to point out the technical signs that can help our readers make their own specific decisions. Caveat emptor!
• DiscoverGold
Mass Megawatts Announces $220,500 Debt Cancellation Agreement to Improve Financing and Sales of a New Product to be Announced on July 11 • MMMW • Jun 28, 2024 7:30 AM
VAYK Exited Caribbean Investments for $320,000 Profit • VAYK • Jun 27, 2024 9:00 AM
North Bay Resources Announces Successful Flotation Cell Test at Bishop Gold Mill, Inyo County, California • NBRI • Jun 27, 2024 9:00 AM
Branded Legacy, Inc. and Hemp Emu Announce Strategic Partnership to Enhance CBD Product Manufacturing • BLEG • Jun 27, 2024 8:30 AM
POET Wins "Best Optical AI Solution" in 2024 AI Breakthrough Awards Program • POET • Jun 26, 2024 10:09 AM
HealthLynked Promotes Bill Crupi to Chief Operating Officer • HLYK • Jun 26, 2024 8:00 AM

