 Market Data
  Markets
Support: 888-992-3836
Copyright © 2023 InvestorsHub Inc.


Replies to post #61089 on Triple 000 and Sub-penny Chart Plays


We had net income of $91,481
for the three months ended September 30, 2015
as compared to a loss of $230,024
for the three months ended September 30, 2014.
Three month period ended September 30, 2015
versus September 30, 2014
We had net income of $91,481
for the three months ended September 30, 2015
as compared to a loss of $230,024
for the three months ended September 30, 2014.
This significant change
is solely due to the significant "income'
from "change in derivative liability"
resulting from conversion of notes in the 2015 period
that lowered the derivative liability significantly
that was offset only partially by expense
for newly convertible notes.
Our gross sales
in the three months ended September 30, 2015
were $428,405 with cost of goods sold of $359,278
for a gross profit of $69,127.
This compared to gross sales of $420,484,
costs of goods sold of $348,526
and gross profit of $71,958
for the three months ended September 30, 2014.
Our sales in the 2015 period increased $7,921
or approximately 2% versus 2014.
Cost of goods sold increased by approximately 3%
to approximately 84% of sales in 2015
versus approximately 83% of sales in 2014.
This represents minimal change in the 2015
versus the 2014 period.
The company will continue a more aggressive coupon marketing campaign during the remainder of 2015
through which it believes sales will increase,
but will be offset somewhat by the higher discounts.


With the likelihood of a rate increase on Wednesday,
our leading indicator is suggesting one
for the first time since 2006,
and options expiration Friday,
it should be quite a wild week.
After the Primary IV downtrend low in August
we labeled the five waves up
of the new uptrend with Major waves.
This was in anticipation
that this first uptrend could end the bull market.
The five waves progressed as expected,
until the fifth wave failed to make a higher high
in both the SPX/DOW.
With the NDX/NAZ making higher highs,
and the SPX/DOW not,
we counted this pattern as a fifth wave failure.
LONG TERM: bull market
Bad news is good news
has been the theme of this bull market.
When the economy was in the Great Recession
the FED started QE 1 and the bull market began.
When the economy was still weak in 2010
the FED started QE 2.
Now it looks like
the long awaited first rate increase since 2006
is heading our way.
The bad news of the current correction
will lead to the good news of an extending bull market
into at least next year.
Primary V now has to divide
into five Major waves/trends
before the bull market ends.
The bad news is good news, the bull market continues.


Wednesday Update
Posted on December 16, 2015
SHORT TERM: FED raises rates 25 bps, DOW +224
The market gapped again today for the second day in a row.
After hitting a new rally high at SPX 2060
the market pulled back to 2042 after the FED announcement.
After that it rallied in three waves SPX: 2064-2049-2077.
We have labeled on the hourly chart
the five waves up to SPX 2060 as Minor 1,
the pullback to SPX 2042 as Minor 2,
and Minor 3 underway from that low.
These waves are all within Intermediate wave one
of the potential, yet unconfirmed,
Major wave 3 uptrend.
With year end options expiration still to go,
this wild week is not quite over just yet.
Short term support is at the 2070 pivot and SPX 2040’s,
with resistance at the 2085 pivot and SPX 2104.
Short term momentum displayed a negative divergence
at the morning high, pulled back,
and then ended the day quite overbought.


Thursday Update
Posted on December 17, 2015
SHORT TERM: the wild week continues, DOW -253
After a slightly higher open today
the market had its biggest decline
since this potential uptrend began on Monday at SPX 1993.
It has been a wild week: +3% by Wednesday,
down 1.5% on Thursday.
And still one more day left in the week.
After five waves up to SPX 2060 early Wednesday,
the market pulled back to 2042 right after the rate increase.
After that the market rallied in three waves.
So we thought Minor 2 had ended at SPX 2042.
Today’s action suggests otherwise.
We still have the five up to SPX 2060 for Minor 1,
but Minor 2 now looks irregular.
Irregular second waves have been popping up lately.
The market displayed one in September,
then another at the beginning of that huge October rally.
Looks like we are dealing with a third 1-ab2 for this uptrend.
Short term support is SPX 2042 and the 2019 pivot,
with resistance at the 2070 and 2085 pivots.
Short term momentum is declining from quite overbought
to near oversold.
Monday Update
Posted on December 21, 2015
SHORT TERM: gap up opening, DOW +123
The market gapped up at the open today
creating the best rally since the recent decline
from SPX 2077 began.
But that rally ended
a few minutes after the market opened at SPX 2023,
and the market completely closed the upside gap
at SPX 2006 by 11:30.
After that the market bounced around a bit
before rallying back to SPX 2021 at the close.
For the third day in a row
the market opened at the high of the day
and declined after that.
Change the pattern, change the trend ?
After seven waves down into Friday’s SPX 2005 low,
the market bounced around between 2006 and 2023 today.
The action looked choppy.
Short term support at the OEW 2019 pivot and SPX 1993,
with resistance at SPX 2042 and the 2070 pivot.
Short term momentum rose to just above neutral
off of Friday’s positive divergence,
where it ended the day.

Tuesday Update
Posted on December 22, 2015
SHORT TERM: another gap up opening, DOW +167
The market gapped up today
for the second day in a row
and fourth time in the last six trading days.
It opened at SPX 2030,
pulled back to 2020,
and then rallied to 2043.
No opening at the high of the day today,
so the trend may be changing.
We posted a potential Minor a low/Major 2 low
labeling at SPX 2005 on the hourly chart during the day.
Lots of mixed signals at Monday’s SPX 2006 low.
Currently we see a rally to SPX 2023
off Friday’s 2005 low,
then a pullback to 2006,
followed by a five wave advance to 2043 today.
Thinking it could be an a-b-c counter-rally: 2023-2006-2043,
or a small 1-2-3. With the market extremely overbought
the next pullback should give us some hints.
Short term support is at the 2019 pivot and SPX 1993,
with resistance at SPX 2042 and the 2070 pivot.
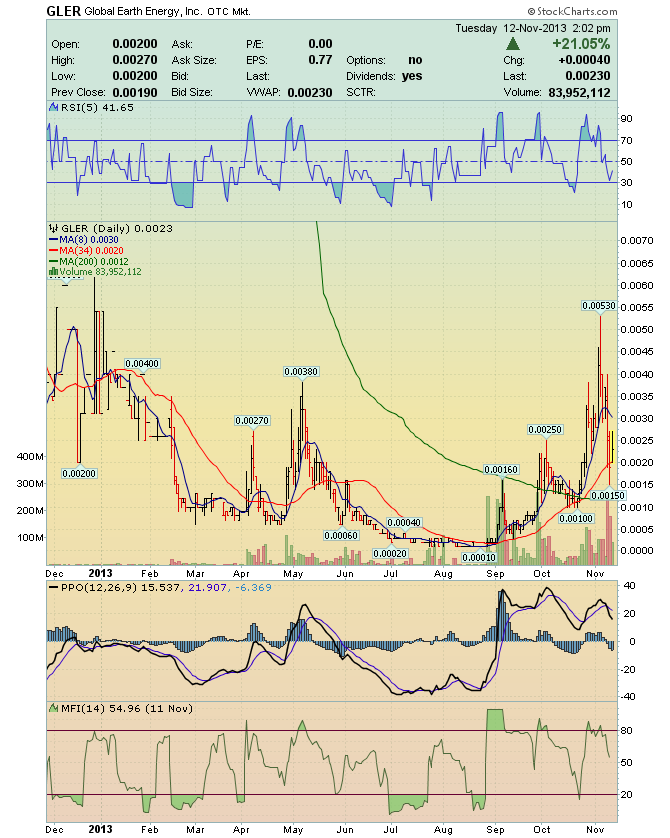
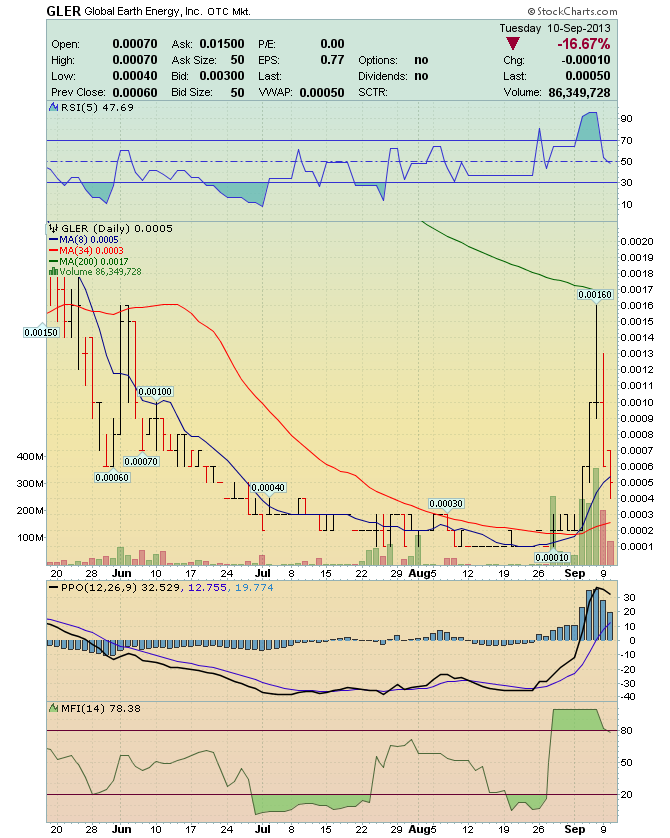
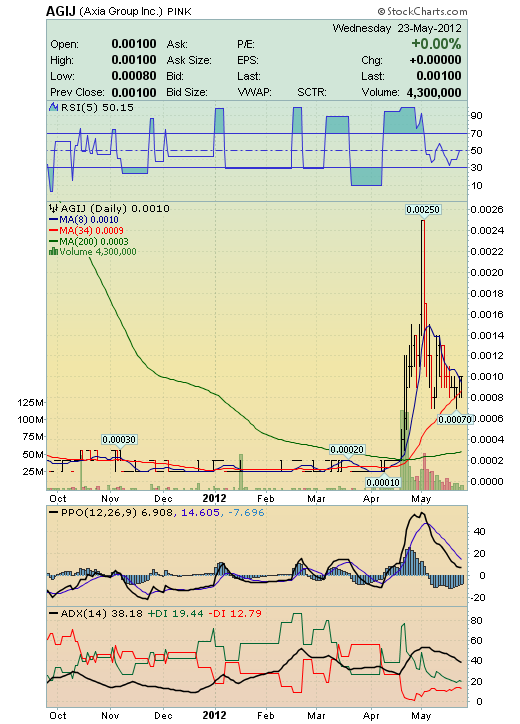
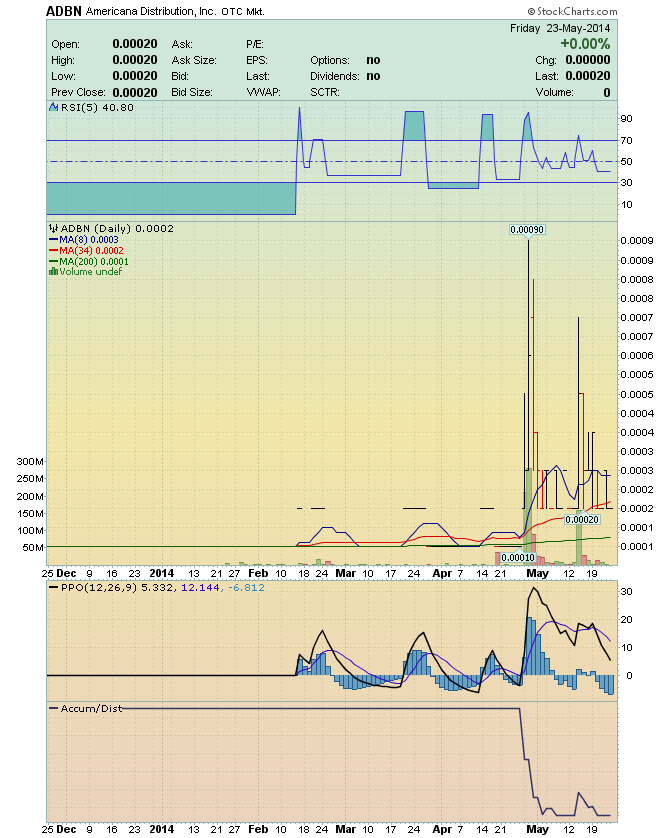
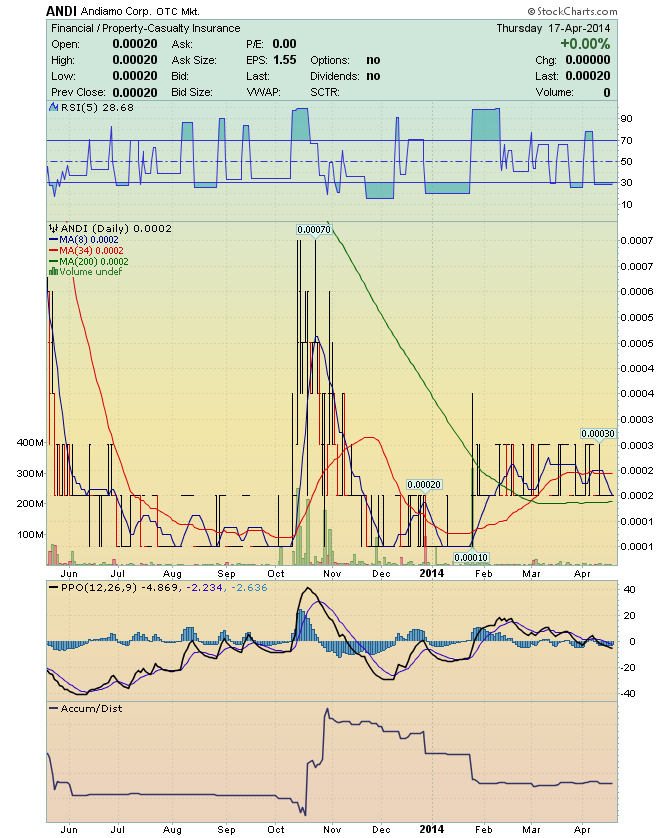
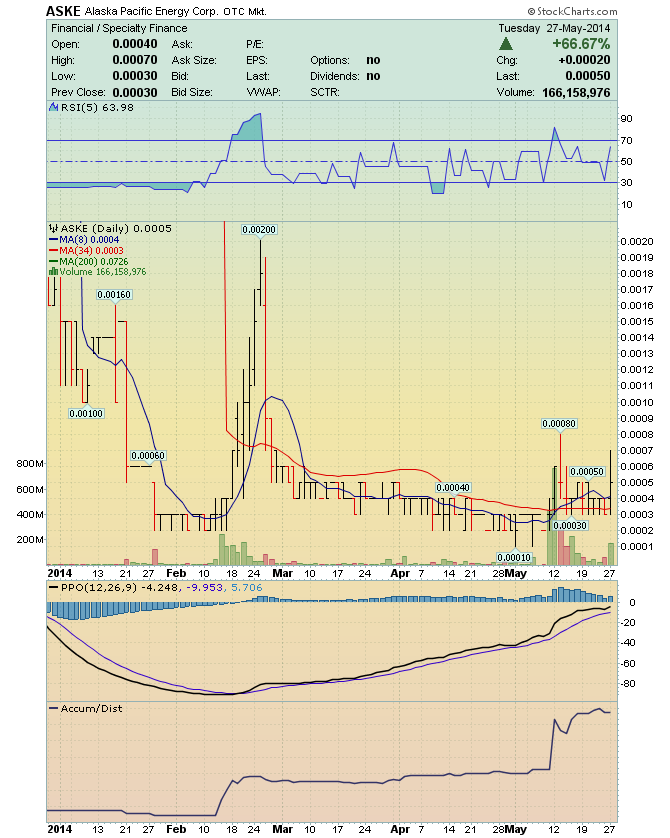
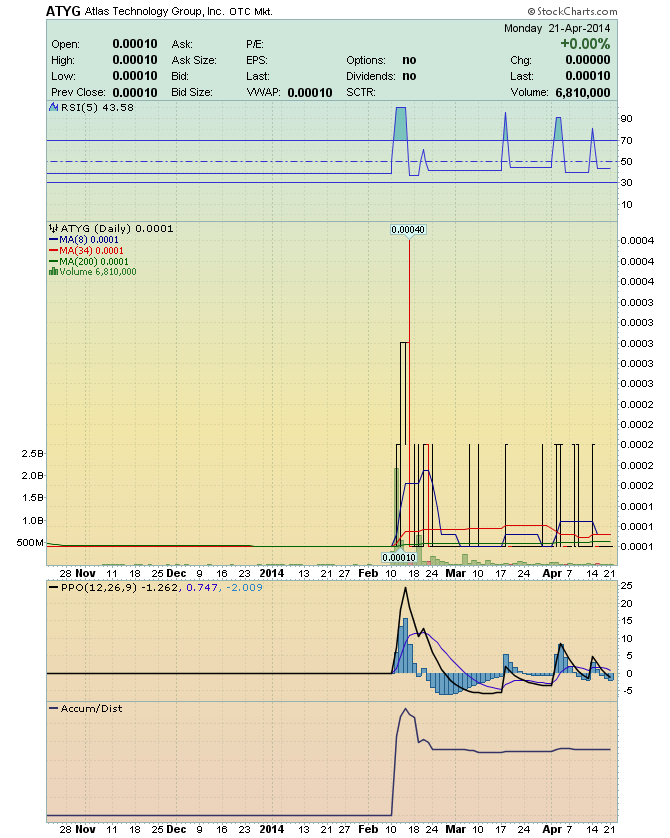
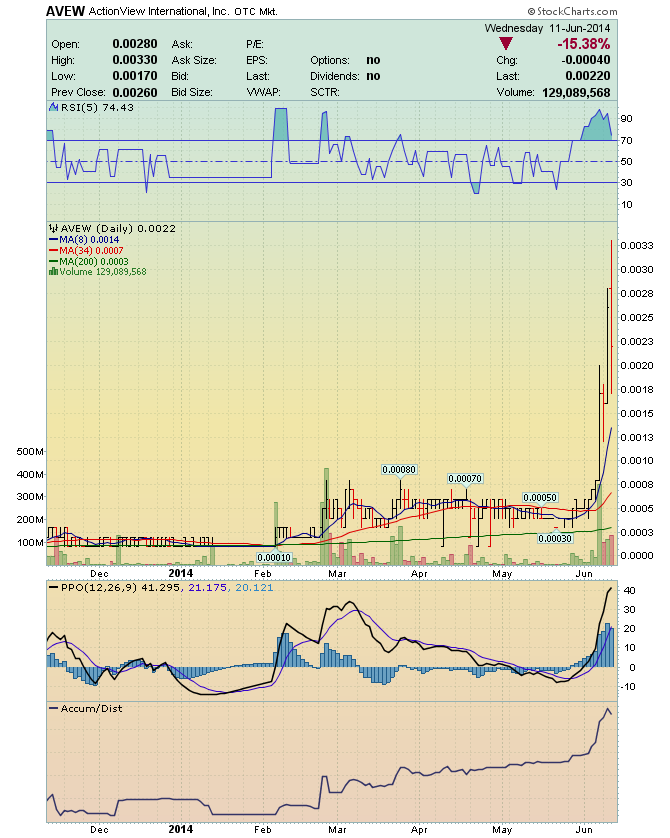
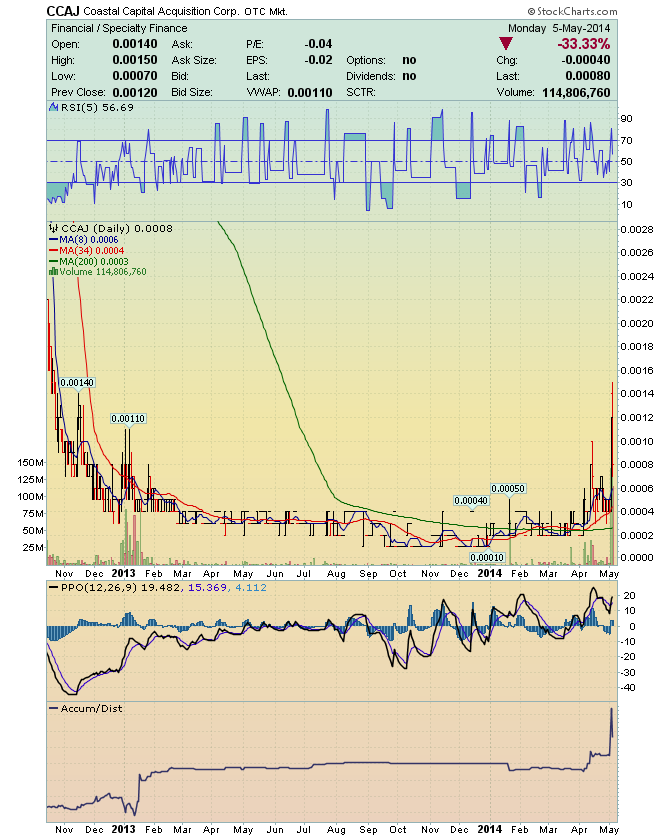
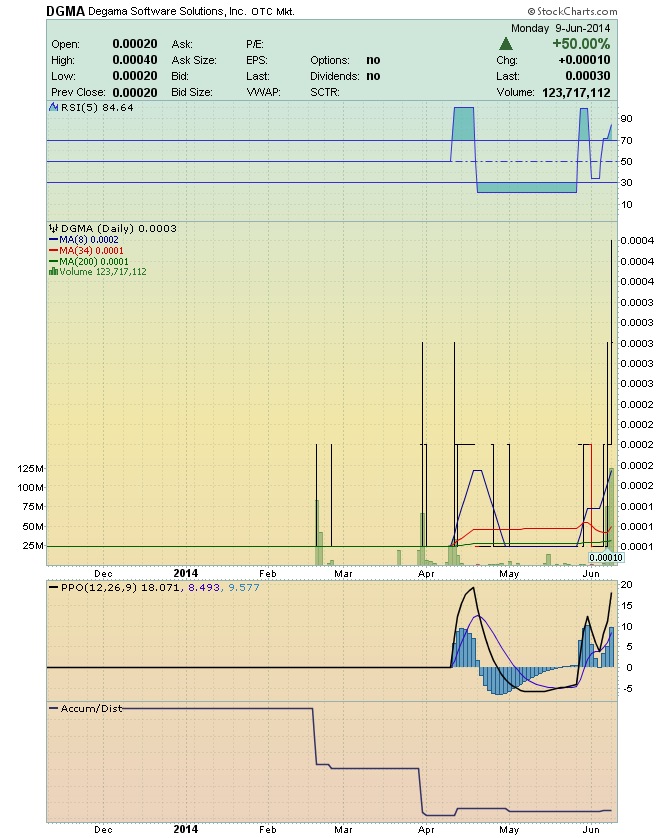
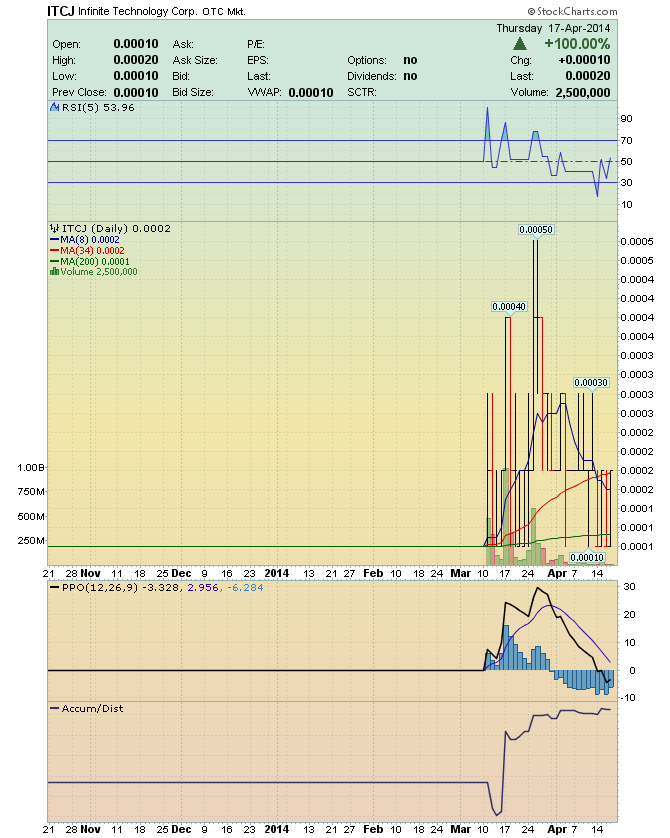
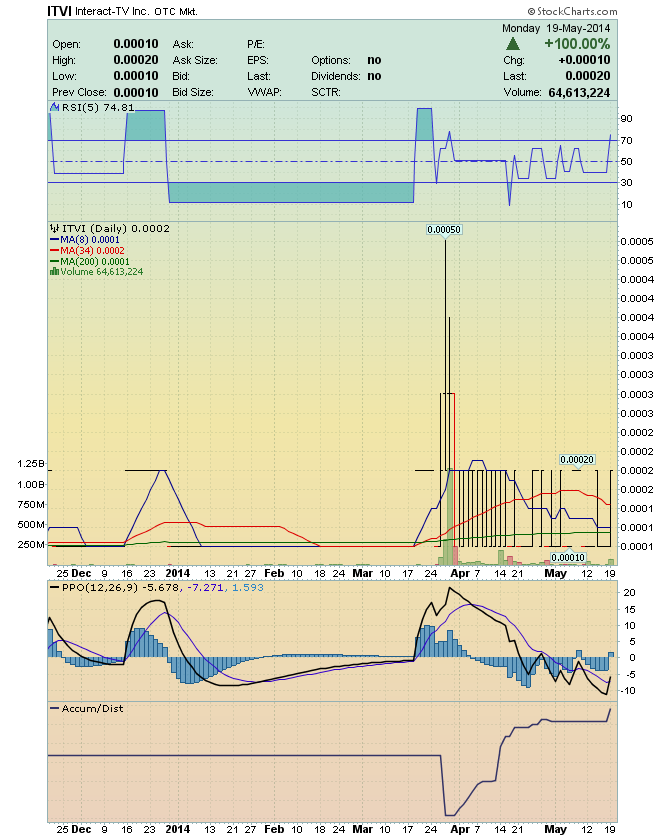
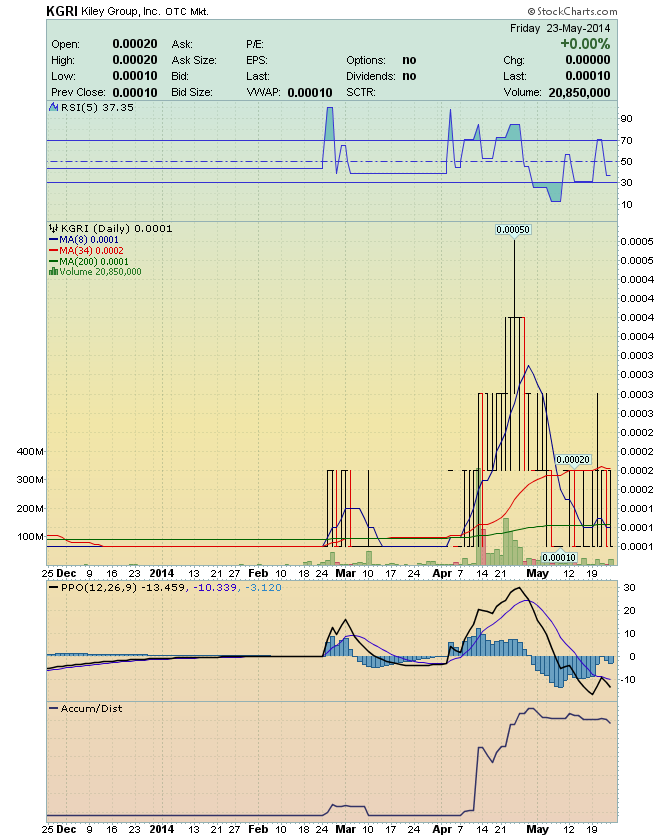
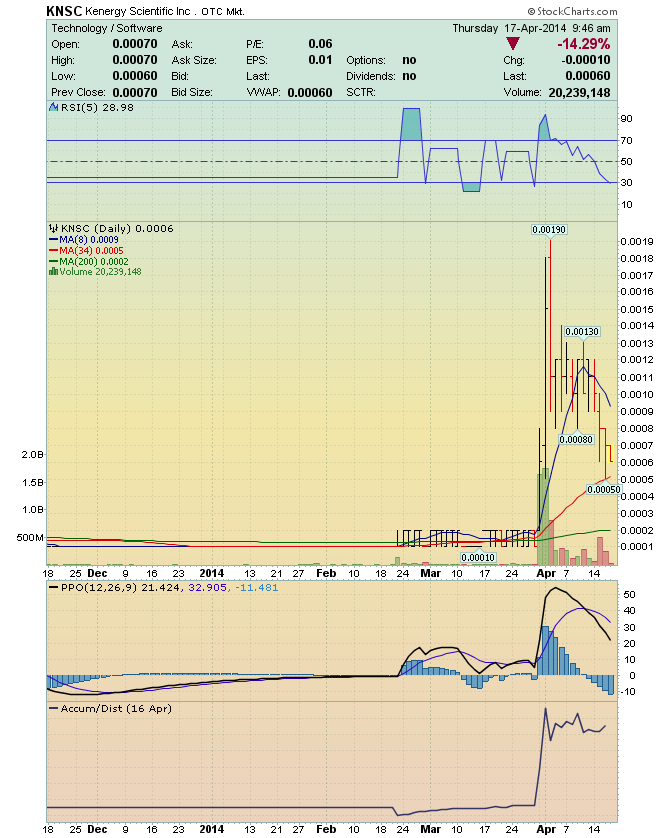
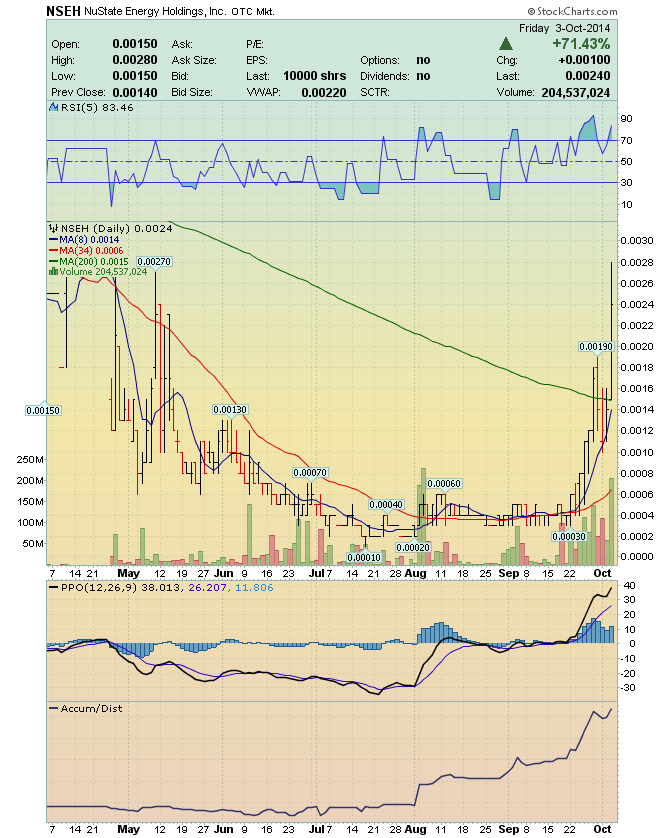
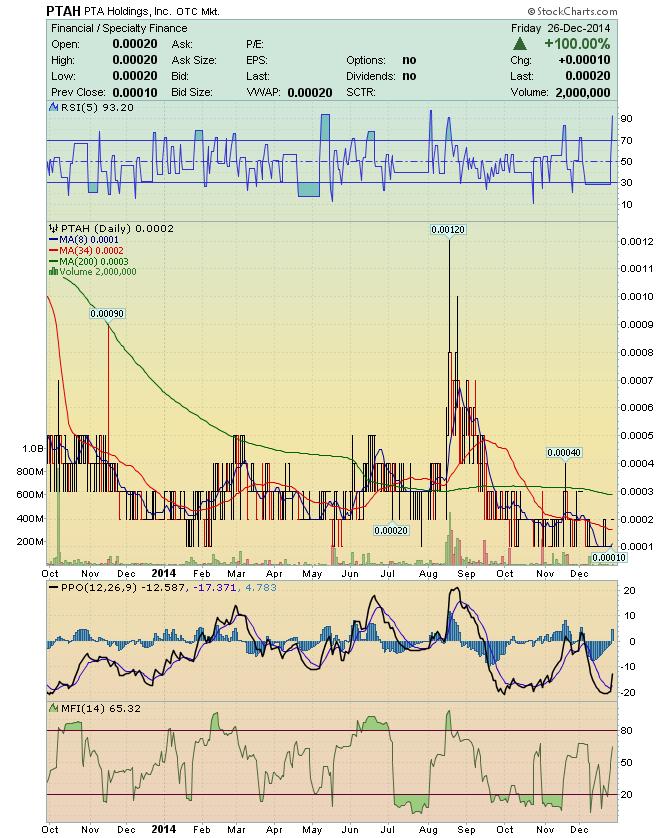
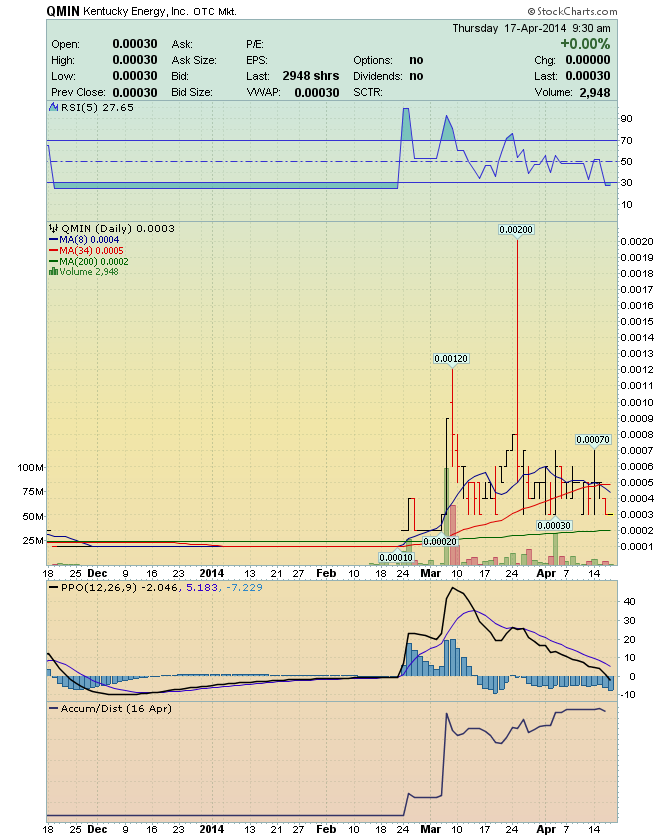
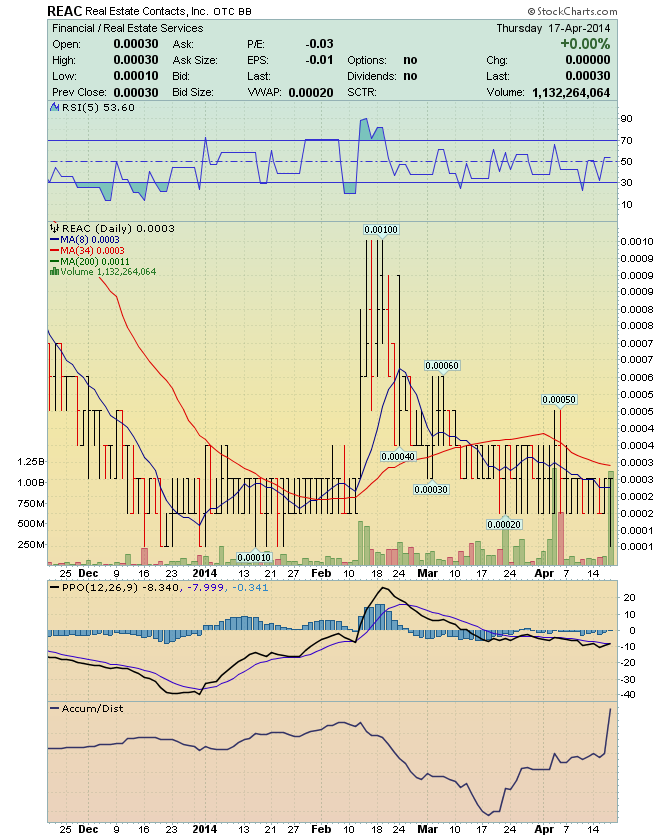
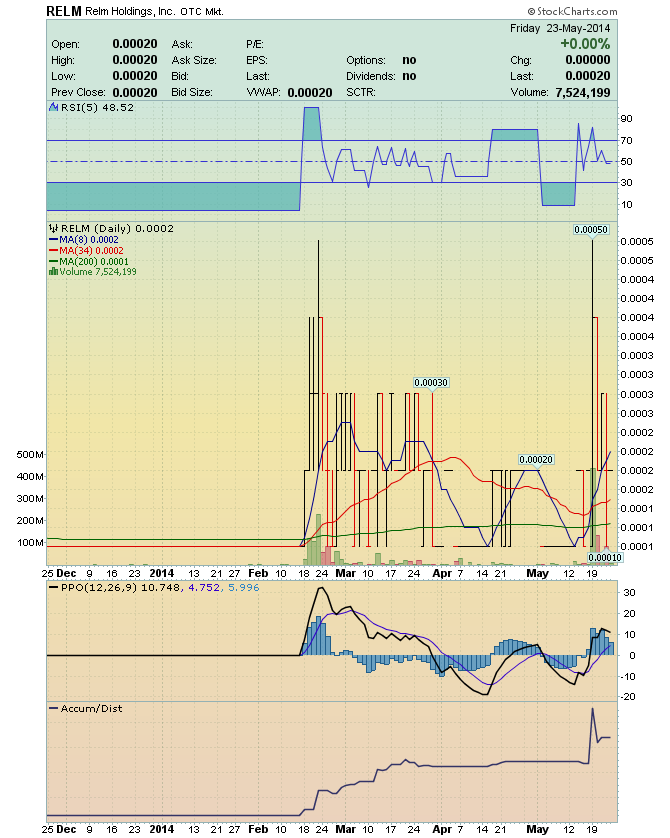
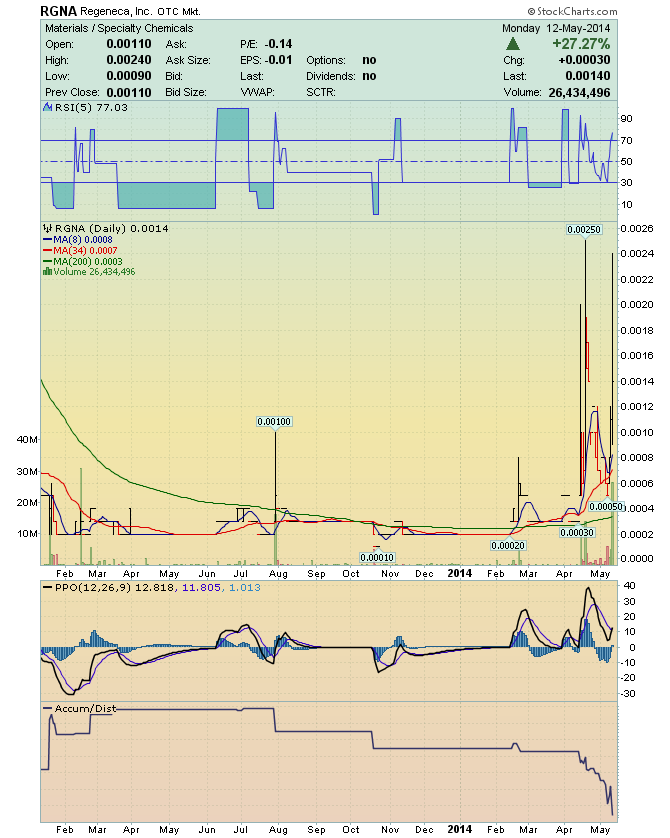
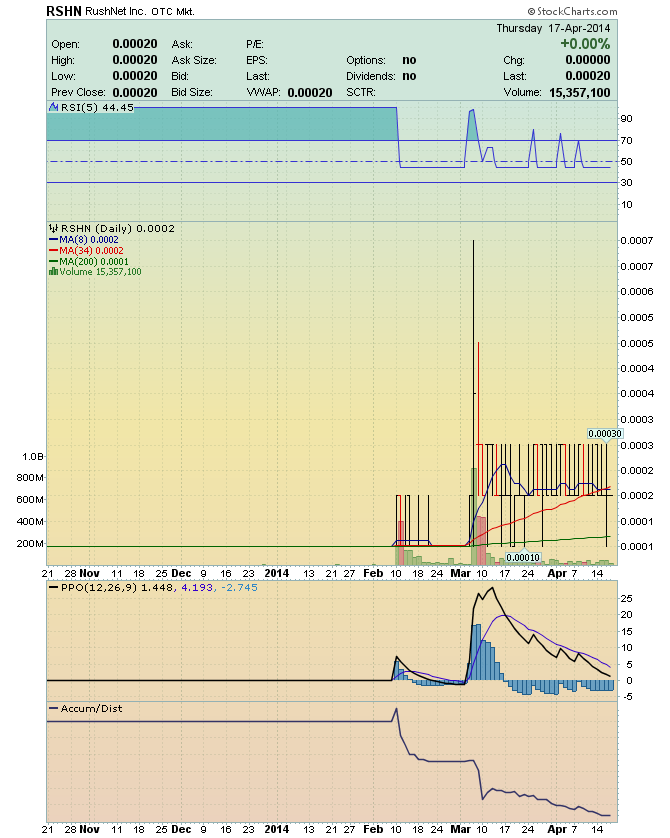
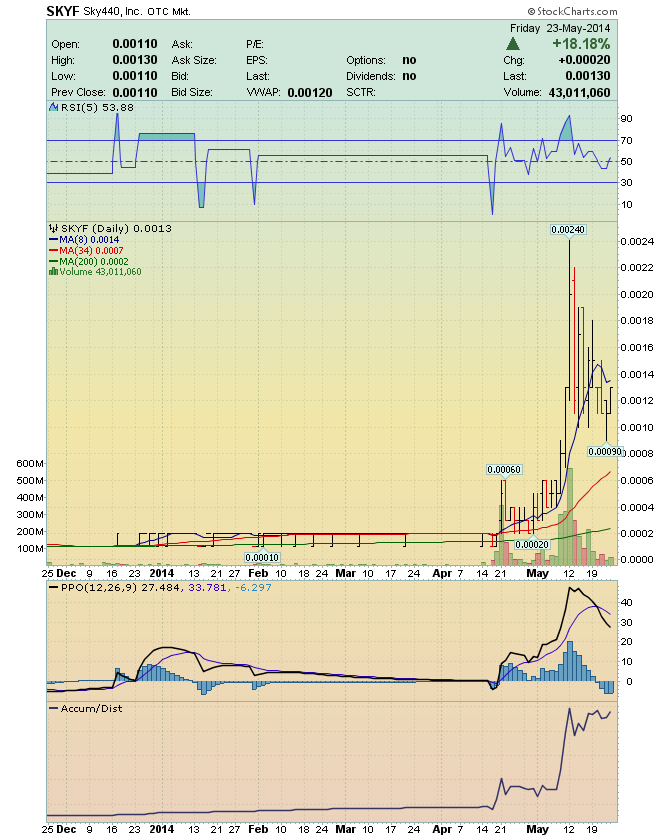
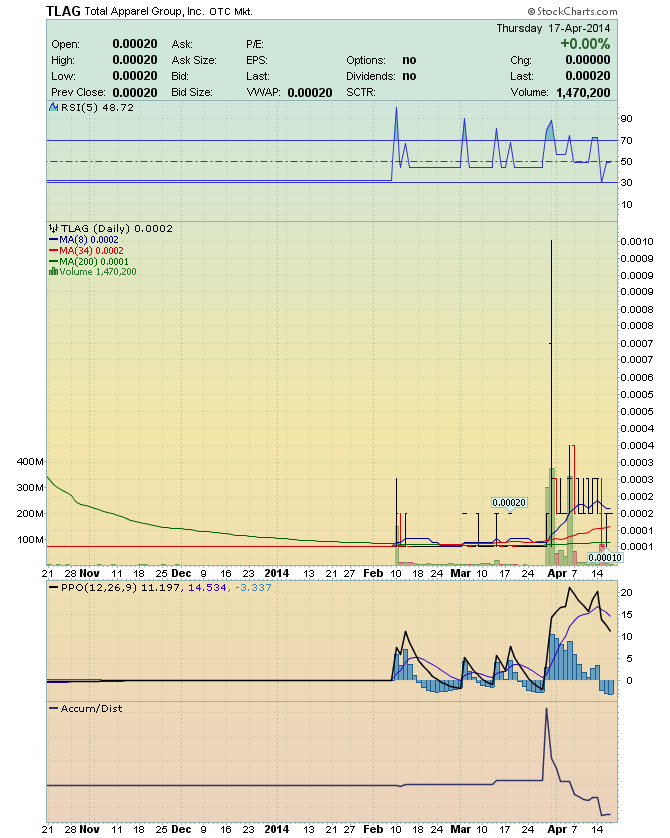
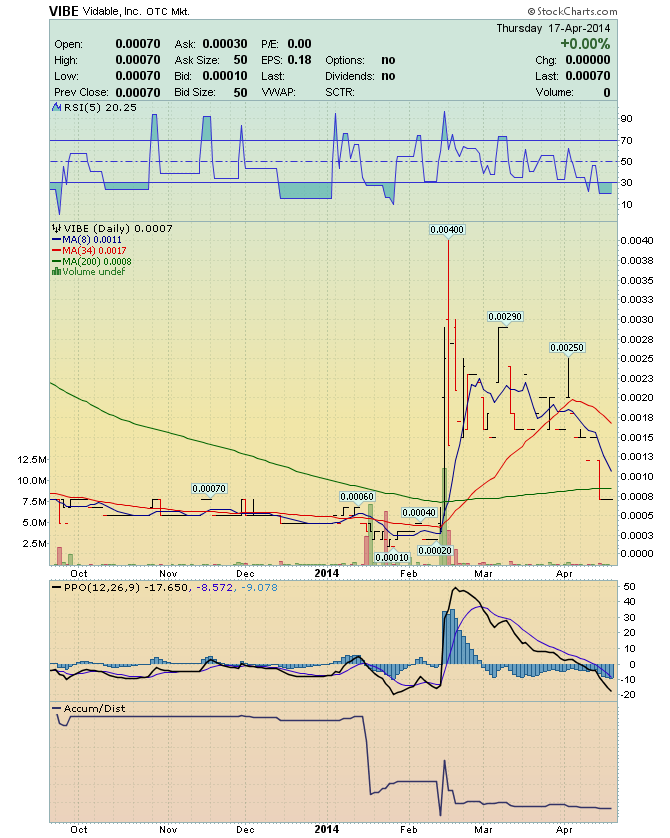
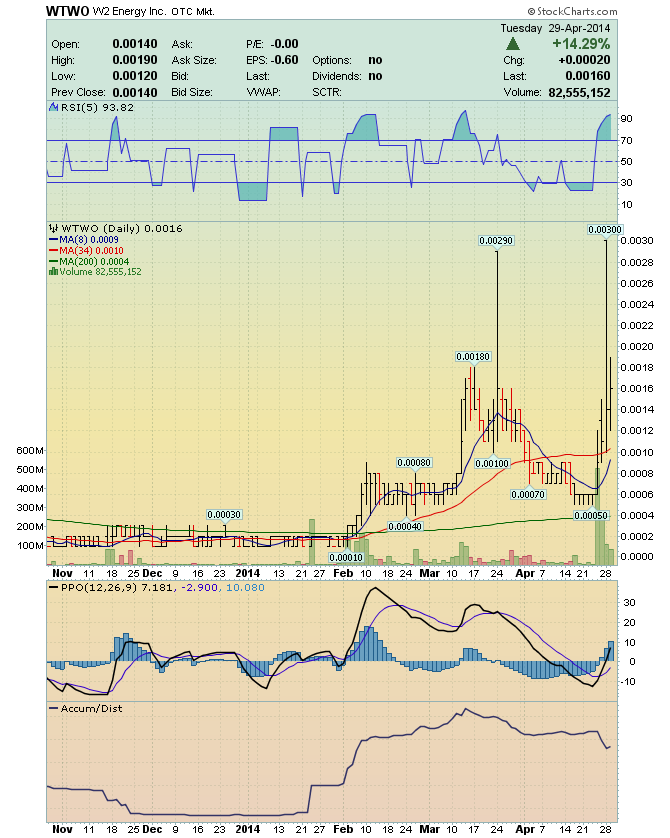
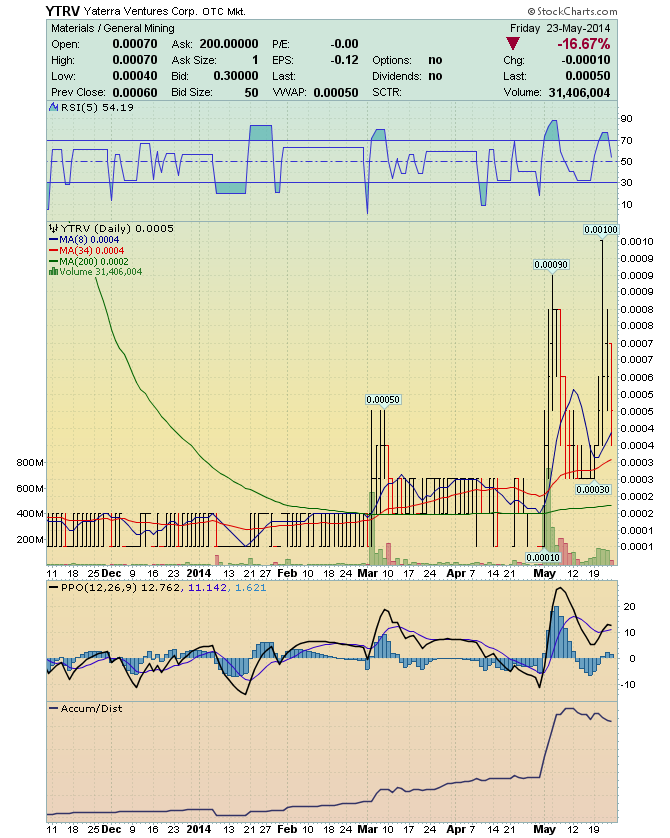
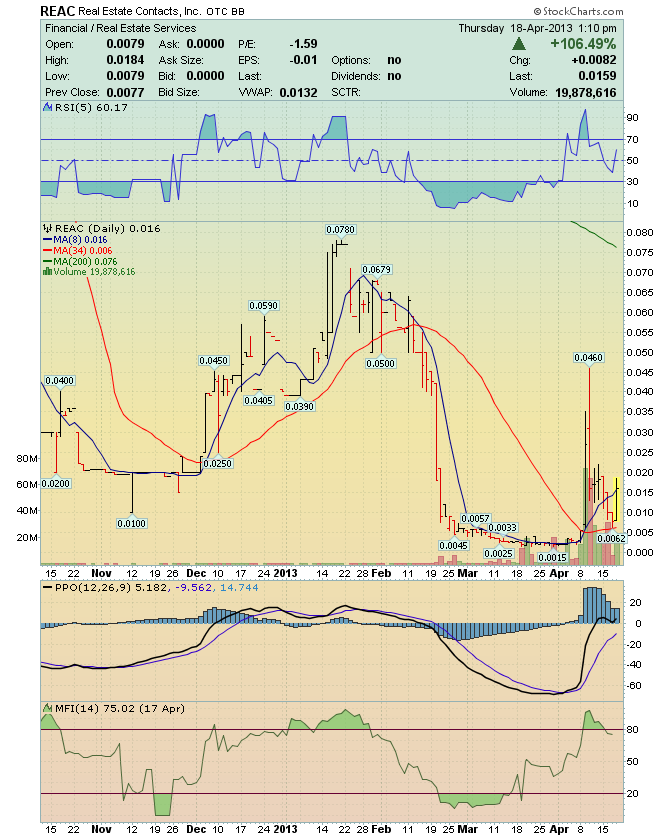
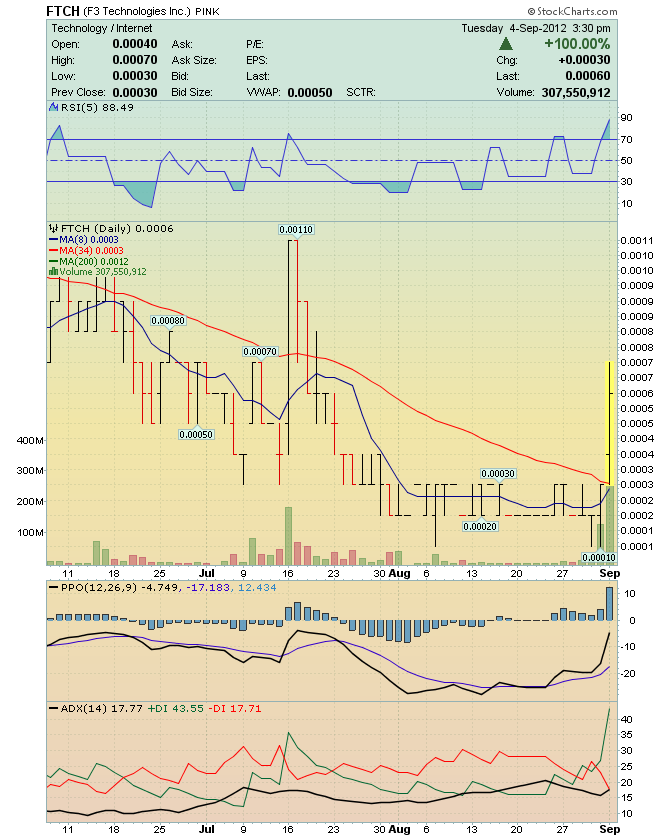
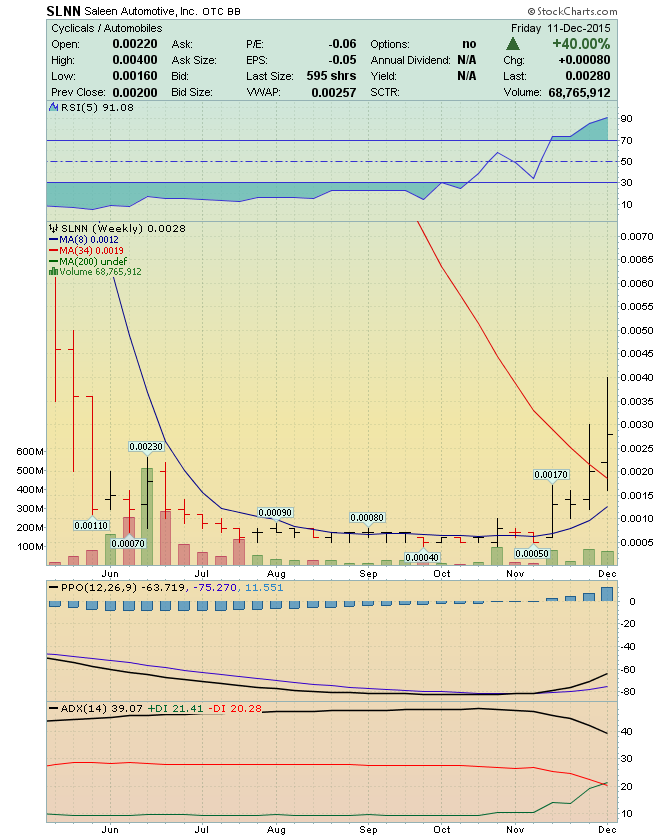
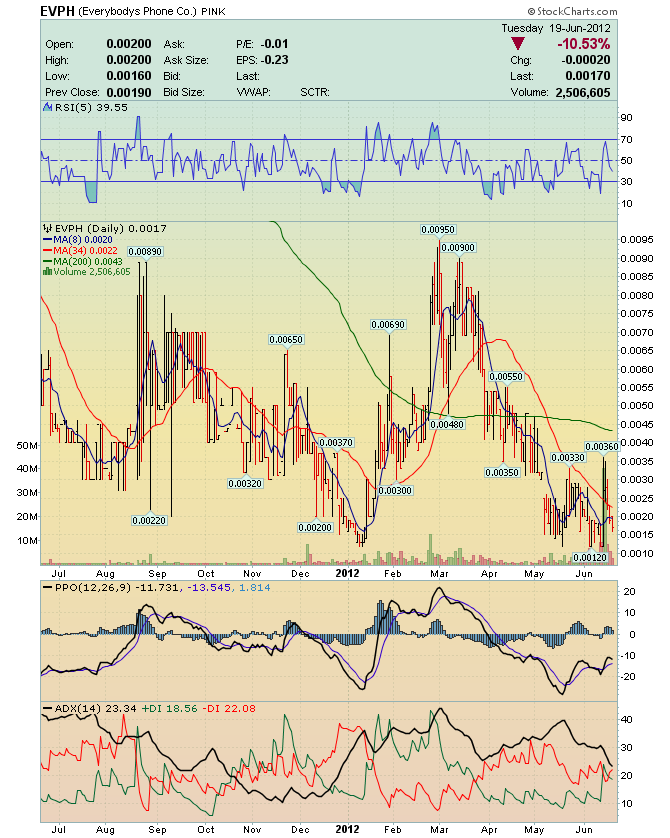
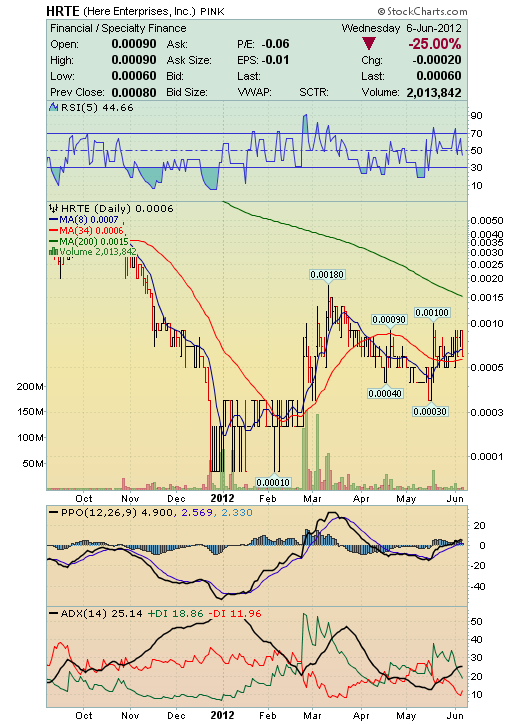
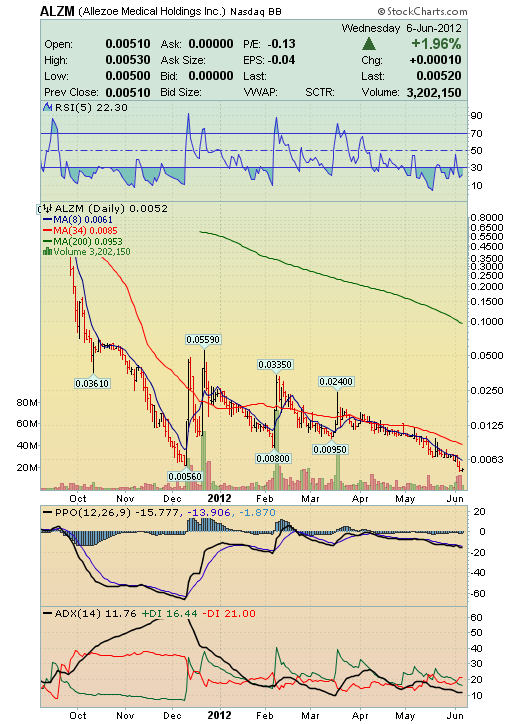
MARKET MAKER SIGNALS
Penny traders believe that Market Makers (MM)
will "signal" moves in advance buy using
small amounts of buys or sells as "signals".
The "signals" are such a small amount of shares
(worth no more than 5 or 10 dollars) that
no trader would have paid a commission that
costs more than the amount of shares bought.
The "signals" are from one MM to another.
100 - I need shares.
200 - I need shares badly, but do not take the stock down.
300 - Take the price down so I can load shares
400 - Keep trading it sideways.
500 - Gap the stock.
This gap can be either up or down,
depending on the direction of the 500 signal.
911 - Pending News

| Volume | |
| Day Range: | |
| Bid Price | |
| Ask Price | |
| Last Trade Time: |


