 News
News  Market Data
  Discover
Support: 888-992-3836
Copyright © 2023 InvestorsHub Inc.


Register for free to join our community of investors and share your ideas. You will also get access to streaming quotes, interactive charts, trades, portfolio, live options flow and more tools.
Rainman! Accumulation/Distribution indicator. Here's the lowdown (courtesy of stockcharts.com).
A guy named Chaikin derived a formula to calculate a value based on the location of the close, relative to the range for the period. We will call this value the "Close Location Value" or CLV. The CLV ranges from plus one to minus one with the center point at zero. The CLV is then *multiplied* by the day's volume on daily charts and the week's volume on weekly charts. (The exact formula is shown at the bottom.)
CONCLUSION: The Accum/Dist is working relatively well on daily charts but is creating a huge distortion on weekly charts. Why? Because if the market closes at the high, the entire week's volume is added to the Accum/Dist line. The indicator is working on daily charts because if there is a selloff mid-week, the daily selloff volume is substracted from the line.
So let's say there was a high volume selloff mid-week (which has happened) and then the market recovers, closing at the high (CLV=1). (CLV * Vol) means the entire week's volume is added to the line, and this is not an accurate representation of what is happening beneath the surface.
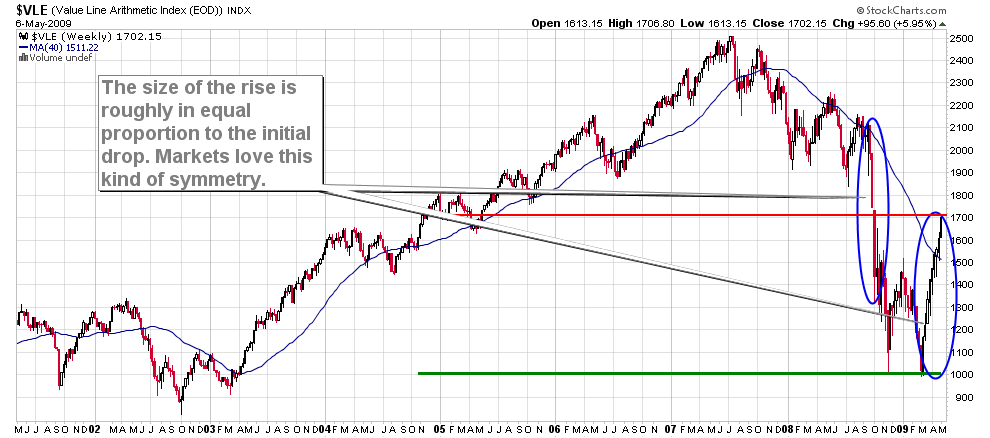
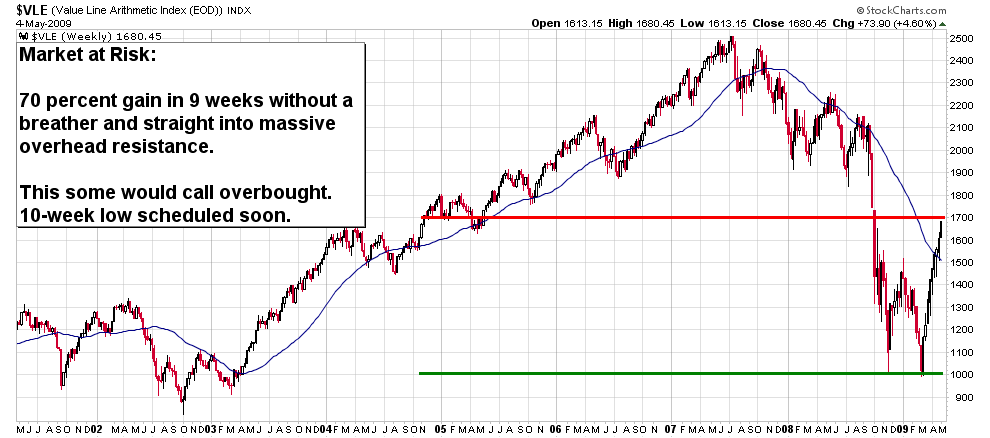
Also, the weekly volumes have been at historically extreme levels! Now this information may prove significant from the point of view of the future, but we don't know absolutely (meaning this may still be a long-term market top--the entire structure from mid-1996 to present). In general, we know that sustainable markets are built carefully, one steady, thoughtful move at a time. The move up from March 9 is far from steady or careful. It has been a mad rush to cover short positions and to get money back into stocks FAST. We know this based on the $VLE chart which shows that in the last 9 weeks we have moved up the same distance covered in 1 year beginning in March 2003. Now the 2003 rally was a huge one off deeply oversold conditions, but it was executed carefully, and that stable base led to a multi-year bull market. CONCLUSION: This latest rally was nothing more than a bear market rally.
The market is in a euphoric state (drunk on greed). Euphoria is a heartbeat away from sheer panic. Certain world events are dismissed by the market, and others move it. For example, the market wisely dismissed the swine flu thing (for now). The market will absolutely react if people stop going to malls or avoid airlines.
In general, we do not want to trade trying to guess when something is going to go wrong in the world. As a matter of sheer probabilities, the odds are against you about 100 to 1 (my rough estimate based on the last 5 years of watching the market daily).
Ted
==================================================
THE FORMULA:
C=close, L=low of day, and H=high of day:
[((C - L) - (H - C)) / (H - L) ] = CLV
This yields 5 possibilities:
1. If the stock closes on the high, the top of the range, then the value would be plus one.
2. If the stock closes above the midpoint of the high-low range, but below the high, then the value would be between zero and one.
3. If the stock closes exactly halfway between the high and the low, then the value would be zero.
4. If the stock closes below the midpoint of the high-low range, but above the low, then the value would be negative.
5. If the stock closes on the low, the absolute bottom of the range, then the value would be minus one.
The CLV is then *multiplied* by the corresponding period's volume, and the cumulative total forms the Accum/Dist Line.
Y2Kate: I have been testing my intuitions in a fairly scientific way over the last 5 years and have found they are not reliable signals. I *wish* I could report otherwise. On the other hand, what works well for me is the intuitive pull in one direction or another, which I then research and confirm.
We have to be careful when looking for market methods. Because the probabilities are essentially 50/50, it is really easy to think some method is working because it delivers the correct signal. I tested this recently on mysticalball.com, asking questions about the market. I asked 3 important, specific questions, and all turned out correct.
1. Will the swine flu pandemic blow over and be a nonevent as far as the market is concerned--at least in the near term? (Asked this question right after the news came out.) Mysticalball said, "My sources say yes."
2. Will the market climb above SPX 900? Mysticalball: Absolutely.
3. Will the FAZ trade be successful? (This was another one a couple weeks ago.) Mysticalball: Yes.
So the accuracy was 100 percent!
I asked the same questions the next day, and got the opposite answers, so it doesn't really work in my opinion. It simply creates a wonderful illusion. Many analysts create similar illusions with their work--even fooling themselves into thinking they know something!
Here's a good introduction to Hurst:
www.decisionpoint.com/TAcourse/Cycles1.html
www.decisionpoint.com/TAcourse/Cycles2.html
I'm still testing the value of these cycles. At times they can lead to confusion when the market diverges from the cyclical ideal. Hurst is not the easiest guy to understand (you know, one of those engineer-types) but he gave us a breakthrough comprehensive understanding of market behavior.
I'm counting August 2007 as the last 4.5-year cycle low, and March 9 as the last 80-week low. So the current cycle configuration--as I see it--is as follows:
4-year: UP
80-week: UP
40-week: UP
20-week: Just approaching the zenith, soon pointing DOWN
10-week: Bottoming, soon pointing UP
5-week: Bottoming, soon pointing UP
Ted
Updated Charts:
Based on the rather extreme positions the market is now in, I suspect the 10-week low (anticipated to complete by May 13) will morph into a the next 2.5-week cycle in a consolidation phase. I don't anticipate seeing anything lower that SPX 840 by the first week of June--based on the current bullish pattern. The essence of my method is to stay with the tune being played unless and until there is a clear signal to the contrary.
A move this vertical is rarely sustainable over the long haul, but I've learned to give up trying to predict *when* it will break. Instead, I will expect little more than a mild pullback over the next couple weeks--unless we get a more clear signal.
Land, I am, but you were right that I was too early. In the last couple years, this is a market that loves to gap up or gap down in the morning. So I've learned--perhaps incorrectly--to build positions early to capture the move. However, the strategy works when there are other compelling reasons to justify it. In this case, the strategy was to build the position in 1/5's with the intent of holding no more than 30 percent in the trade. I'm now at 4/5's with an average of $6.49.
I'm sorry I mentioned FAZ at all. I'm making a new commitment not to trade this kind of vehicle except under the exceptional conditions. This is not one of them in my opinion. There is a reasonable probability I will exit with a small gain. It wasn't worth the trip, though. There is a far better way to trade.
My commitment is to lay out that strategy and to model it.
Ted
I'm not familiar with the Accum/Dist indicator but the charts in the last 3 posts certainly demonstrate a very unusual situation! This has not been seen in years!
Would you mind explaining this indicator and why it is so far above the MA?
Also, would you elaborate on your comment about "one thing of any significance went wrong in the world"?
So you adding to your FAZ position??
Question--I've never heard of the Hurst cycles. Where are we now in that cycle?
I also appreciate your respect for the intuitive prompts, synchronicities, and other
'soft' indicators...at the risk of sounding nutty, I sometimes have dreams about the market that prove to be correct...or, I'll see or hear something that feels like a sign. I've learned to ignore these missives at my own risk!
Thank you so much, wonderful post, I will return to it often. I appreciate the time and care you took in formulating these rules!
MrNat. and All: The reason for the extreme reading on this indicator (and a few others such as the ChiOsc) is that it includes volume in the calculation. If you look at the volume levels at the bottom of the chart, they are completely out of proportion with historical readings.
I have seen one study that shows extreme volume readings are associated with long-term market tops. We will have to see what happens in this case.
Ted
A broken indicator? Chart updated after the close--a 20-year chart. Not sure what it means. Don't assume it means crash. It may or may not. A pullback and consolidation would seem in order. If one thing of any significance went wrong in the world, it would suggest a rather violent decline.
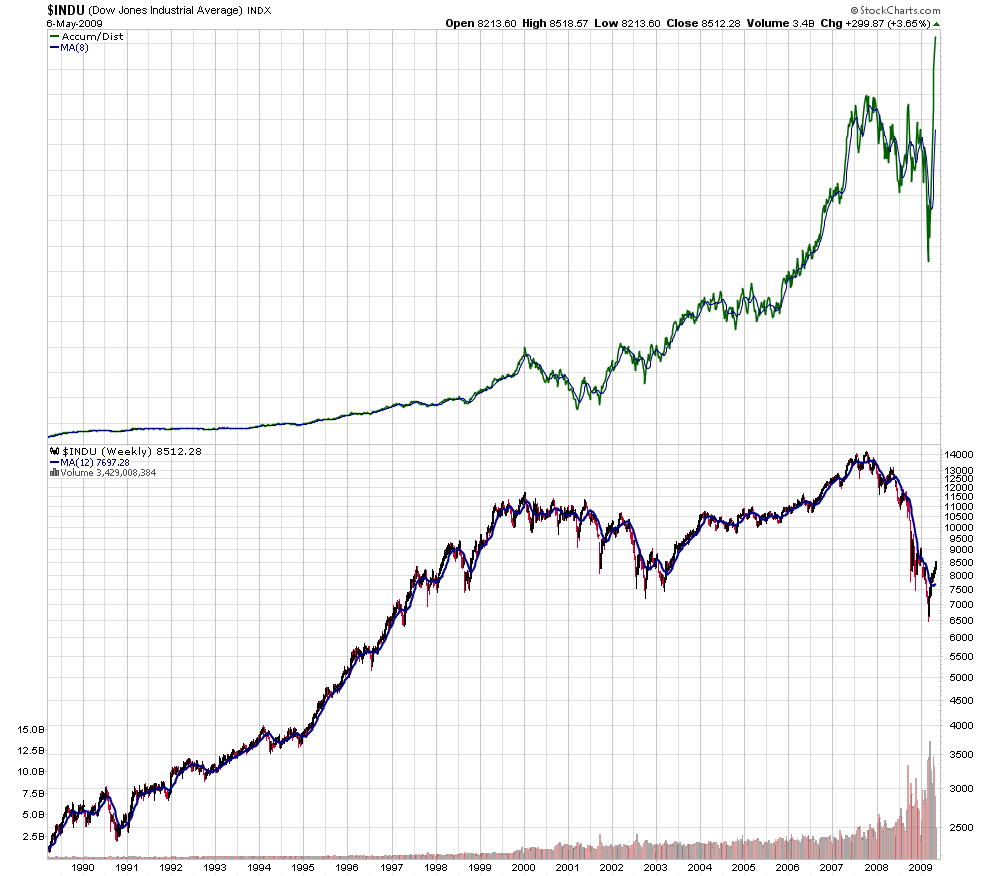
The $INDU chart is even more intriguing. Chart shows last 6 years. Notice resistance around the 8500 level.

Chart courtesy of StockCharts.com
Notice anything?
The following 6-year chart does not reflect today's action concerning Accumulation/Distribution. The chart does show current price.
Regarding the 10-week low, my hunch is the market drops to no lower than the SPX 840 before wiggling sideways out and around these channel lines. Then I anticipate another push toward SPX 1000 before rolling down into the 20-week low in mid-July. This is all speculative based on the seed pattern I'm seeing now. This is a fascinating moment in market history.
Let's see where we are by Tuesday.
How to Find Winning Trades/Investments:
The focus of this board is on trading and investing as a managed business. Everything I report here will also apply to penny stocks and high-flying volatile stocks. However, what I want to encourage is conservative, consistent trades and investments because 80+ percent per year is possible with peace of mind. This frames my answer to you.
There are ways to perform automated searches for exactly what you're asking on stockcharts.com. At some point, I will publish some code you can just plug in. Honestly, though, this is a low priority.
Here are a few rules that will align your work with the winning forces of civilization and will put you above the Wall Street noise and beyond fears of manipulations, tricks, and traps.
1. Seek prices that represent the broad, deep, winning forces of civilization. Part of that search may include the popular, what is currently hot, but in the end, reliable is better than hot. Speaking of hot, what's cool is my methods work with the most volatile high flyers. But high flyers will be much more exposed to manipulations, tricks, and traps. That includes FAZ--a dangerous vehicle that I probably shouldn't have mentioned. There is simply no need whatsoever for that kind of power--except under the most exceptional circumstances when a buy might be warranted. NOTE: The higher the return potential, the higher the risk, and over time and the course of 100+ trades, high risk will take you down.
2. Collect stocks and ETFs like gems until you have a stable of perhaps 12 that fit the above description. Would love to have several people working to build this collection. Stocks aligned with the deepest, broadest cutting edge of civilization now, that stand in the way (Buffet's mindset) of an unending river of money. We want to own what is bigger than this season and more powerful than Wall Street and the government. Investors Business Daily is one of the best sources of information going. An amazing publication.
3. Watch the Hurst cycles (the best in my opinion even though they are sometimes difficult to discern), and trade and invest primarily off major cycle lows. This will increase the probabilities and the percentage returns. Buy high probability and low risk. Exit low probability, high risk. (Would love to have some regular Hurst analysts publishing regularly.)
4. Learn to recognize basing prices. This will minimize false starts. Will be publishing charts showing basing patterns. Then focus only on buying these bases.
5. Consistently follow your 12 stocks or ETFs, and know everything about them. Then compete your 12 against the universe of opportunities. If you find a vehicle better than one of your 12, dump your weaker opportunity and replace it with the stronger. Always align with breadth, depth, and strength. There are ways to put numbers to these words. (Would love to have a contributing writer who understands the importance of fundamentals and how to apply them.) Fundamentals will add to the accuracy and consistency of your stats. So we want to find the vitality of civilization in the numbers (the fundamentals) and add it to the life force of price (the technicals) as measured by the moving averages (price above up-sloping lines). Will be publishing some fundamental rules of thumb if someone doesn't beat me to it.
6. Trade and invest with the market (you want the wind at your back). This is essentially the same thing as points 3 and 4 above. Why? Because most stocks follow the market, and most will base with the market, and the market will often dip and base at major Hurst cycle lows. [Take a simple chart with 10 and 20-day ma's only, and start plugging in stocks. See how many are similar to LNN or the market coming off the March 9 low. Look for similarities and differences. Notice which were the best and strongest. Then look for the best and strongest for future trades.] The point is this: The *real* entry points (high probability, low risk, high return) will only show up a few times a year (every 10 or 20 weeks). So there is no need to chase the next stock that's crossing up--unless you like stress and chasing and risks (that's a personal choice). So I'm encouraging following just 12 or so opportunities throughout the year and trading or investing as they present great opportunities. In this way, your percentages will soar. You will make fewer mistakes, and you won't be swimming upstream trying to recover from losses. You will enjoy high returns with less effort. Let's enjoy life!
7. Know and visualize the kinds of vehicles you would like to trade and own, and then be open concerning how that information comes to you. It will come in amazing ways--and often through the most unlikely sources. Watch for a glow around the company or sector. It will almost feel like it's talking to you. Pay attention to these signals, do the research and verify your instincts. I experienced just this with KOPN back in 1999 when it was $15 a share--just before it launched to $200. KOPN came to me while attending a meeting having nothing to do with investing. A guy I barely knew (who did not know of my interest in the market) said, "Ted, I don't know why but I just feel compelled to share this with you. I don't normally offer stock tips, but this seems important." Strange but true. That's where my investing career began.
Ted
Y2Kate: CREE and TXT. Both look like possibles based on ma's--know nothing about their fundamentals. CREE looks especially strong being above the 200, 50, and 20-day.
I'm expecting a move down into the 10-day low over the next few days. Let's give the market a chance to settle and then see if your stocks are still looking good.
Also, we are perhaps coming into a more difficult period of the market. We have major overhead resistance. Did you see my chart of the $VLE? Up 70 percent in 9 weeks and it's 350 points above the 50-day ma. It would seem a little consolidation is in order.
I'm anticipating a 20-week low in July, and that will likely provide a better entry point.
Not discouraging trading. Just want to have realistic expectations given the mess the market is recovering from. So buy when the signal is there, watch your stops, and collect profits soon and often until we get into a market that promises smooth sailing.
Ted
And the Big Tease continues. Last night, the futures were red, and herein lies the stress factor for traders who try to read the mind of God and Wall Street and make "smart" (read dumb) moves based on technicals. It's just too hard.
If instead you align with the life forces of the winning prices that best represent the wide, deep progressive forces of civilization, you will stand invincible. You will be above and beyond the manipulations and the tricks and the traps.
What do I mean align with the life forces of winning prices? I mean buy those assets where the price is on the upper side of a moving average (turning up or up-sloping) to which you are committed as a trader/investor--whether it's the 20-day ma or the 200-day ma.
What do I mean by the wide, deep progressive forces of civilization? I mean those stocks or indices which represent companies or industries that are big or will almost certainly become bigger. Put together all the clues that would tell you this is a winning force, this is bigger than any government, this is history unfolding, this represents a tidal wave of money over the next 20 years, and it's unstoppable. None of this is perfectly knowable but there are clues. I will repeat and clarify some of this in my reply to Y2Kate.
Ted
OT: Just a note about "smarty" traders. Don't mean to put anyone down. I wrote that in reference to myself, and it's a bad habit--making gutsy, fast technical trades. I will continue to make short-term technical trades where I see a high-probability opportunity. The thing is this: I can earn more far easier and with better physical health by finding the flow of the market.
The far better way to trade and invest is to surrender to the life of the market--and that means owning positions that are above the jugular vein, the 20-day ma, when it is up-sloping. As a long-term investor, it might mean owning positions that are above the 50-day ma or the 200-day.
The market is holographic, and what is true of the 20-day ma is true of the 200-day ma.
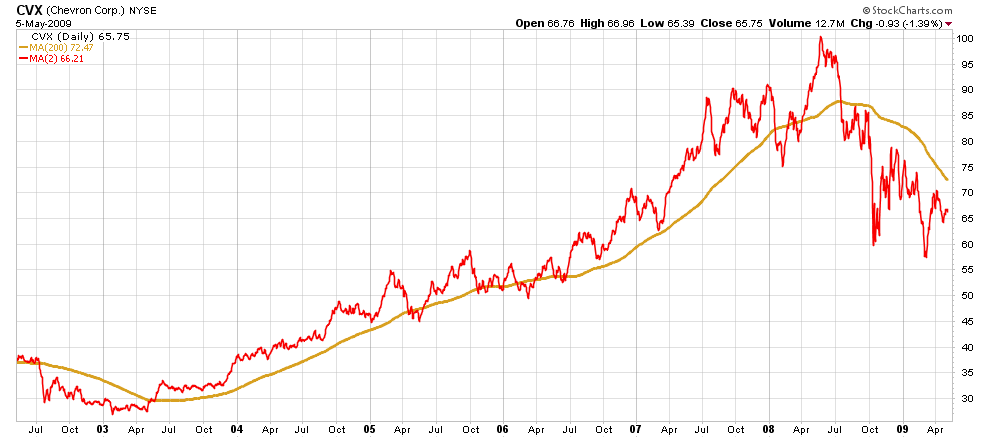
CVX is a good demonstration of the 200-day model. The following chart doesn't have candlesticks or volume or stochastics--not even an MACD. We can't tell the fundamentals, but one thing is certain. The wave in the following chart is bigger than anyone. Wall Street can influence what happens and the Government can make decisions that will crater the market. But rarely does that happen overnight (maybe tonight based on the futures), but in general, here's a pattern you can bank on. I love this chart.
It was a beauty until it caught the flu in early 2008, and then you can just see its death coming in the summer of 2008. I watched it one day at a time, held on until the last minute to a position purchased in 2003, giving the stock and the market every chance to recover. Sold at $86 a share.
Welcome y2kate! I may respond late tonight but more likely tomorrow.
I love writing about this stuff but will let it flow out naturally in its own time.
There is so much more to say! What I'm putting together is a complete "holistic" strategy. Every detail will be included in the final product. So whenever I post something, just assume it's a work in progress, and each piece will add to the next. If I ever feel like I'm there--this is the whole kit and kaboodle--I will label it as such.
Thanks for writing and I look forward to the dialog.
Ted
Thanks, MrN.! (EOM)
P.T. I was responding to this part of your message (post #102)
"sell your position if price climbs 10 to 20 percent above the 20-day ma line (depending on the volatility of the trade vehicle),"
I only wanted to point out the bands can give a trader a visual method to see when a stock has moved 10% or 20% from the mean in this case the 20 MA. Depending on volatility any MA can be used as the mean for the envelope.
FWIW I rarely use the envelopes myself.
thank you. question-- how does one find stocks that are poised to cross?
Again, thank you so much, this is an incredibly useful post. I can't wait to try it.
What do you think of this one:
http://stockcharts.com/h-sc/ui?s=CREE&p=D&yr=0&mn=3&dy=0&id=p02478811391
Here's the same stock, using 3/8 dma--would have triggered
a buy more quickly:
http://stockcharts.com/h-sc/ui?s=CREE&p=D&yr=0&mn=3&dy=0&id=p12901837825
One more that looks ready:
http://stockcharts.com/h-sc/ui?s=TXT&p=D&yr=0&mn=3&dy=0&id=p36881363622
I appreciate your feedback, thanks!
Kate
As we go along, I will add moving averages to the method illustrated above, and then I will illustrate patterns offering a range of trading opportunities:
Good
Better
Great
Outstanding
Then instead of trying to read God's mind (or Wall Street's), you can simply watch for these patterns--which show up throughout the year.
Pretending we can read the market when our stats reveal we are throwing dice is a waste of effort, cash, and opportunity.
Now here's the amazing part. When I put the whole method together and use it to read the market, I can with a high degree of accuracy. Greater accuracy than I have seen with most methods. But I'm not reading God's mind or Wall Street's mind. I'm reading the particular configuration of moving averages.
And why can't this method be manipulated easily? Because it takes time and lots of money to turn a moving average. And by the time it's turning, I already have a good clue as to what the signal means--at least right now. And the only place I can make or lose money is right now. So I want a method that tells me what to BUY, HOLD, or SELL right now.
Ted
MrN. - Does this add to my decision-making ability? To my trading accuracy? To achieving consistent returns when looking at 100 different stocks and trades?
The beauty of the moving-average method outlined is it delivers everything I want as a trader:
* Opportunity.
* Consistent profits.
* Objective basis for trading/investing.
* Excellent criteria for aborting the trade.
* Pays off a high-percent of the time--especially when I have a trained eye for recognizing bases. I will be posting a few variations of ideal trading setups.
I don't want to add a single detail that does not deliver a clear and measurable benefit in my decision-making. I use other indicators, but am increasingly selective.
There's an important reason that has to do with how the brain works when making decisions. Too much data--especially iffy data--leads to trading errors. Even too much effective information can blind us to the clearest signal that works.
Will explain more as we go along.
Thanks for posting this.
Ted
PS
When I tried the envelope on other stocks such as SPY, I personally found it blinding rather than enlightening.
PT, you could add an MA envelope set at 10% and 20% for a visual on the deviation.
The (Chart-Illustrated!) Moving Average (Low or No Indicator) Trading Method Using Daily Charts
=============================================
The following illustrates an extremely simple trading method where you can filter out most of the market noise, opinion, bias, fear, manipulation, whatever stops you from earning consistent income.
The advantage of this method is you don't have to overwork the brain trying to calculate the infinite impossible odds of one iffy indicator plus another iffy indicator plus another iffy indicator. When the brain is at rest and it has a model that simply works, it makes better decisions.
I believe that if you will focus on just this model (fine-tuning where it suits you), you will outperform not only the market but all the fast-action, "smarty" short-term traders. Why? Because you will have an amazing accuracy with peace of mind, and you will capitalize on more of the move--even while knowing so much less than all the "experts."
=============================================
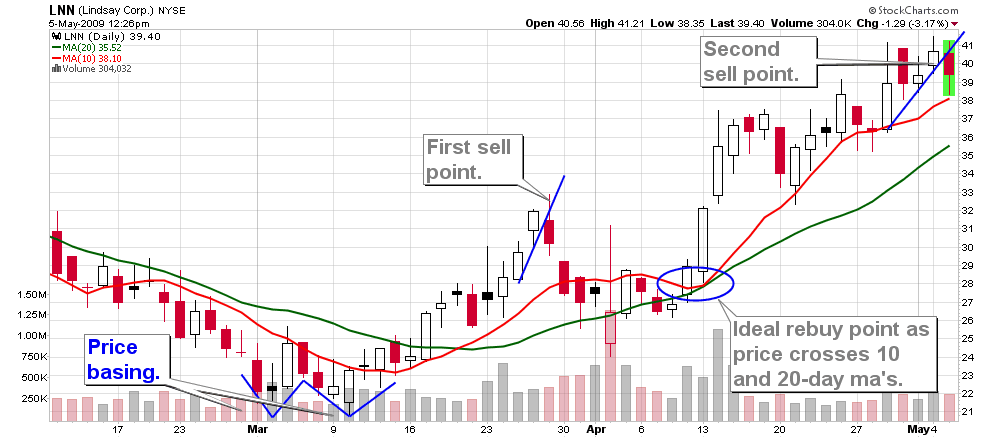
1. Pick a moving average that fits with your personality and trading/investing horizon--10, 20, 50, 200-day ma. For this post, I will focus on the 10-day and 20-day ma combination, and I will use a stock (LNN) as the trading vehicle.
2. Buy when price climbs above the 10-day ma (red) and the 20-day ma is flattening and likely to turn up or is already pointing up. Buy as close as possible where price crosses up. (NOTE: I trust price crossing ma's much more than I trust ma's crossing ma's as signals. The price cross is much closer to realtime--not after the fact.)
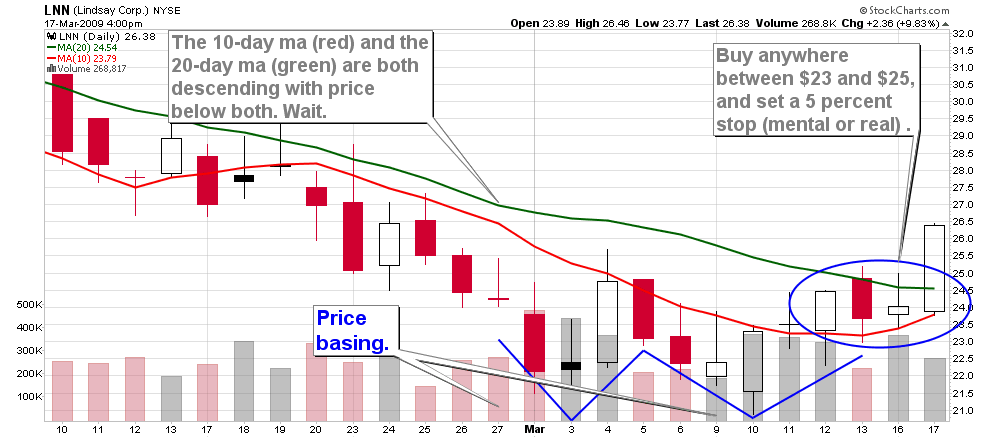
3. Sell if price falls below your entry point by [> 5 percent] and especially if price falls below a flattening ma and heads down.
Note: Quick, small breaks of the ma when the ma is pointing steeply up are likely headfakes or overshoots, and price is likely to trend higher. Also the numbers in brackets are variable and an area for continuous improvement. So try 2 percent to 7 percent and see what works best.
4. If you are an easygoing investor as opposed to a trader, let the trade ride until the 20-day ma begins to flatten and roll down and price crosses below the 20-day. As a trader wanting to capture quick profits, sell your position if price climbs 10 to 20 percent above the 20-day ma line (depending on the volatility of the trade vehicle), and draw a line along the base of the candlesticks as illustrated. Sell on a break of the hand-drawn line. This strategy maximizes profits. Then rebuy on the dips as long as the ma is clearly pointing higher and price is above the ma.
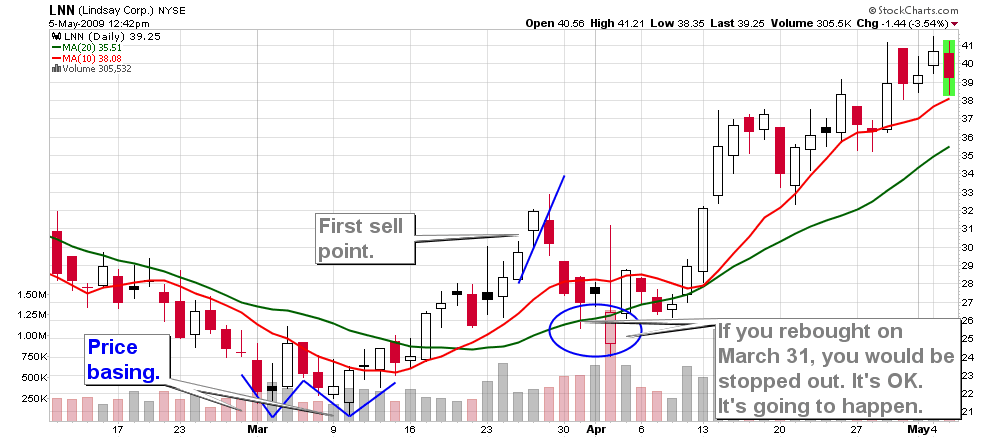
In this scenario, the first buy paid approximately 29 percent and the second, 42 percent, for a total of 71 percent in 8 weeks--not figuring any compounding. Obviously, this was an ideal setup, and in the real world, you will work for weeks and months to catch another ride like this. The main point is this: Follow these rules, and it is nearly impossible to lose. The only thing not anticipated here is an overnight gapdown because of bad news.
All 3 ma's must cross and its nice to have confirmation with slope and aroon oscillator as well.
MrN
Another ? lol
Which MA crossover?
TIA
Yes, I will close long position and start a 25% short position then go 100% short on the MA crossover. (need a candle close below the pivot)
MrN
Is the daily pivot your sell signal?
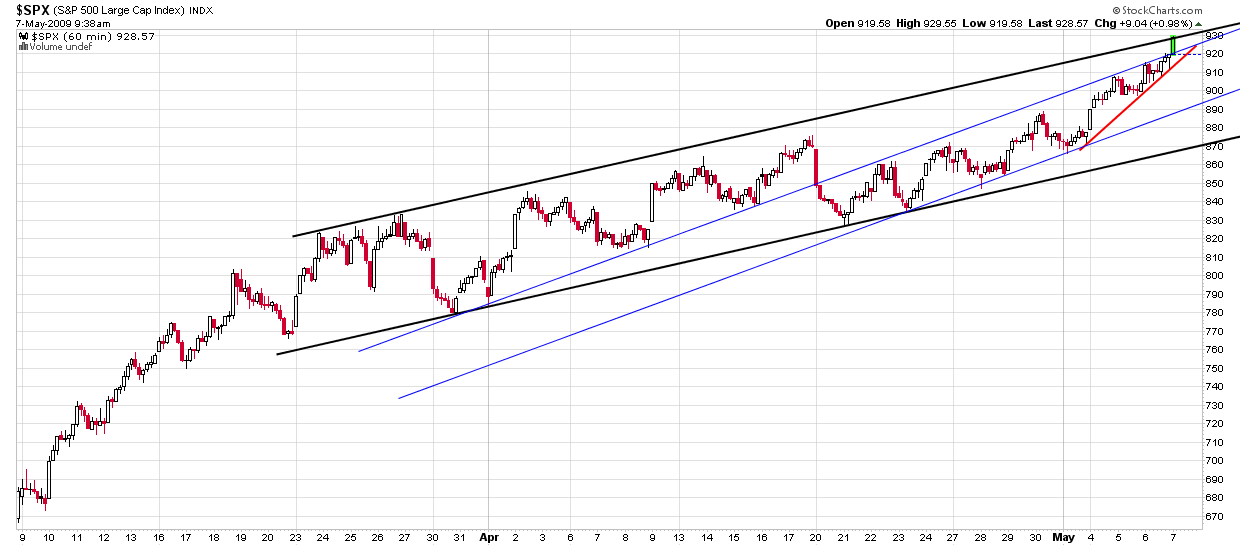
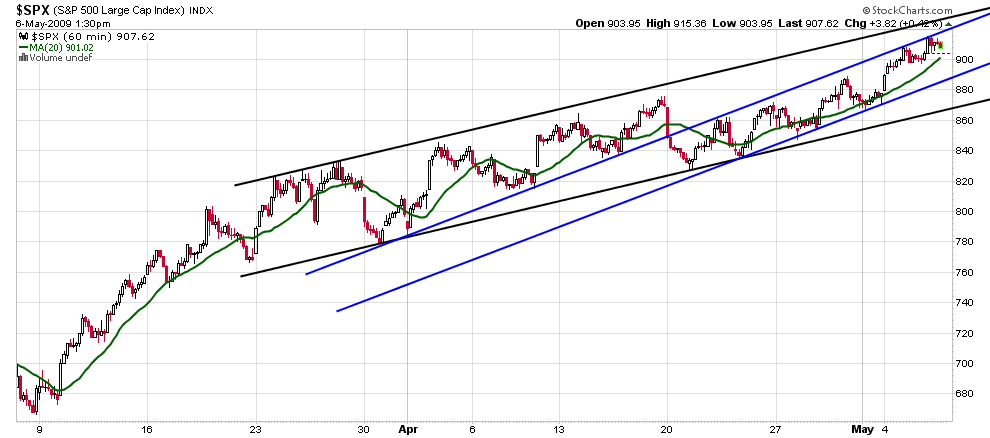
Spx 60 min. no sell signal yet, but I suspect we'll get it before the EOD.
Not looking for a crash here--just a breather into 10-week cycle low. This summer either the market will decline substantially into the 20-week low (ending 10 or 11 weeks from today)--or it will go into a boring up-and-down consolidation mode.
Ted
Market at risk? The angle of ascent sustained without a breather for 9 consecutive weeks--I'm not sure we've ever witnessed anything like it--running headlong into massive overhead resistance. The following chart goes back 8 years.
We just covered the same amount of territory that required a WHOLE year in 2003-2004.
Landm, currently own SMN and FAZ. Will continue to build if opportunities present. Otherwise will simply hold what I have. Will be quite cautious here.
Ted
PS
So, hey, Ted, what about this you just wrote?
[NOTE to TJWNY and all: The only way you can get into trouble is by trying to be smarter than the market--to guess where the reversals are likely to occur. This is what the Short-Trading TA board members were trying to do for the last several weeks. The method I'm proposing requires a new understanding and commitment but it will work absolutely. It cannot NOT work! Test it any way you want. It will still remain true.]
Are you trying to be smarter than the market? Answer: Yes. Let's see how the trade turns out. Perhaps it was a stupid mistake. ;)
Look, I wrote last week on the Short-Term TA board and perhaps here. I simply don't recommend risky short-term trading to anyone. It is too difficult for most people (and that may include me). I've enjoyed a good run. But I want to make a transition to holding more positions that *own* the life of the market where price is long and strong above the 20-day ma. It's a far less stressful way to go, and it probably leads to even better returns with very little risk.
TJWNY, read posts 72, 80, and 89 carefully. I'm proposing something so simple that brilliant minds miss it. It's utterly impossible for anyone--government or mafia--to distort or avoid. It's checkmate but you--tjwny--always win.
[NOTE to TJWNY and all: The only way you can get into trouble is by trying to be smarter than the market--to guess where the reversals are likely to occur. This is what the Short-Trading TA board members were trying to do for the last several weeks. The method I'm proposing requires a new understanding and commitment but it will work absolutely. It cannot NOT work! Test it any way you want. It will still remain true.]
The method will no doubt require resolve to trade, but what method doesn't? You have to understand the principle highlighted in the above posts, fix it in your mind, and pay attention to nothing else. This is what any champion does at the moment of execution.
Notice the charts in 80 and 89 have *no* indicators, and yet the result is clear. The simplicity enables you to focus on *only* what is important.
So what is important? Well the rules are expressed in post 72. What's important is to see where the life of the market is--and to only own that. If price crosses below the moving average you have chosen to trade (20-day or 50-day for example) and the line rolls and heads down, you must not own that vehicle. So you see, anyone can trade with complete rationality and clarity at all times following those rules.
If you examine each of my posts from March 9 to present on the Short-Term TA board (see link below), it's quite clear that I was trying to tell other board members something important that I could see. The accuracy down to the finest details was accurate to an extraordinary degree. I'm not bragging. I want you to know what I know, and what I know is extremely simple. So simple that brilliant minds miss it. Here's the link for new readers. My name was was Doubletake before starting this board, the name being that of an interesting software company (DBTK).
http://investorshub.advfn.com/boards/board.aspx?board_id=2593
Believe what you want, but if you want to invest and if you want to participate in the adventure of a lifetime, consider carefully what I'm trying to say. I have nothing to gain by trying to fool you. TJWNY, you know how accurate I've been for 9 weeks running now. I'm the first to admit it could be a fluke, an outlier event. I assure you it isn't, and the answer lies in the charts posted in 80 and 89.
Good luck to you!
Ted
PS
Note to the board: TJWNY is a colleague from the Short-Term TA board. The above was my response to his post--which is quoted in the prior post by Landm (see post 92)
I liked this post
Posted by: tjwny Date: Monday, May 04, 2009 9:23:23 PM
In reply to: PriceTeam who wrote msg# 38139 Post # of 38142 [Send a link via email]
Every body includung me is stunned with disbelieve. It is not just a 33% rally in S&P. Look at stocks at brink, LVS MGM BCS AXP WYN HOT, now some are up 400%. This short squeez on financials is nothing short of psychological warfare. Look at not just the money lost by shorts ( including me ) but even more painfull is oppotunity lost.
Wall street mafia, at brink of oblivion resorts to a dirty long squeez in Jan-Feb after it had CLEARLY assessed the damage to financial system by Lehma AIG etc debacle and the remedy prescribed by fed and treasury. It was a manufactured decline as opposed to unexpected shocks last fall. ( as you have noted crashes only happen rarely.)
Recently "Black Swan " echoed my own musings that stock market has similarities to ponzi scheme as market is not a depository vehicle. But the rampant greed of financial mafia will drive away all its feeders as they bring on serial crashes and rally backs squeezing both longs and shorts. Even Bernie offered its clients steady returns for a long long time.
I applaud your efforts to find a holy grail of a T/A. But imho you are on wrong track. As the article in Bloomburg states about uselessness of T/A; no such thing exist or ever will. It is quantum chaos / general relativity.
Regarding data input for a TA, price is primary data while moving averages are only derivitives of price. There are two other important variables 1. Volume 2. Breadth. Vector Vest nicely put them all together.
Problems are two fold. When market makers and their friends decide on a rally they will distort all older chart patterns. secondly they propagate and control flow of all finacial news ( notice the paucity of bad news now ). During rally they filter or modify bad news and vice versa. Only thing that may work in favor of small fry like us is TIME. They can not achieve their gaols in a short period as you see last decline and rally have taken about two months. Hardest thing for us is to be patient and go along with a simple system buy the dips in up move and sell the tips in decline with taking profits along the way. Again the problem is we are too connected to the news and as such become victims of Psycho warfare. Our ego tells us yes we have the correct infomation without realization we are being manipulated.
Forgot to ask what vehicles are you using to build this short position?
correction re: Hurst.
Count 22 days on last 5-week cycle, and that would put us on 17 days for the second 5-week cycle. Which makes next Tuesday, May 12 the likely launch date. The low print? Perhaps Friday am?
Ted
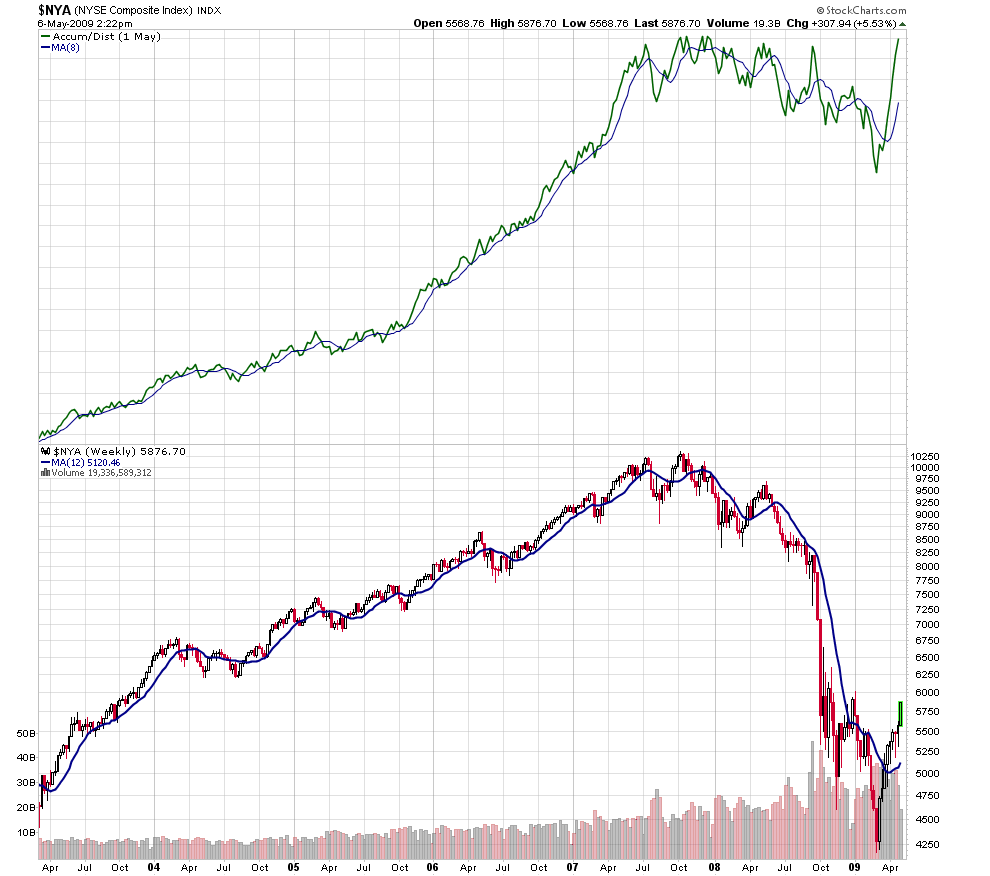
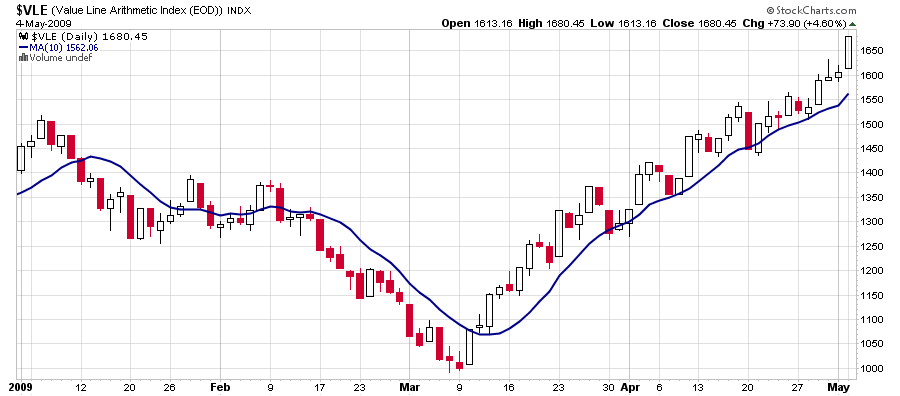
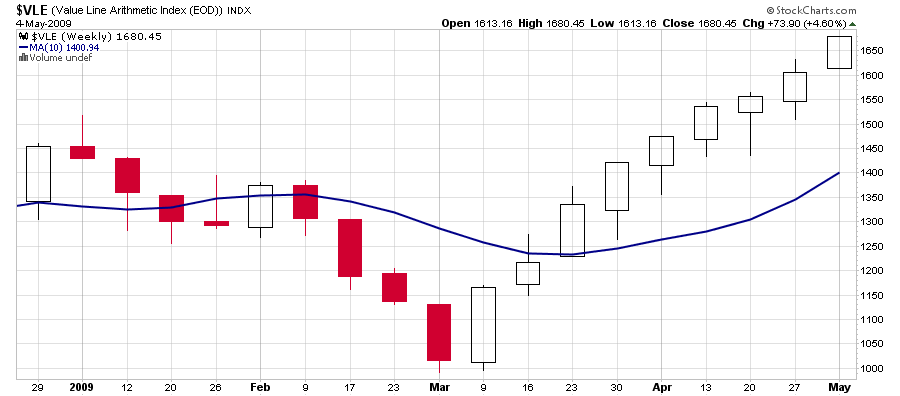
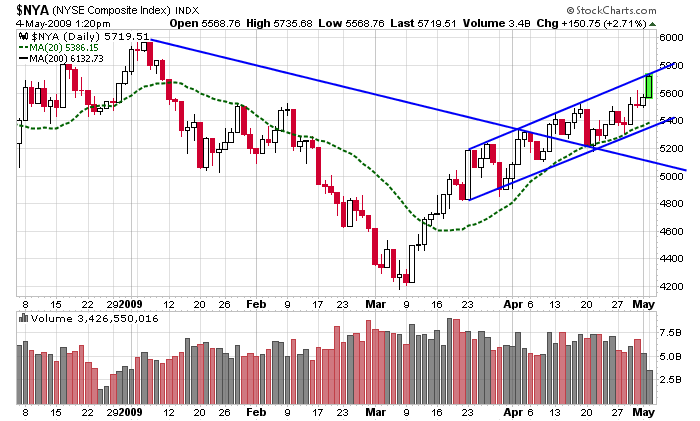
That may have been the blowoff. The daily chart of $VLE has been up for 5 consecutive days, and the weekly for 9 consecutive weeks. In addition, the $nya is at the top of the channel.
The daily chart shows the 10-day ma, and again you can see how this illustrates the simple rules presented in post 72. Notice the neat cross and backtest of the 10-day ma on March 11 and 12. This is rare so don't expect to see it this neat more than a couple times a year! The weekly chart (the second one) shows the 10-week ma, and again the signal is plain to see--the nicely curving average right at the cross point, May 23 to 30. Also notice the neat backtest of the 10-week ma.
MrMoney, pay up. I need you. ;) (EOM)
FAZ: Here's a post I made to MrNatural about a week ago:
http://investorshub.advfn.com/boards/read_msg.aspx?message_id=37384315
FAZ just hit $6.9. It's within my target range but still a risk. $5.79 a possibility, but the bounce back would (high probability) be above $7.
Not recommending anything.
Ted
Any Hurst analysts out there? I'm counting 21 days on the last 5 week cycle which would put us at 18 days now on the second 5-week cycle. I don't believe in putting too fine of edge on short-term cycles but I'm just noticing the possibility. Now that would be the ultimate headfake--the 10-week low being all over and done by Friday, May 8.
Ted
Beautiful work, Land. Dead serious. This is what we want here. Questions. The answer gets into trading strategy--of which I am no master--even though I've enjoyed 100 percent accuracy for the last 3 weeks--even with the counter-trend moves. What I'm doing here is a short-term trade (fast action, possibly risky). That is not the purpose of this board or what I want to teach or lay out. The main subject is a new form of TA.
I'm not recommending going short here--simply acknowledging that I'm building small short positions. The objective is to catch the small wave down into the 10-week low. My anticipation is that it will happen in a FLASH-BANG move, and it will be all over before anyone can think about it.
This is NOT a shorting market, and the positions being taken are count-trend. They are based on my read of the 10-week cycle and many indicators reaching extreme levels including the $NYMO.
The short positions are based on a composite of indicators that are beyond the scope of what I want to lay out over the next few weeks.
I am building the short positions slowly to obtain the best possible average--and to ensure that either I will make money or I will get out for even.
I anticipate one of two things happening between now and Thursday. 1) The market continues to climb higher. 2) The market begins to recede directly beginning tomorrow.
Let's see what happens.
Ted
2:33 pm. Blow-off top a high probability over the next day or two. Then the retreat into the 10-week low before Wednesday, May 13, may stay above SPX 830.
Ted
Just to clarify this seems like a human emotion observation and don't see what it is based on
Question why not let the market prove some weakness ? What is kicking in the shorting on the computer model. "I'm carefully building short postions here " based on what is there an indicator and here we go taking out 900 on SPX
In edit Taking shorts here may be early.... Don't we want to look for the surer entry...
Administrative question: I want to create an online TA instruction and reference manual with text and charts. I want to do this once, do it right, forever. Can anyone suggest the best way to organize and store this information securely online? My own website? I'm sure I'll figure it out by if someone has an idea, I'm open.
Ted
=======================================
It will have the following sections:
Title:
HOLISTIC STRUCTURAL MOVING AVERAGE ANALYSIS
Introduction: Basic Instructions in New TA Method
How to Find and Apply TA Knowledge to Consistently Trade
with an Accuracy Above 70 Percent and Why This Will
Automatically Lead to a Fortune
Thinking Like a Champion: Why This Has More to Do with TA Than
Anyone Ever Knew
The Importance of Owning Your Own "Not-Knowing Meter"
Compendium of TA Signals and Indicators
KNOWLEDGE (Predictive and Descriptive)
IFFY CLUES (Ranked and divided into Predictive and Descriptive)
1:22 pm $NYA chart:
I am carefully building short positions here. Not expecting to make a lot. Being cautious because price can walk right up that top channel line for a few days--or explode up in a blowoff. Shorting here is chancy, but controlled chancy, especially if done in small bites.
Notice how cleanly the rules regarding the 20-day ma worked on this chart (post 72). [20-day ma is green, dashed line.] Will make the rules more clear and specific in coming days. Also, it's not always this easy! So what? The market is not a handout. It is noisy, mostly chaotic. Then occasionally, magically, the moving averages turn HARMONIOUS UP (a bull market) or HARMONIOUS DOWN (a shorting market).
The 20-day is like the heart of a tree. It is where the life is. Look at how the 20-day flowed right in and through the resistance that seemed insurmountable just after April 1. My analysis suggested today's high-water mark back then. The trick to investing is to forget about gravity (which makes you believe price is going to fall any split second and to focus instead on the life force. You want to own the life--when price is above the 20-day.)
Lee, we are not forgetting about you. Obviously I liked your question so much I turned it into a sticky note. ;) Let's just leave it there as a magnet for information. It will come. It's percolating just beneath the surface right now. I can feel it.
I know you use volume as a leading indicator. While there are moments when I can psyche out what's happening with volume as a clue, I have found it notoriously unreliable--especially when analyzing the larger market. So many times I've seen analysts pointing out the low volume as a reason for going short just prior to a breakout to the upside. So then, what did that information buy but a lot of trouble?
Now I know you're using volume on 5-minute charts. Different situation to some extent.
My method is holistic--meaning I put everything I know in a pile and then view it in a highly integrated way. Will be explaining how I do this later in detail.
When I put every detail together (the practical, knowable stuff) along with an integrated combination of the iffy clues, this is what is most predictive for me when analyzing the larger market.
In truth, however, I'm not so interested in predictions. I just want to know what I ought to own and what I ought to sell. Then I need a good strategy for easing into what I want to buy and getting out of what I need to sell. Buy/sell strategy is a whole separate subject--and we'll get to that weeks from now. First, I want to demonstrate how to track and trace the market.
Ted
Thanks PT really appreciate the input on that and well said be back in a bit ....
Land, The Tunnel. A few general comments. The guy makes excellent points, and if he makes money with this (I'm sure he does), that's great!
First, when I use the 10, 20, 50, 75, 100, 150, and 200 ma's, I do so with great flexibility. I will often adjust them around to see if it tells me anything useful. So when I say 10, for example, I mean anything between 8 to 12. Same is true of all the ma's, the way I use them. I have found no practical advantage of ema's. I'm not opposed to them whatsoever--just no advantage seen.
Second, I'm not seeing the distinct advantage of the The Tunnel method. Looking at a 1-year chart of the $SPX using my boring ma's versus the 12, 144, 169 paradigm, the latter does not turn on any bright shining lights.
Third, the author wrote: "Everyone should know that all moving averages are lagging indicators. It makes no difference the type, they all lag. Only after the fact can they tell you the market has turned."
While this is partly true, in the end, I disagree strongly. There is a way to use ma's that produces consistent returns. I'm not trying to make *perfect* entries and exits--just reliably consistent ones, and in my opinion, ma's provide us with outstanding signals, real-time signals. You have to know how to use them, and I will be making that abundantly clear soon enough. I have laid out the basics.
Here's the thing about ma's. They always tell us what is really going on in the market--apart from anyone's opinion or guess or bias. Manipulation or no manipulation, tricks or traps, the ma's show me. I will clarify all this piece by tiny piece.
There are two major reason traders are making big mistakes: 1) They have the wrong model. 2) They are flooding the brain with too much information--especially too much IFFY information. The decision-making brain (imperfect at best) now is overwhelmed to the point that stats are virtually guaranteed to fall below 70 percent.
When I read the The Tunnel Method, I can feel my brain getting overwhelmed again by too much iffy information. What we want to see stats over 70 percent is the simplest understanding that provides us *everything* we need to know to achieve profitable returns.
This is just my first impression.
What I've noticed among investors and TA types is that they want to appear sophisticated, use fancy terms, and so on. You will find my methods are not that.
I want an understanding of the market a computer can comprehend with high reliability. If it needs to be complicated, so be it. I've discovered it doesn't. The complex understandings are confusing us and leading to wasted time and cash.
Ted
OT: Technical question. I tried posting this to the Q & A board but no answer yet.
==================================
Question re: charts. I uploaded a chart to my library.
1) Is there a way to delete it?
2) I right-clicked on the image, and I think I selected an option that said "Block from InvestorsHub." Now I can't see the picture, and I can't get it back. I see a box with all the info about the pic but no pic. How do I unblock the picture? I can't find any options.
3) If I want to embed charts in my posts, is using the library the best way to go about it?
Thanks!
Ted
Welcome to the Price Research and Trading Team
We are dedicated to pooling our best intelligence and understanding of price dynamics to achieve a 70+ percent accuracy rate both in trading and market calls.
This is not a general chat board. This is a business meeting--24 hours a day, 7 days a week, a stream of focused creativity, market analysis, and trading techniques. Because this is a business meeting and a continuous brainstorming session, freedom of communication will be protected even while posts will be managed to a high standard. Meaningful, thoughtful analysis and civil dialog invited. Other things will go poof! To post here, you will need to be a paying member of InvestorsHub. They provide a great service. Please support their work.
While all trading models and methods are welcome, the focus is on the science of price behavior and trading. Be prepared to answer this question repeatedly: Does your TA method produce reliable market calls and trades with an accuracy rate exceeding 70 percent? If it doesn't, the method is probably not a meaningful description of price behavior--or you're not applying what you know with enough consistency to call it a business--a huge issue which will be addressed thoroughly here.
The purpose of PriceTeam is two-fold: 1) To attract individuals and businesses interested in improving trading and investing results. 2) To lay out an understanding of price
that consistently produces market calls and trades with an accuracy rate exceeding 70 percent. Our focus is applied knowledge, knowledge that can be used to engineer wealth without luck or accident. We will capitalize on luck every time it comes along, but the best way to prepare for luck is to *know* what you're doing. ;)
| Volume | |
| Day Range: | |
| Bid Price | |
| Ask Price | |
| Last Trade Time: |


