The (Chart-Illustrated!) Moving Average (Low or No Indicator) Trading Method Using Daily Charts
============================================= The following illustrates an extremely simple trading method where you can filter out most of the market noise, opinion, bias, fear, manipulation, whatever stops you from earning consistent income.
The advantage of this method is you don't have to overwork the brain trying to calculate the infinite impossible odds of one iffy indicator plus another iffy indicator plus another iffy indicator. When the brain is at rest and it has a model that simply works, it makes better decisions.
I believe that if you will focus on just this model (fine-tuning where it suits you), you will outperform not only the market but all the fast-action, "smarty" short-term traders. Why? Because you will have an amazing accuracy with peace of mind, and you will capitalize on more of the move--even while knowing so much less than all the "experts." =============================================
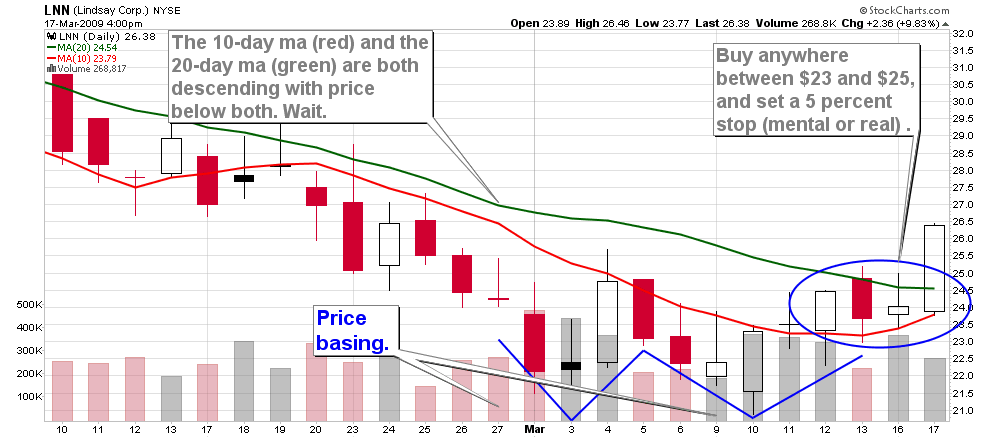
1. Pick a moving average that fits with your personality and trading/investing horizon--10, 20, 50, 200-day ma. For this post, I will focus on the 10-day and 20-day ma combination, and I will use a stock (LNN) as the trading vehicle.
2. Buy when price climbs above the 10-day ma (red) and the 20-day ma is flattening and likely to turn up or is already pointing up. Buy as close as possible where price crosses up. (NOTE: I trust price crossing ma's much more than I trust ma's crossing ma's as signals. The price cross is much closer to realtime--not after the fact.)
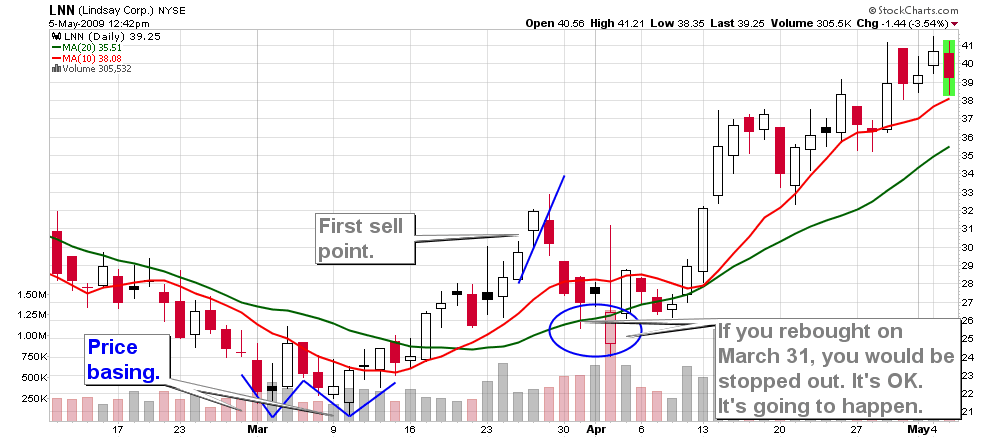
3. Sell if price falls below your entry point by [> 5 percent] and especially if price falls below a flattening ma and heads down.
Note: Quick, small breaks of the ma when the ma is pointing steeply up are likely headfakes or overshoots, and price is likely to trend higher. Also the numbers in brackets are variable and an area for continuous improvement. So try 2 percent to 7 percent and see what works best.
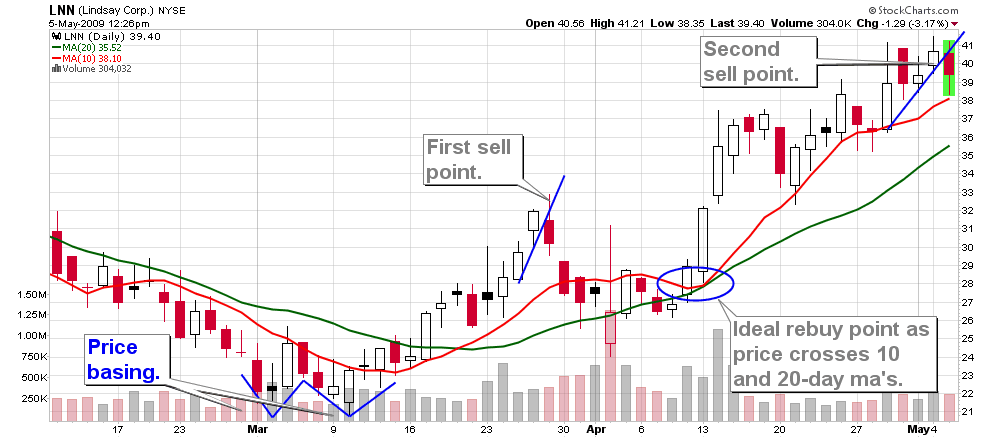
4. If you are an easygoing investor as opposed to a trader, let the trade ride until the 20-day ma begins to flatten and roll down and price crosses below the 20-day. As a trader wanting to capture quick profits, sell your position if price climbs 10 to 20 percent above the 20-day ma line (depending on the volatility of the trade vehicle), and draw a line along the base of the candlesticks as illustrated. Sell on a break of the hand-drawn line. This strategy maximizes profits. Then rebuy on the dips as long as the ma is clearly pointing higher and price is above the ma.
In this scenario, the first buy paid approximately 29 percent and the second, 42 percent, for a total of 71 percent in 8 weeks--not figuring any compounding. Obviously, this was an ideal setup, and in the real world, you will work for weeks and months to catch another ride like this. The main point is this: Follow these rules, and it is nearly impossible to lose. The only thing not anticipated here is an overnight gapdown because of bad news.
Strip price to the barest data that tells us BUY, HOLD, or SELL.
Register for free to join our community of investors and share your ideas. You will also get access to streaming quotes, interactive charts, trades, portfolio, live options flow and more tools.
 News
News  Market Data
  Discover