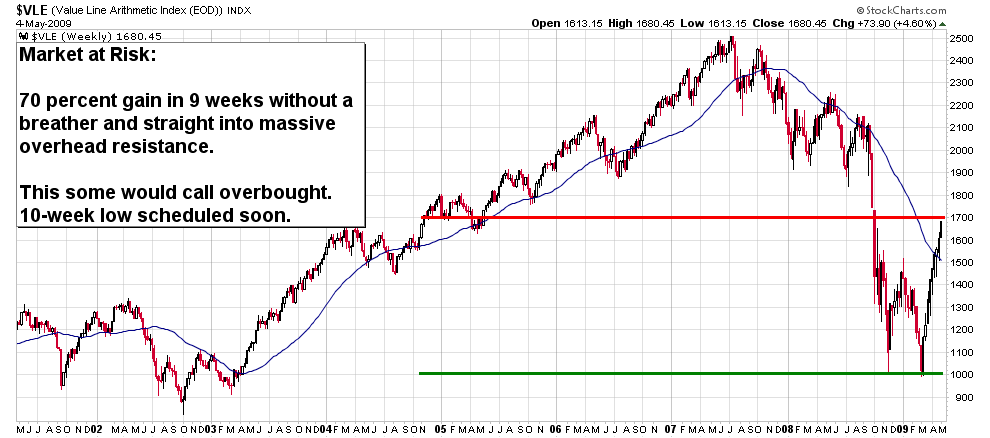
Market at risk? The angle of ascent sustained without a breather for 9 consecutive weeks--I'm not sure we've ever witnessed anything like it--running headlong into massive overhead resistance. The following chart goes back 8 years.
We just covered the same amount of territory that required a WHOLE year in 2003-2004.
Strip price to the barest data that tells us BUY, HOLD, or SELL.
Register for free to join our community of investors and share your ideas. You will also get access to streaming quotes, interactive charts, trades, portfolio, live options flow and more tools.
 News
News  Market Data
  Discover