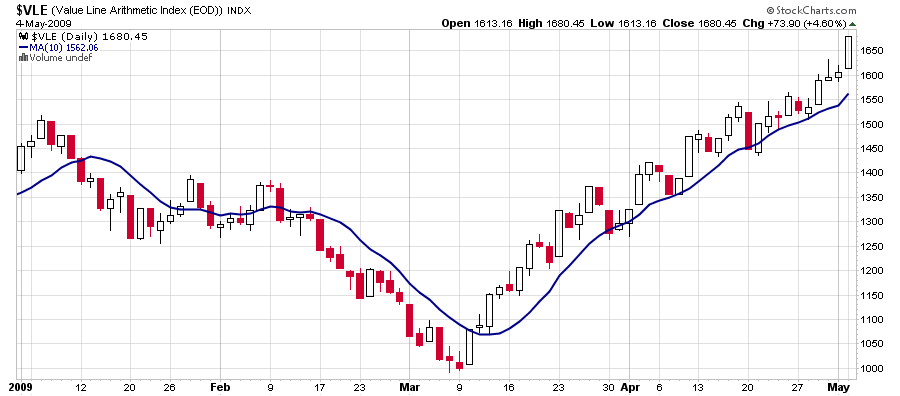
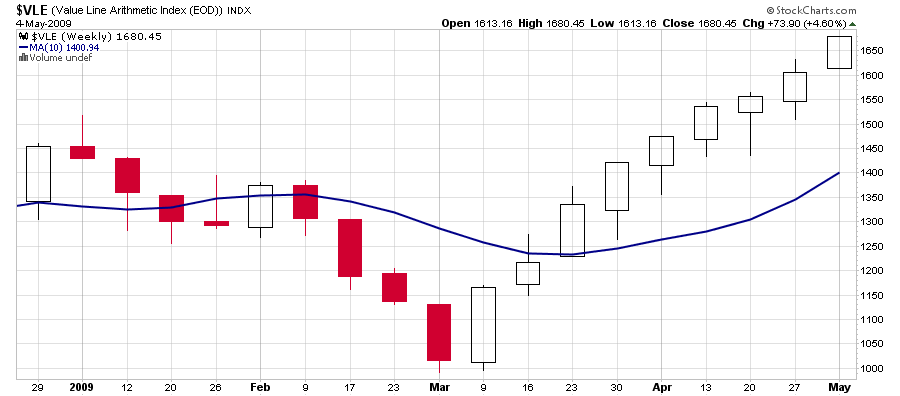
That may have been the blowoff. The daily chart of $VLE has been up for 5 consecutive days, and the weekly for 9 consecutive weeks. In addition, the $nya is at the top of the channel.
The daily chart shows the 10-day ma, and again you can see how this illustrates the simple rules presented in post 72. Notice the neat cross and backtest of the 10-day ma on March 11 and 12. This is rare so don't expect to see it this neat more than a couple times a year! The weekly chart (the second one) shows the 10-week ma, and again the signal is plain to see--the nicely curving average right at the cross point, May 23 to 30. Also notice the neat backtest of the 10-week ma.
Strip price to the barest data that tells us BUY, HOLD, or SELL.
Register for free to join our community of investors and share your ideas. You will also get access to streaming quotes, interactive charts, trades, portfolio, live options flow and more tools.
 News
News  Market Data
  Discover