 News
News  Market Data
  Discover
Support: 888-992-3836
Copyright © 2023 InvestorsHub Inc.


Register for free to join our community of investors and share your ideas. You will also get access to streaming quotes, interactive charts, trades, portfolio, live options flow and more tools.
Gold Stocks Are Heavily Oversold – A Rebound Is Likely Soon
By: Przemyslaw Radomski | July 15, 2022
• Gold stocks declined by about 31.5%, which perfectly fits my previous analogy to 2008. If history is to rhyme, we can expect a corrective upswing soon.
2008, Is That You Again?
History tends to repeat itself. Not to the letter, but in general. The reason is that while economic circumstances change and technology advances, the decisions to buy and sell are still mostly based on two key emotions: fear and greed. They don’t change, and once similar things happen, people’s emotions emerge in similar ways, thus making specific historical events repeat themselves to a certain extent.
For example, right now, gold stocks are declining similarly to how they did in 2008 and in 2012-2013.

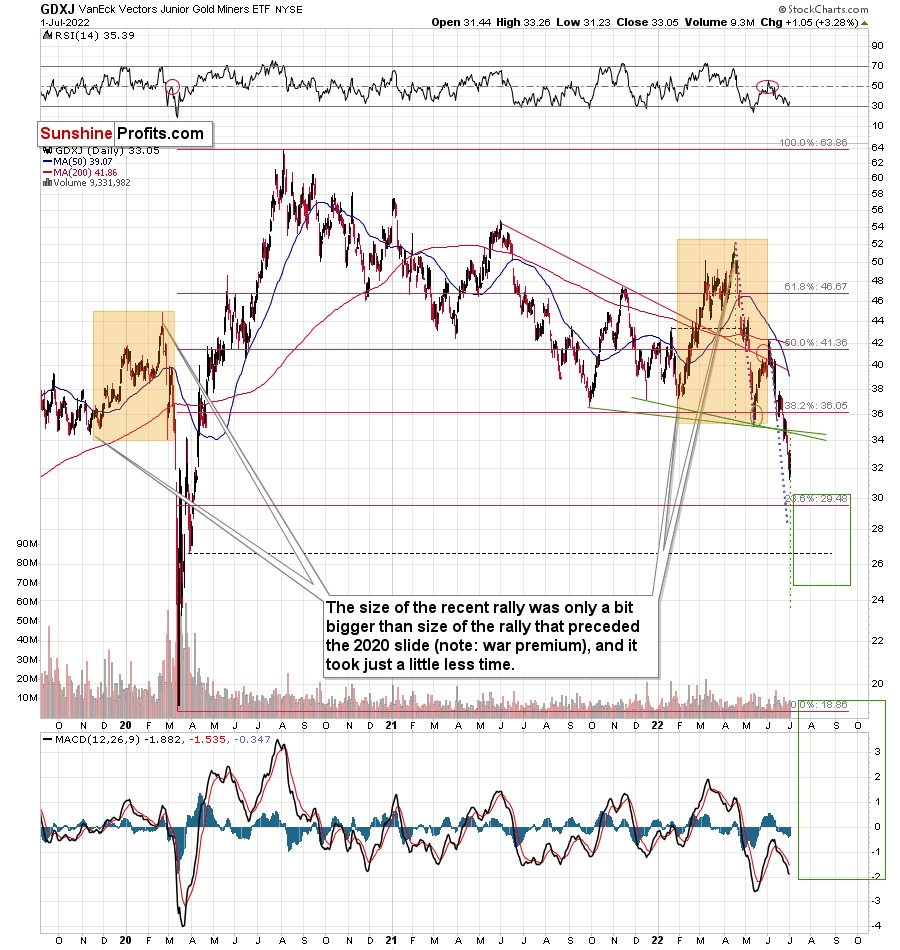
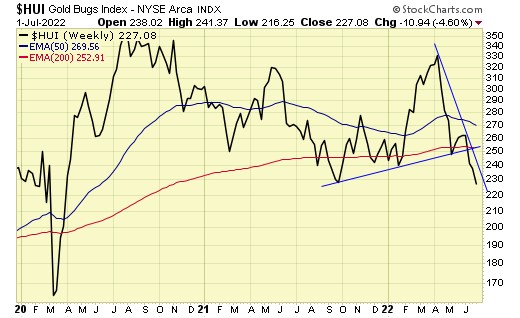
The Russian invasion triggered a rally, which was already more than erased, and if it wasn’t for it, the self-similarity would be very clear (note the head-and-shoulders patterns marked with green). Since the latter happened, it’s not as clear, but it seems that it’s still present. At least that’s what the pace of the current decline suggests.
I used a red dashed line to represent the 2008 decline, and I copied it to the current situation. They are very similar. We even saw a corrective upswing from more or less the 200-week moving average (red line), just like what happened in 2008.
We saw a breakdown to new short-term lows, which means that the volatile part of the slide is likely already underway.
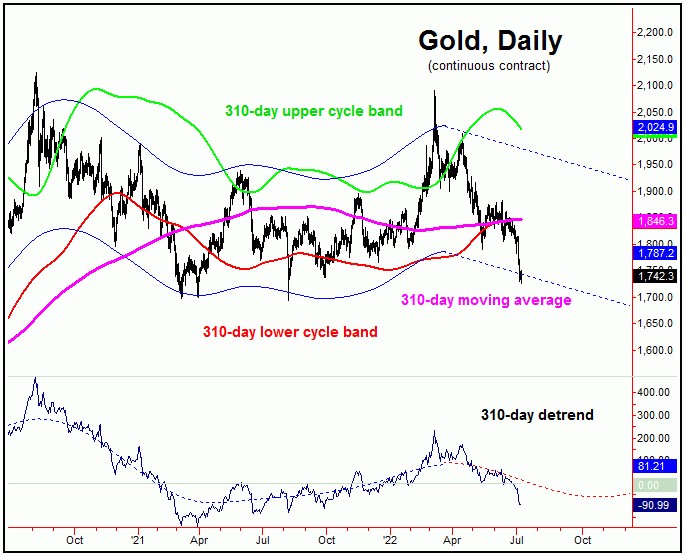
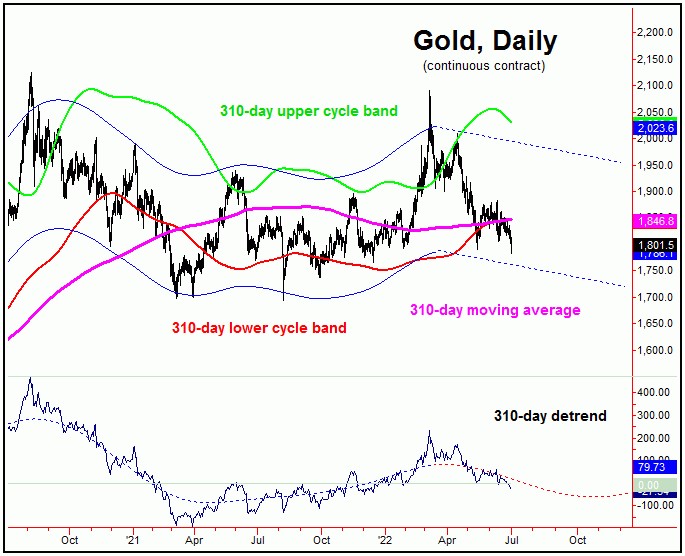
Moreover, last week, I commented on the above chart in the following way:
On a short-term basis, we see a short-term (only) downside target of around 200. That’s about 10% below yesterday’s (Thursday’s) closing price. There are several reasons for it:
1. It’s a round number, and those tend to be more important psychologically than other numbers.
2. That’s where we have the rising medium-term support line based on the 2016 and 2018 lows. The temporary move below this line triggered a massive rally in 2020.
3. That’s where we have the 61.8% Fibonacci retracement level based on the entire 2016-2020 rally.
Not Every Fall Must Be Bearish
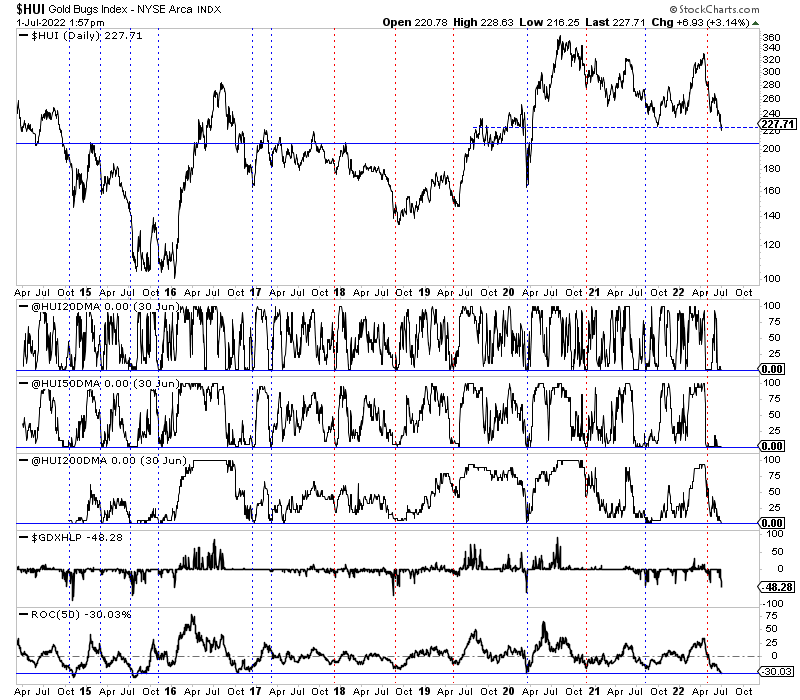
The 200 target was just reached yesterday. In fact, what happened was even more bullish than that – we saw a tiny move below this level – to 199.22, and then a comeback and a close visibly above 200 – at 204.67.
Ultimately, the HUI Index moved lower yesterday, and many will view this simple fact as something bearish. However, doing that would be a “rookie mistake” – after all, major bottoms can only form after declines, right? My point is that a move higher or lower is not bullish or bearish by itself. It’s the context that adds meaning to a certain price move. In this case, a major support level was reached while the HUI Index was already heavily oversold.
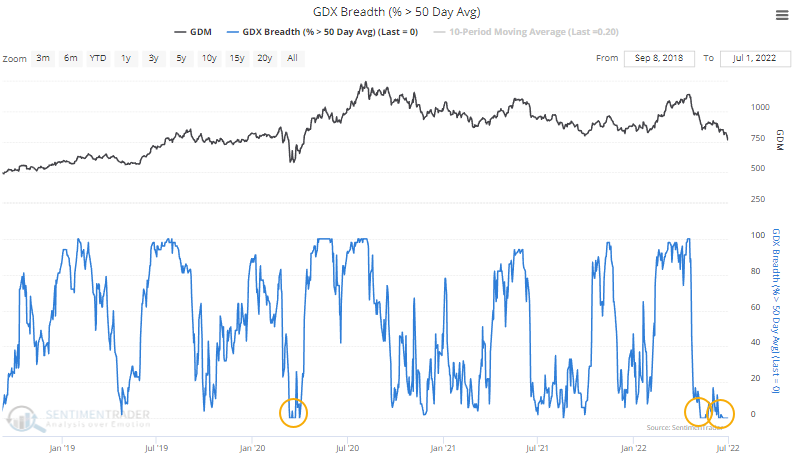
In fact, based on the RSI, the gold stocks are even more oversold than they were at their 2020 bottom!
Consequently, a rebound here is a likely short-term outcome.
All right, let’s zoom in and see how mining stocks declined in 2008.

Back then, the GDXJ ETF was not yet trading, so I’m using the GDX ETF as a short-term proxy here.
The decline took about 3 months, and it erased about 70% of the miners’ value. The biggest part of the decline happened in the final month, though.
However, the really interesting thing about that decline – that might also be very useful this time – is that there were five very short-term declines that took the GDX about 30% lower.
I marked those declines with red rectangles. After that, a corrective upswing started. During those corrective upswings, the GDX rallied by 14.8-41.6%. The biggest corrective upswing (where GDX rallied by 41.6%) was triggered by a huge rally in gold, and since I don’t expect to see anything similar this year, it could be the case that this correction size is an outlier. Not paying attention to the outlier, we get corrections of between 14.8% and 25.1%.
The interesting thing was that each corrective upswing was shorter (faster) than the preceding one.
The first one took 12 trading days. The second one took seven trading days. The third one took 2 trading days, and the fourth and final one took just 1 trading day.
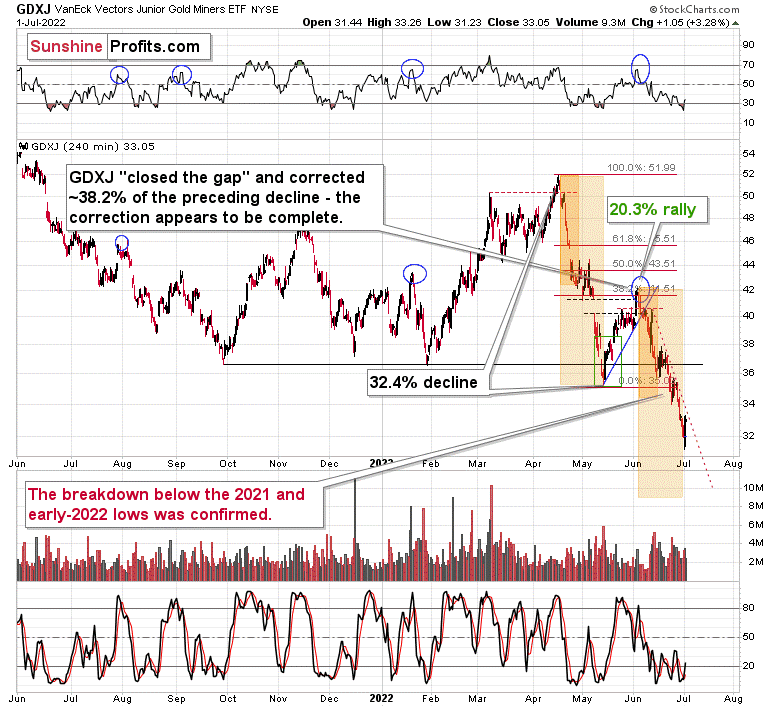
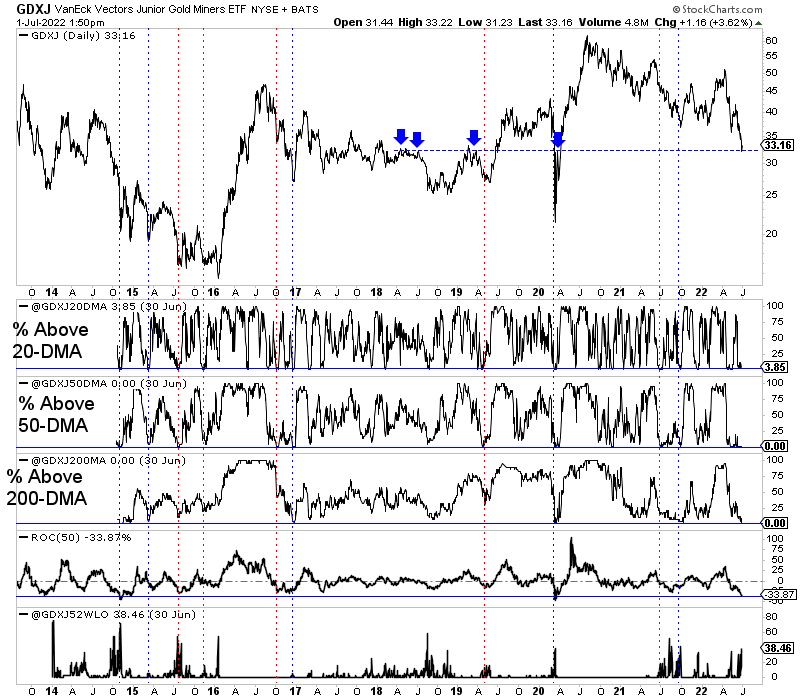
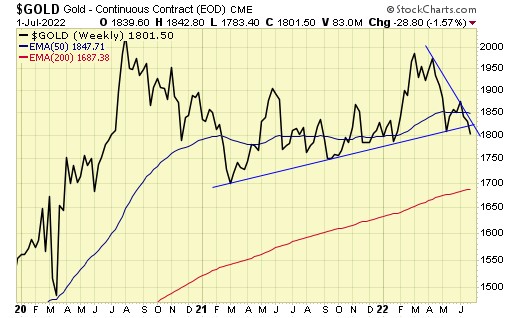
Fast forward to the current situation. Let’s take a look at the GDXJ ETF.

The GDXJ ETF declined by 32.4% and then corrected – it rallied by about 20.3%. The corrective upswing took 14 trading days.
Now, it has declined by about 31.5%.
The above is in perfect tune with the previous patterns seen in the GDX during the 2008 slide.
I previously wrote the following:
What does it tell us? It indicates that history can be rhymed, and while it will not be identical, we should pay attention to the indicators that worked in 2008. The next corrective upswing (a notable one, that is) might start when the GDXJ ETF declines by about 29-35% from its recent top.
To clarify, I don’t claim that the above technique would be able to detect all corrective upswings, or that I aim to trade all of them. For instance, in my view, it was a good idea to enter a long position on May 12 and switch to a short position on May 26, but I wasn’t aiming to catch the intraday moves.
Again, yesterday’s bottom formed about 31.5% below the recent high, which perfectly fits my previous estimate and the analogy to 2008.
Based on how long the corrective upswings took in 2008 and how long the recent one took, the upcoming corrective upswing is likely to take between 5 and 10 trading days. If the bottom formed yesterday, which seems likely as the GDXJ ETF is already up by over 1% in today’s London trading, then we can expect the next local top to form within 1-2 weeks. In other words, it seems that the corrective upswing is likely to end in the next part of July – probably in its final week.
Back in 2008, the counter-trend rallies varied greatly in their magnitude, but please keep in mind that back then, the decline was very much news-based – Lehman Brothers’ collapse, etc. This time, the decline is more measured, so declines and corrections are more measured as well.
While back in 2008, during the first correction, the GDX gained only 14.8% and during the second one it gained a sizable 41.6%, this time the first rally provided a measured 20.3% increase. If the upcoming correction is also measured, then the GDXJ might also rally by about 20%.
If yesterday’s intraday low was indeed the final bottom, then the starting price would be $28.88 and a price 20% higher is ~$34.66, which fits my target area for the upcoming correction.
Naturally, the above is up-to-date only at the moment of writing these words (Friday, July 15th), but I’ll keep my subscribers informed with regard to any changes.
Read Full Story »»»
 DiscoverGold
GDX broke below 26 but I still think that an intermediate term low is imminent
By: CyclesFan | July 14, 2022
• $GDX broke below 26 but I still think that an intermediate term low is imminent. GDX is very Fib oriented when it comes to major low to low counts:
03/03/21 -> 09/29/21: 147 TD
09/29/21 -> 12/15/21: 54 TD
12/15/21 -> 07/14/22: 144 TD
Today's gap could be an exhaustion gap.

Read Full Story »»»
DiscoverGold
I wouldn’t be surprised if gold went up 50 suddenly.
Barrick's (GOLD) second-quarter gold output rises about 5%
By: Reuters | July 14, 2022
Barrick Gold Corp on Thursday reported a 5.4% rise in second-quarter gold output compared to the previous quarter, driven by stronger performance at its Carlin and Turquoise Ridge mines in Nevada.
As the Ukraine crisis exacerbated longstanding global supply chain issues, Barrick took a slew of measures to mitigate the impacts, including nearly doubling its inventory of key mining supplies such as cyanide, explosives, and steel balls used for milling.
The world's second-biggest gold miner said the average market price for gold in the quarter was $1,871 per ounce, compared to $1,877 per ounce in the previous quarter.
Total preliminary gold production for Barrick stood at 1.04 million ounces in the quarter ended June 30, up from 990,000 ounces in the first quarter.
Copper production in the reported quarter rose to 120 million pounds from 101 million pounds in the prior quarter, driven by higher production at its Lumwana mine in Zambia, southern Africa.
Read Full Story »»»
DiscoverGold
Hold on to your Hats folks. glad to see reinforcement of what i see.
The Ord Oracle: GDX Update
By: Tim Ord | July 13, 2022
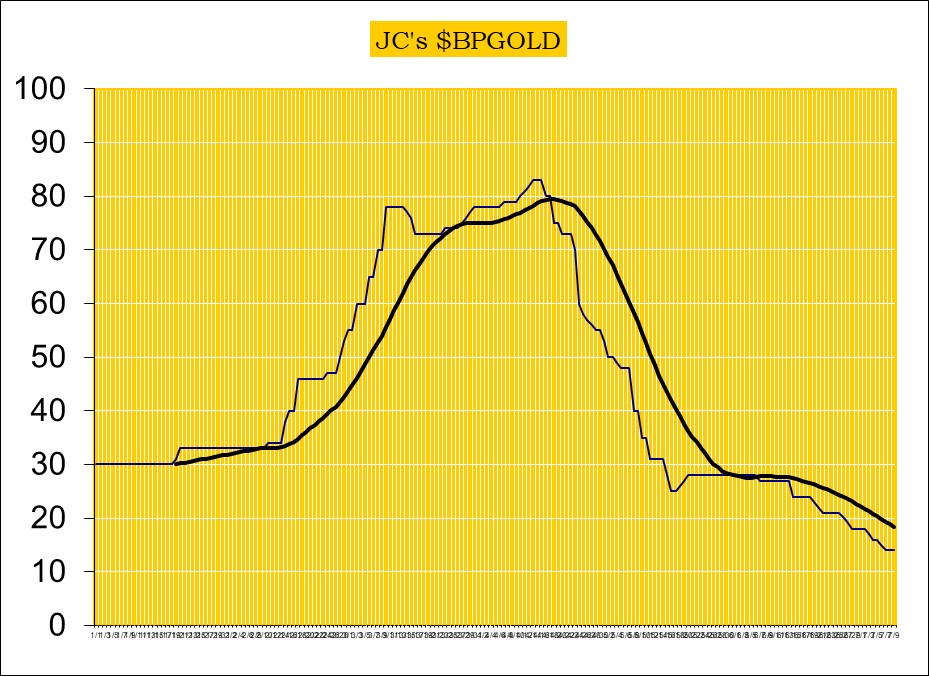
• The 2rd window down from the top is the Bullish Percent index for the Gold miner’s index/ $GDX ratio and the top window is the RSI (10) for this ratio. We picked the times the RSI for this ratio fell below 25 which happen 7 times (one failed).

Read Full Story »»»
DiscoverGold
In looking at 2008 Bear vs. today, where the miners have already been in an 18 month bear market.....it is just not that the Gold miners and GOLD was back then at the END OF A RAGING GOLD BULL..
it is not just that today's miners have PE's that are half of the frothy PEs of that gold bull market.
It is also that the balance sheets of the gold majors simply blow away the balance sheets of those companies back then....Back then Gold companies were paying wild premiums to acquire and using their stock as payment and it was a real paper chase thing, and the companies had no cash, they were so heavily leveraged....like the tech wreck of today which still exists..
and today further is showing that the West is shutting down mining of all sorts of things, gold being one area....The Green Agenda despises metals and mining....and remember too that the major gold discoveries simply are not being made; who wants to even put serious bucks into mining in america, when you know the EPA or ACOE will shut you down and never give you a permit, no matter how many world class science and engineering reports you can show them, when you ask for a federal permit,....THE FEDERAL BURECRACY JUST SAYS NO.......so there is a scarcity thing now too.....that largely did not exist 14 years ago.......the greenies and their ridiculous governments and financiers are perfect for gold and the coming cataclysm
.none of this existed in 2008 in a meaningful way.
DiscoverGold's post on the ten day moving average is very very smart...
will post more on the UKE thing, which I have followed very closely, and which it is clear reveals the absurdities of the Western financial Regimes and will soon prove to be the straw that breaks the bankers backs...
thanks T. to pick a bottom of a nascent bull market is very hard to do but we have a real fine shot. Lets see if the thesis holds up.
You gotta have a plan.
What is important about gold, which is a tricky metal and market, .;...is not so much the connection to inflation which is surely that, but I view that as a symptom only. The cause, and what makes a gold Bull market come into being, is that there is a major threat to the financial regime which exists....and therefore to the currency of that regime, in this case the dollar being the dominant fiat but all of these paper regimes are supporting wild out of control governments both politically and financially......the government rulers deserve in almost every country except russia and India and brazil, to be toppled. The Euros and canada more laughable even than america, which is an absurdity.............
What never ceases to amazes me is that corrupt can go on for years and years, but this UKE thing and the newly developing BRICs, spells doom for the dollar and the Western house of cards.
Very good observation, not for the fact that I understood this as well, I’m just glad to see other similar market analysis as mine. This is the best month of year and timing is all there for huuuge run. We shall see.
comparing this to just one bear market, the last true one, in 2008/2009....what happened is that GDX really got hammered. It peaked in march, as I recall, St. Patrick's day to be specific (or at least gold the metal did, I forget which but won't forget that day as I was making a ton in the miners...blah blah..that gold bull had been raging for years...)...and then gold and the miners followed the coming bear market down, which lasted about a year, and was very severe....at some point, gold and the miners quit going down....well before that bear ended.
The miners at the time the markets started cratering into the bear, were richly priced. All of the top ones, the ones with earnings, were all priced at 30 to 45 to 1 PEs....it was very frothy, and while the housing bubble existed, and the market was rich.....inflation was not remotely the issue it is today....Relative to today inflation back then was tame, with the exception of the housing bubble.......now of course, it is widespread and far more severe.
Today there is no question inflation in basically everything is roaring at least 12% annually.....The gold miners have also been in their own bear market for the last 18 months, and their PEs are very reasonable at around 17 to 1 PE.... Precious metals miners typically have PEs much closer to about 25 to 30 to 1.
In effect, we have ALREADY been in a year and a half bear, and our PEs are very reasonably priced, the entire producer sector.
What will catalize gold to exceed its recent highs of 2150? When people come to the realization that the FED has no where to run. If it jacks up rates by 4 more points, the entire country and the markets will crater......It is the realization that the FED is now entering that helpless time, where before it has been all powerful. The government Hoax and financial industry Hoax is about to be revealed. ....and then gold will get tons of interest as the existing financial REGIME is revealed to be a paper tiger, against 10 percent inflation......
one more point: The Paul Volker analogy for the late 70s bear market is misguided. Back then, the country had relatively sound finances, even with the roaring inflation...........today we give away billions every week, for this or that, a congress out of control.....and owing 31 trillion..and growing by leaps and bounds........America's goose is so cooked and once people and managers start to perceive this, they will try to safeguard by moving into gold to at least keep what they have.
That is the thesis moving forward.
AGREED....good post.
I bought back in today, avg price at 26.91....quite a bit...I think we have bottomed, FINALLY
$GDX bottomed last week at 26.04. Today it made a slightly lower low at 26.03 which looks like a classic double bottom
By: CyclesFan | July 13, 2022
• $GDX bottomed last week at 26.04. Today it made a slightly lower low at 26.03 which looks like a classic double bottom and a daily cycle low on day 41, same as the last daily cycle. A close above the 10 day MA will confirm that the daily cycle low is in.

Read Full Story »»»
DiscoverGold
Gold has entered a seasonally favorable period
By: Jay Kaeppel | July 12, 2022
• Gold has held up better than stocks and bonds in 2022. That said, given current high inflation and gold's alleged reputation as a "hedge against inflation," this year's performance has been disappointing. The yellow metal has just entered a favorable seasonal period. If it is going to stage a meaningful advance in 2022, it may be "soon or never."
Read Full Story »»»
DiscoverGold
Indicators are screaming buy. It rare to see technicals that show so oversold in metals and some miners.
Gold's year-end target is $2,050 and here's why 17% price surge still possible – Wells Fargo
By: Kitco | July 12, 2022
The strong U.S. dollar has been hurting gold's price, dragging the precious metal down to 8.5-month lows as it steals its safe-haven appeal. But this is not a game-changer for gold, which can still end the year above $2,000 an ounce, according to Wells Fargo.
The U.S. dollar index rose to another 20-year high Tuesday, while the U.S. 10-year Treasury yield was at 2.921%. August gold futures were flat on the day, last trading at $1,731.60 an ounce after dropping below $1,725 overnight.
"The U.S. dollar has risen 12% since the start of the year. Almost half of that gain has come in the last month. Such big moves are quite rare, but when they do happen, commodity prices typically suffer. The reason is that most commodities are priced in U.S. dollars," Wells Fargo's real asset strategy head John LaForge said on Monday.
The broader commodities index has also suffered due to higher U.S. dollar and rising recession fears, hurting the demand outlook for industrial metals.
As the U.S. dollar gains, emerging market currencies drop, giving these countries less buying power.
"This loss of buying power can often negatively influence commodity demand and commodity prices," added LaForge. "Considering the strength in the U.S. dollar over the past month, it is not surprising that most commodity prices have been falling, gold especially."
Gold retreated 6% in June, primarily because of the U.S. dollar strength. The precious metal is one of the most sensitive commodities to the U.S. dollar price moves, according to LaForge.
Going forward, Wells Fargo is not expecting another significant move higher by the greenback, seeing it near its peak. However, for gold to move higher, it must create its own momentum.
LaForge's year-end gold price target is still at $2,050 an ounce, which he sees as reasonably achievable due to the recession narrative. He added that he would review his year-end targets soon if there is no movement.
"Gold needs its own surge of sorts — about 17% now — to hit our 2022 year-end target of $2,050 per ounce. For now, our year-end 2022 target remains unchanged, as 17% is doable. With recession around the corner, and gold being quite cheap versus most other commodities, investors may begin to buy. That said, we understand that time is running out, so we are reviewing our targets," he said.

Read Full Story »»»
DiscoverGold
Let’s see what TIPP says today at 10. Although tomorrow is the biggie for markets.
Gold into the 3rd Quarter
By: Marty Armstrong | July 11, 2022
So far, Gold has declined into the 3rd quarter as our Array has projected. Ideally a low here in the 3rd Quarter should hold. The technical support during the 3rd quarter lies at 1727.50 whereas it did drop to 1725 intraday. Only a quarterly closing below 1705 level would suggest a serious decline in possible. When we look at the Yearly level, 2023 is a Panic Cycle in gold.
The Quarterly Array clearly shows that the 3rd quarter is a target for a turning point and a Direction Change appears next quarter. The real volatility appears in the 2024 target and after 2024 we are more likely to see international war which would suggest even in Asia.
The highest yearly close remains that of 2020 and as long as this year closes below that of last year 1828, then we have a two-year correction in play. Last year's low was 1683 and a close below that would warn that we will make a new correction low early 2023, but because it is a Panic Cycle, that warns that 2023 can produce an outside reversal. That would imply an early 2023 low would be followed by a rally into year-end.
The year 2020 was 21 years up from 1999 low. That high was on target with even the standard Bullish Cycle Count. My concern is that 2023 is a turning point on our war model. You can see the large spike in 2023 and we have a Panic Cycle in 2026. We are already witnessing a sharp rise in civil unrest and uprisings to assassinations here in 2022 and next year is likely to be worse. The Democrats are desperate to allow aliens to vote to justify confiscating assets from real Americans. The Democrats have lost all sense of being American and this is all about them holding power and pushing the country into this Great Reset handing power to the United Nations. I cannot imagine a better scenario for serious violence to appear in 2023 if the Democrats rig the 2022 election again.
While the Uganda discovery has had a near-term impact, I do not see this as a long-term influence. The geopolitical events are more likely to overwhelm that issue and bringing gold to market will be much more difficult than casually suggested.
Hence, we should just follow the Reversals and other Arrays for they will incorporate everything needed to see the path ahead.
DiscoverGold
Gold dropped just because someone was covering at 1733 Spot. Not sure size of contract. It’s still Fixed.
Bear of the Day: Equinox Gold (EQX)
By: Zacks Investment Research | July 11, 2022
You would think that during a period of global turmoil that gold prices would be on the rise. War and inflation are two major reasons the gold bugs out there load the boat. That should make gold mining stocks some of the hottest commodities on Earth. In reality, that has simply not been the case. In fact, there are several gold mining stocks that are seeing earnings contractions rather than any meaningful expansion.
One such stock is today’s Bear of the Day, Equinox Gold (EQX). Equinox Gold Corp. engages in the operation, acquisition, exploration, and development of mineral properties. The company primarily explores for gold and silver deposits. Its properties include the Aurizona gold mine located in Maranhão State; the RDM gold mine located in Minas Gerais State; and Fazenda gold mine and the Santa Luz gold mine located in Bahia State, Brazil. The company also hold interests in the Mesquite gold mine and the Castle Mountain property situated in California, the United States; and the Los Filos Gold Mine located in Guerrero State, Mexico.
Revenue growth and earnings growth are not the problem here. Equinox is slated to bring in $1.21 billion in revenue this year, that’s 11.53% better than last year, while next year is forecast to grow at 15.33%. That translates to 9% EPS growth this year, nearly doubling from 24 cents to 45 cents next year.

Image Source: Zacks Investment Research
The problem is analysts moving their earnings estimates to the downside for the current year. Over the last sixty days, two analysts have cut their expectations for the current year, dropping our Zacks Consensus Estimate from 30 cents to 24 cents.
The Mining – Gold industry is in the Bottom 34% of our Zacks Industry Rank. There are other stocks in the industry which are in the good graces of our Zacks Rank. These include Zacks Rank #2 (Buy) Fury Gold Mines (FURY) and Gold Resource (GORO).
Read Full Story »»»
DiscoverGold
Gold Bottoming Short-Term
By: Jim Curry | July 10, 2022
Recapping Last week
Gold saw its high for last week made in Monday/Tuesday, here doing so with the tag of the 1815.20 figure. From there, a sharp decline was seen into late-week, with the metal dropping all the way down to a Friday low of 1726.00 - before bouncing off the same into daily/weekly close.
Gold Market, Short-Term Picture
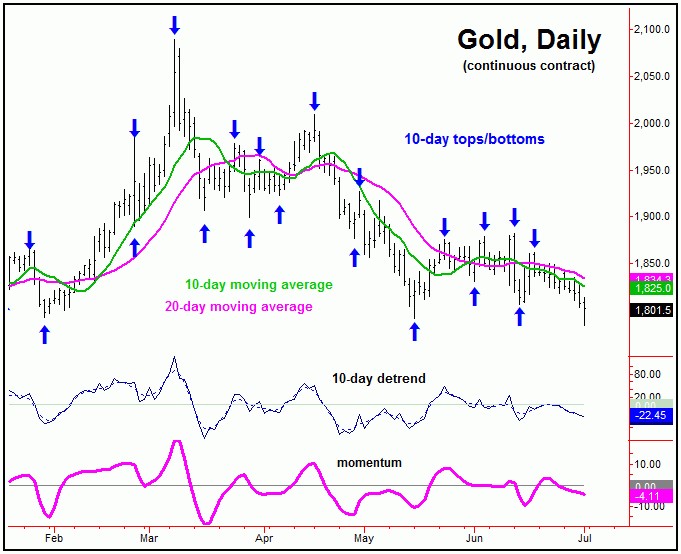
For the very near-term, the downward phase of the 10-day cycle is still deemed to be in force, with the same now at 18 trading days along from its last labeled low - and with that is into extended territory. Here again is our 10-day cycle:
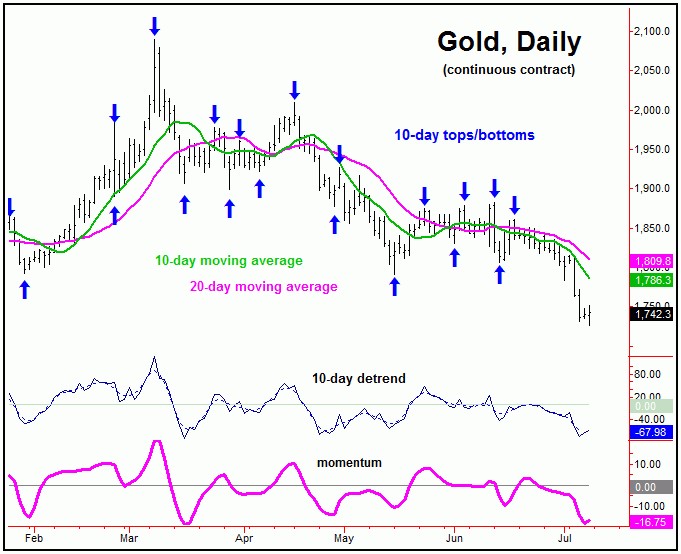
When the downward phase of one cycle moves into extended territory - which means making lower lows well past the normal average range (here, 8-12 trading days for the 10-day cycle) - we have found the very strong tendency for the next low to also mark the bottom of a cycle of 1-2 degrees higher than the one that is extending.
With the above said and noted, the cycles next up from the 10-day wave are the 20 and 34-day cycles for the Gold market. With that, the current downward phase of the 10-day cycle seems primed to bottom the larger two waves, from which a significant short-term rally could follow. The chart below shows the 34-day cycle for Gold:
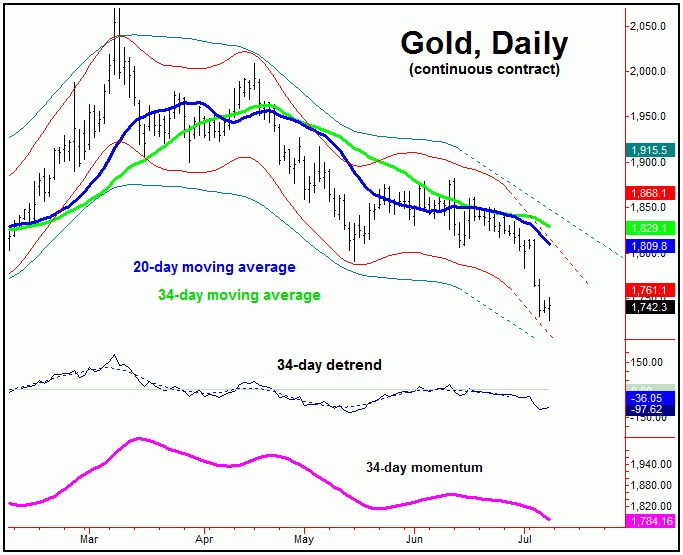
Once the next 10, 20 and 34-day combination low is in place, then, as mentioned, probabilities should favor a very nice rally in the days/weeks to follow. In terms of price, Gold has a very strong tendency (i.e., 85% odds) to revert back to a moving averages which is in line with the cycle length(s). With that, the upside potential for the next rally is back to the 20 and 34-day moving averages - with highest (34-day) average nearly 85-90 points above current price levels.
Thus, the upside potential is greater than the downside risk - at least short-term - even if the mid-term trend is to remain pointing lower into early-Autumn, which is the overall assessment. In terms of time, we have a key date of focus to mark the low for the current short-term correction, with precise details noted in our Gold Wave Trader market report.
Gold's Bigger Picture
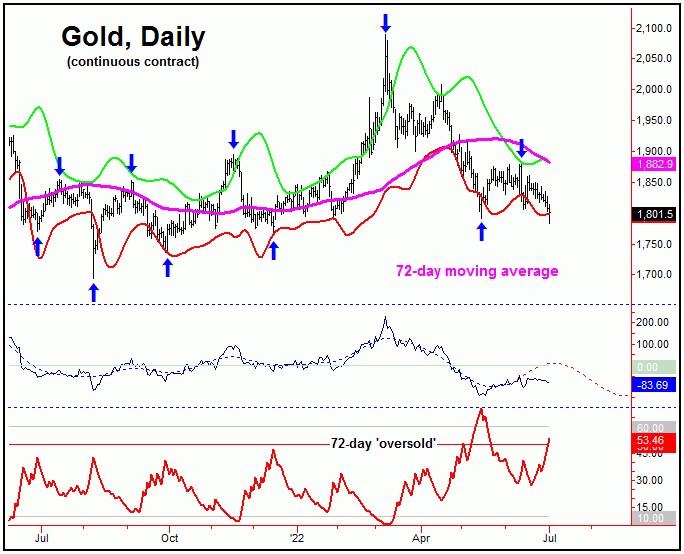
Stepping back, as noted in recent months, the last larger rally phase came from the 72-day cycle, which bottomed out with the mid-May tag of the 1791.20 figure - and topped with the June 13th tag of the 1882.50 figure. Here again is that 72-day wave:
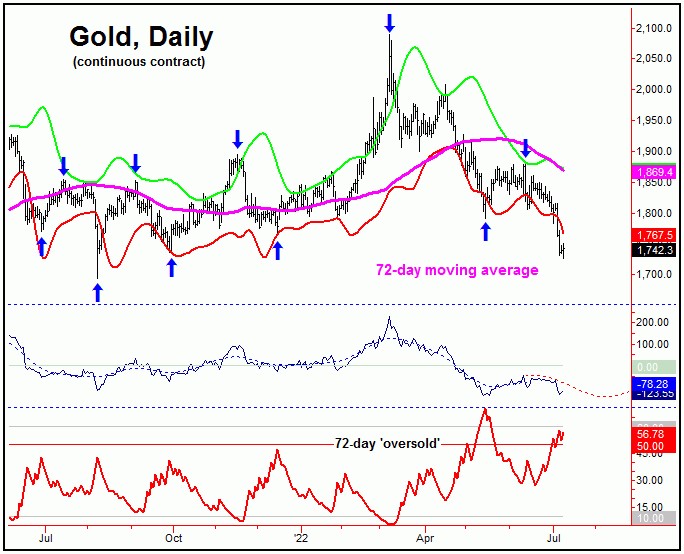
As mentioned last weekend, with the break back below the May trough of 1791.20 for Gold, our 72-day cycle had to have topped out in mid-June, and with that is heading lower into the month of August.
In terms of patterns, due to the configuration of this 72-day cycle (and the larger 310-day wave above it), the probabilities will favor the next upward phase of the smaller 10, 20 and 34-day cycles to end up as a countertrend affair - though the next rally could be very sharp, as noted earlier.
In other words, we should expect the coming rally phase with the smaller-degree cycles to hold well below the 1882.50 swing top, and with resistance to the same around 34-day moving average, plus or minus. If correct, the next short-term downward phase would be favored to take Gold back to lower lows into mid-to-late August, where the next 72-day trough is projected to form.
From a mid-to-late August bottom, the probabilities will favor another decent rally playing out into the mid-September timeframe, plus or minus, as the next upward phase of the 72-day wave unfolds.
In terms of price, that rally could see a 50-61% retracement of the larger swing down being met, before topping this wave again for a final drop into mid-to-late October, where the larger 310-day cycle is next projected to bottom-out:
As mentioned above, a 72-day cycle bottom in August should give way to a nice (countertrend) rally into September, before turning south again into what looks to be mid-to-late October of this year. From there, the odds will start to favor a rally of some 20-25% or more off the bottom playing out in the months to follow, as the next upward phase of the 310-day cycle plays out into late-Spring of 2023.
Read Full Story »»»
DiscoverGold
$GDX - Is the 40 week cycle low in? Both price and time are ideal for a low
By: CyclesFan | July 10, 2022
• $GDX - Is the 40 week cycle low in? Both price and time are ideal for a low. It bottomed at 26.05, same price it bottomed at in November 2019 and exactly 40 weeks from the September 2021, 80 week cycle low. It needs to close above 28.16 next week to confirm the low is in.

Read Full Story »»»
DiscoverGold
Deeper Pullback Has Interesting Ramifications For GLD
By: Avi Gilburt | July 7, 2022
• Following the Elliott Wave analysis:
With this deeper pullback in the complex, the GLD has now also reset itself in the same manner as we had been hoping for GDX. In fact, this now looks like a larger degree a-b-c structure for wave [iv] in GLD, rather than the complex ending diagonal scenario I had previously been tracking. What this means is that not only can I now expect a standard impulsive structure for the next rally in silver and GDX, but it seems that GLD will also join its brethren with an expectation of an impulsive rally over the coming year. This will likely allow us aggressive trading opportunities in GLD as well once we complete this larger degree corrective structure.
But, clearly, we still do not have a completed downside structure, despite the depth of the pullback thus far. While I do have enough waves now in place for GDX to be considered completed to the downside, I do not have that yet in GLD or silver. So, as I said over the weekend, we may still have several more weeks ahead before the complex finally bottoms out.
As you can see from the silver chart, I view this further downside extension as simply an extension within the wave [iii] of the 5th wave of the c-wave, and I would assume that GLD is in the same posture, as it has lower to attain until we see an a=c structure for this larger wave [iv].
For those that are aggressive in the complex, I have noted that one can begin to layer into initial long positions as we complete the 3rd wave of the c-wave, with the expectation that you can add another layer of longs as we complete the 5th wave lower low, assuming we get that. If we do not, you can always layer into the 2nd wave pullback after we see an initial 5-wave rally off a low.
But, for now, the only chart that I am on the lookout for an impulsive rally off a low is the GDX. I do not think we are ripe yet to expect one in GLD or silver. Rather, I think it is reasonable to expect another 4th and 5th wave before this c-wave completes.
In the meantime, those that are more conservative in the complex can always choose to wait until we complete the initial 5-wave rally off the lows, and then begin layering in on the 2nd wave pullback. Also, remember that you do not have to move into your full position all at once. You can always choose to buy an initial position on a 2nd wave pullback, then allow the first wave of the 3rd wave to complete, then buy a 2nd position on the 2nd wave pullback within the 3rd wave, and add a third tranche when we break out over the 1st of wave in the 3rd wave.
There is more than one way to move into this complex, and it is all dependent upon you recognizing how aggressive you want to be in the complex. Please do not allow greed to dictate this decision for you, but rather your own risk tolerance.
Overall, I still expect us to see the resumption of the bull market in the metals complex in the 2nd half of this year, and I think it will take us well into 2023.
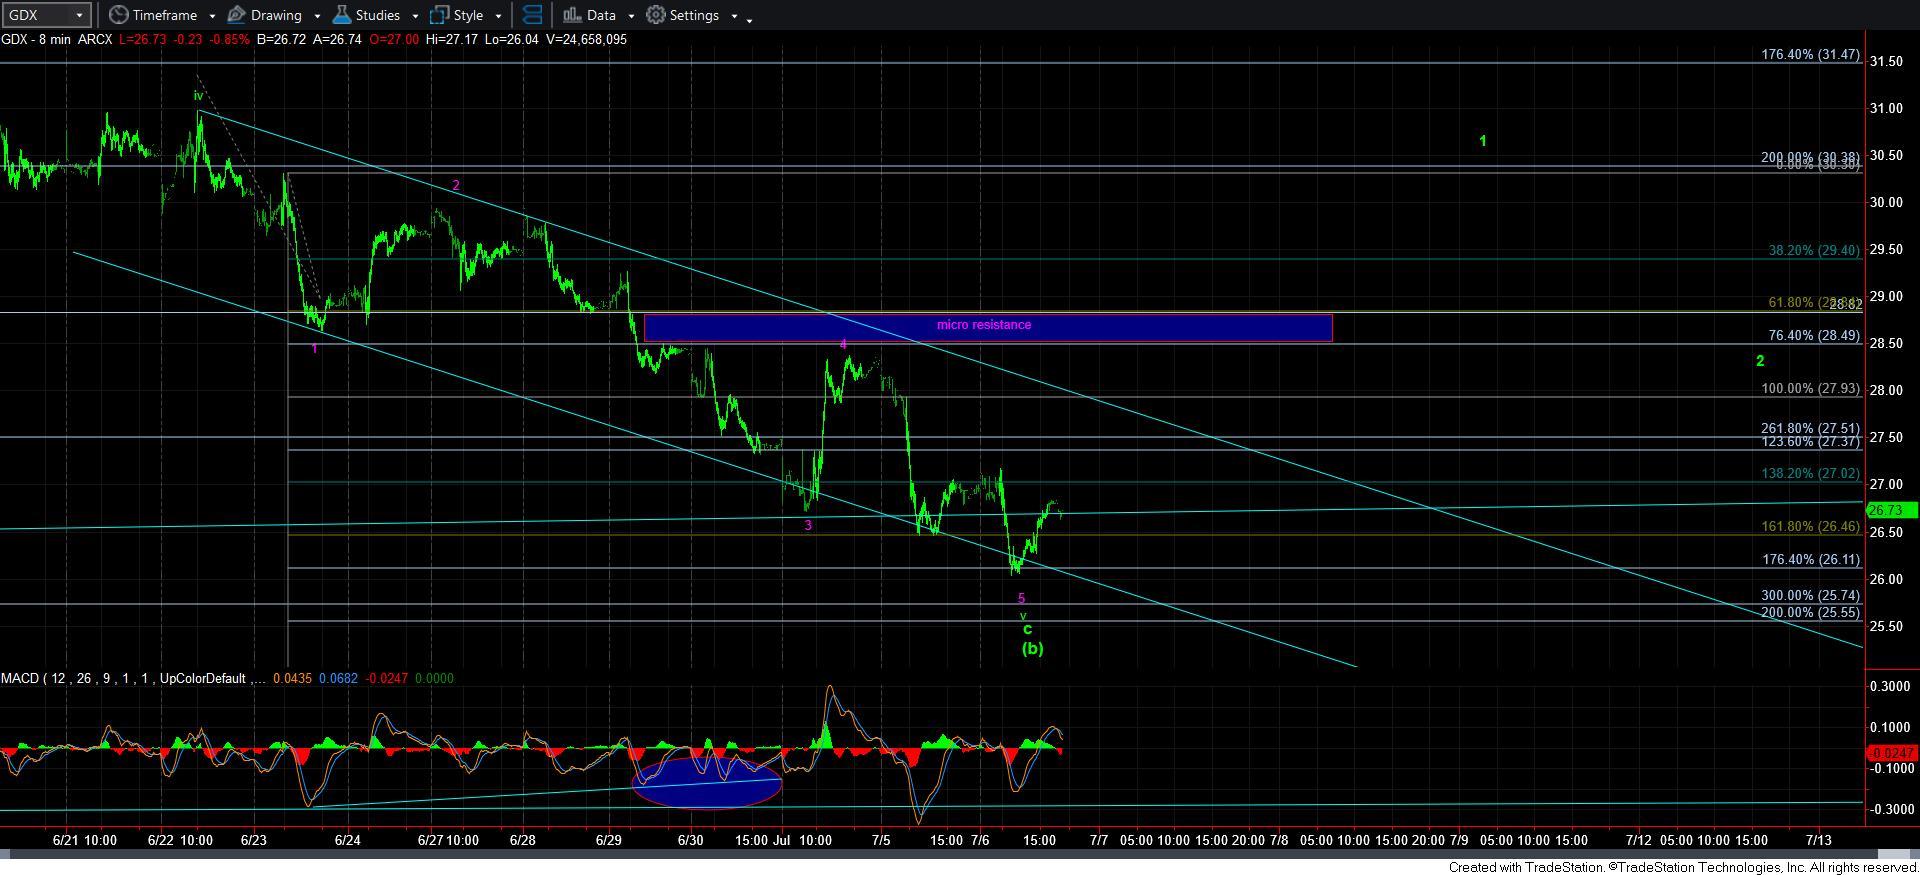
GDX8min
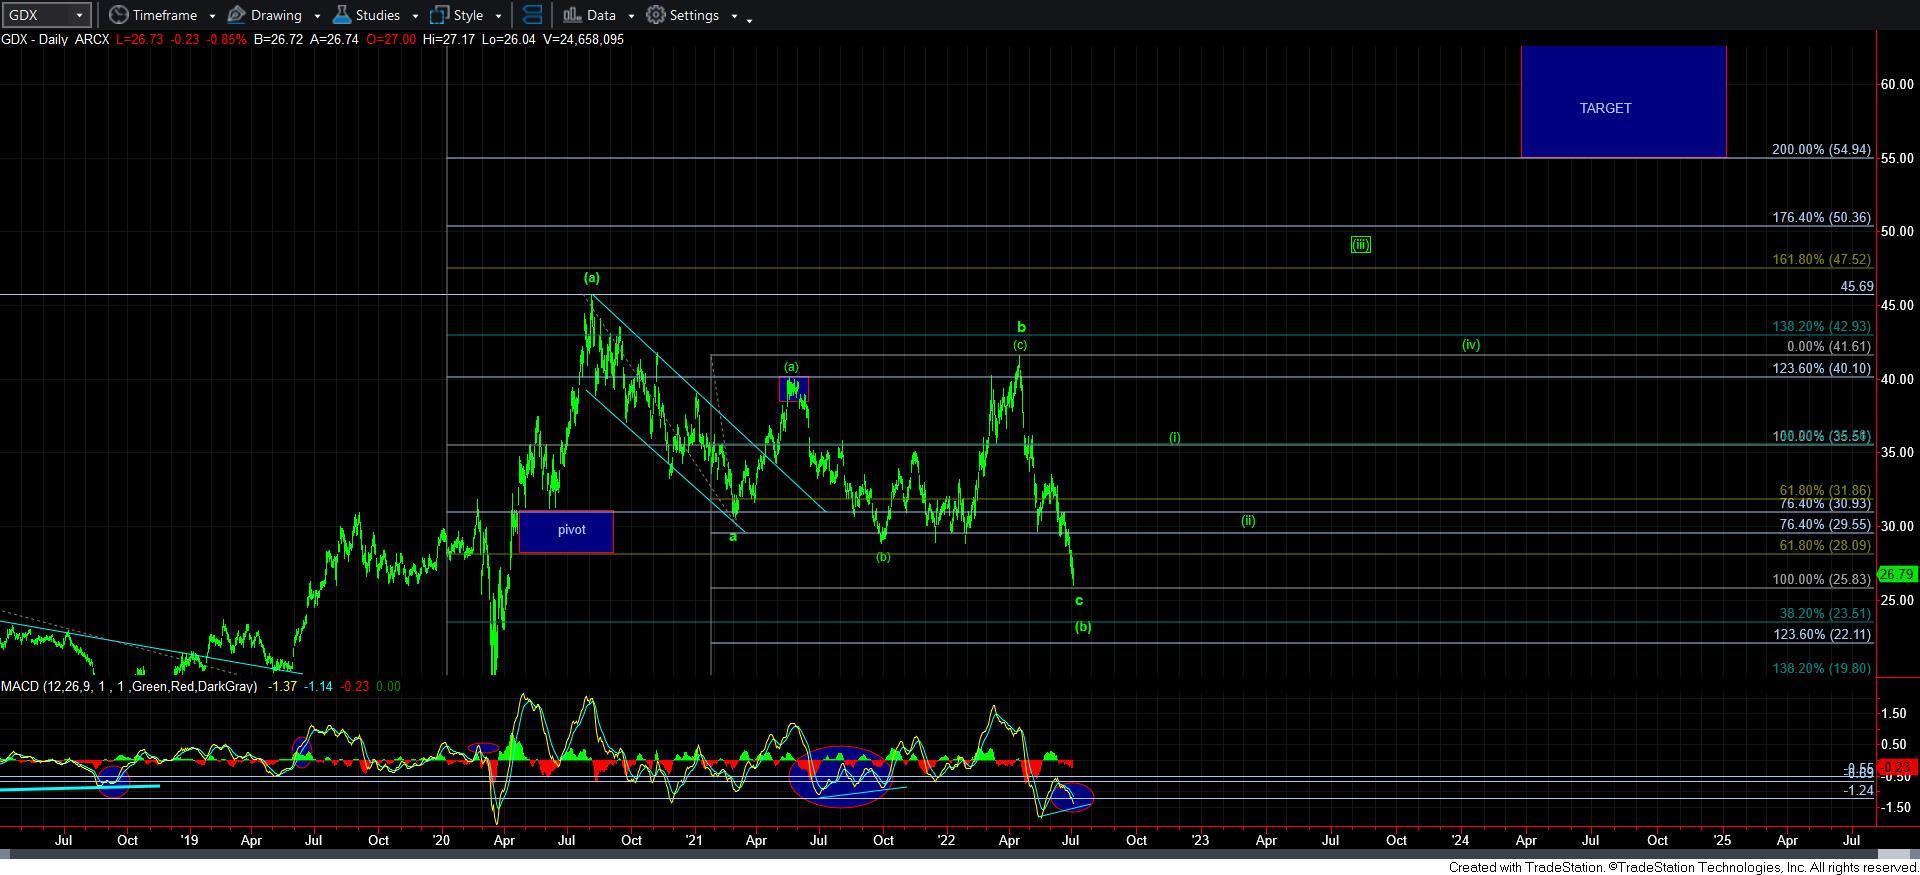
GDXdaily
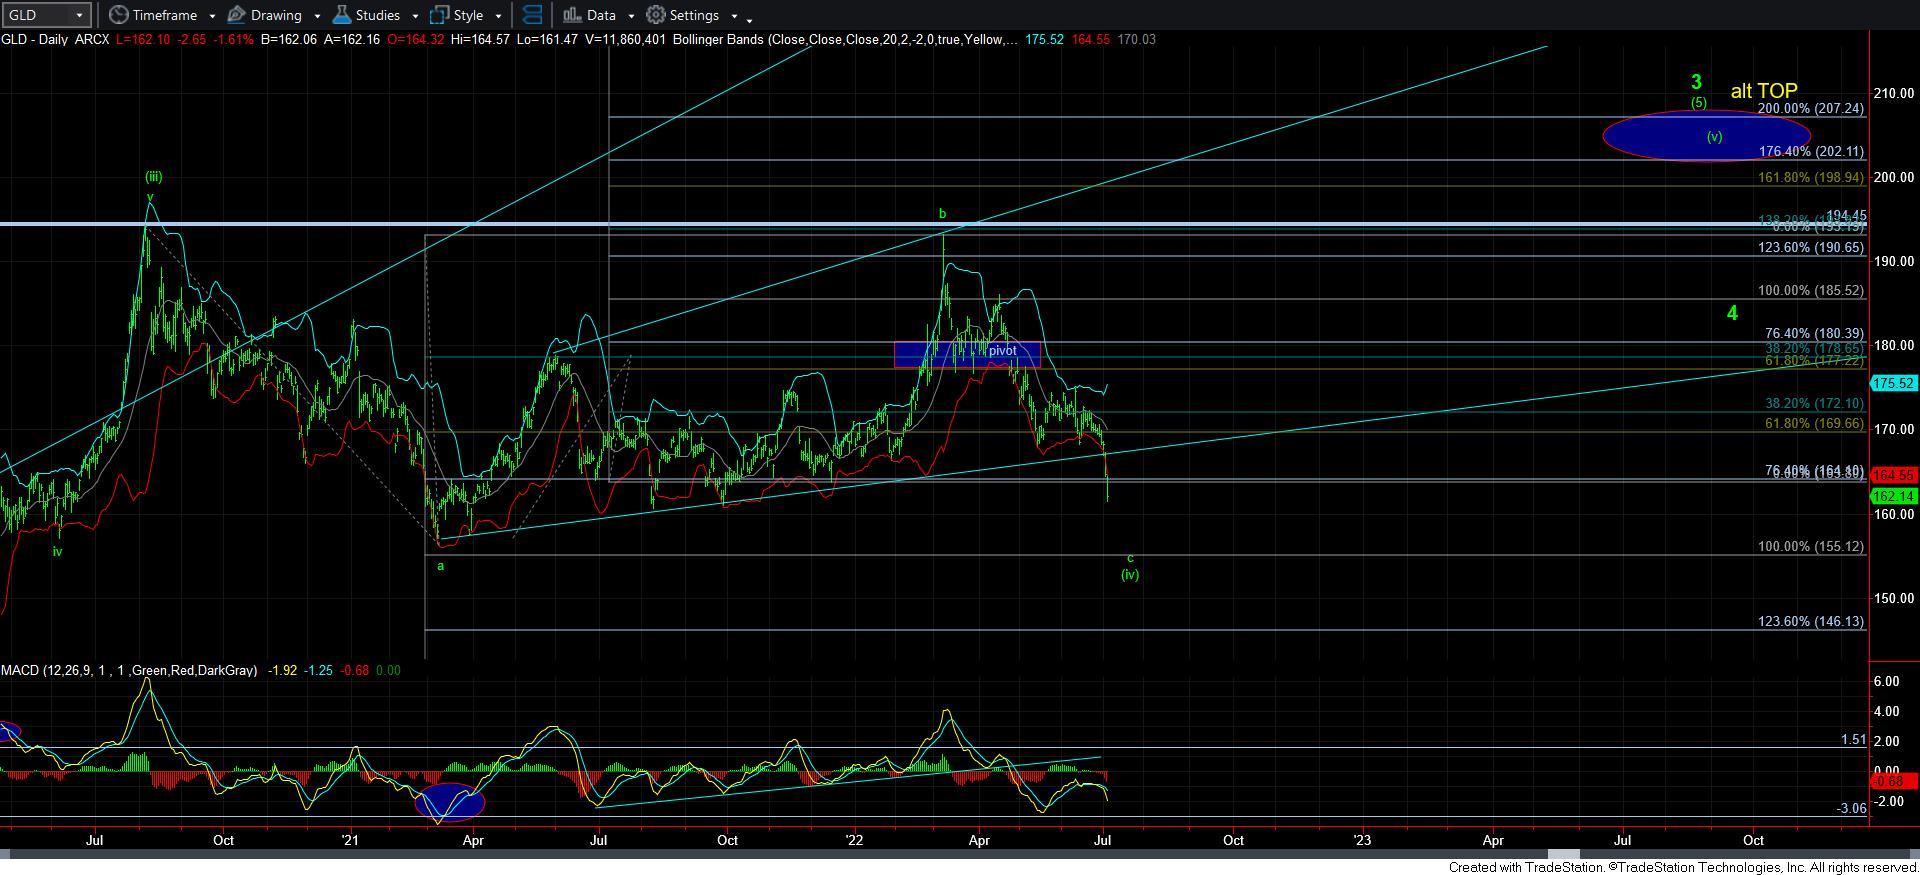
GLDdaily
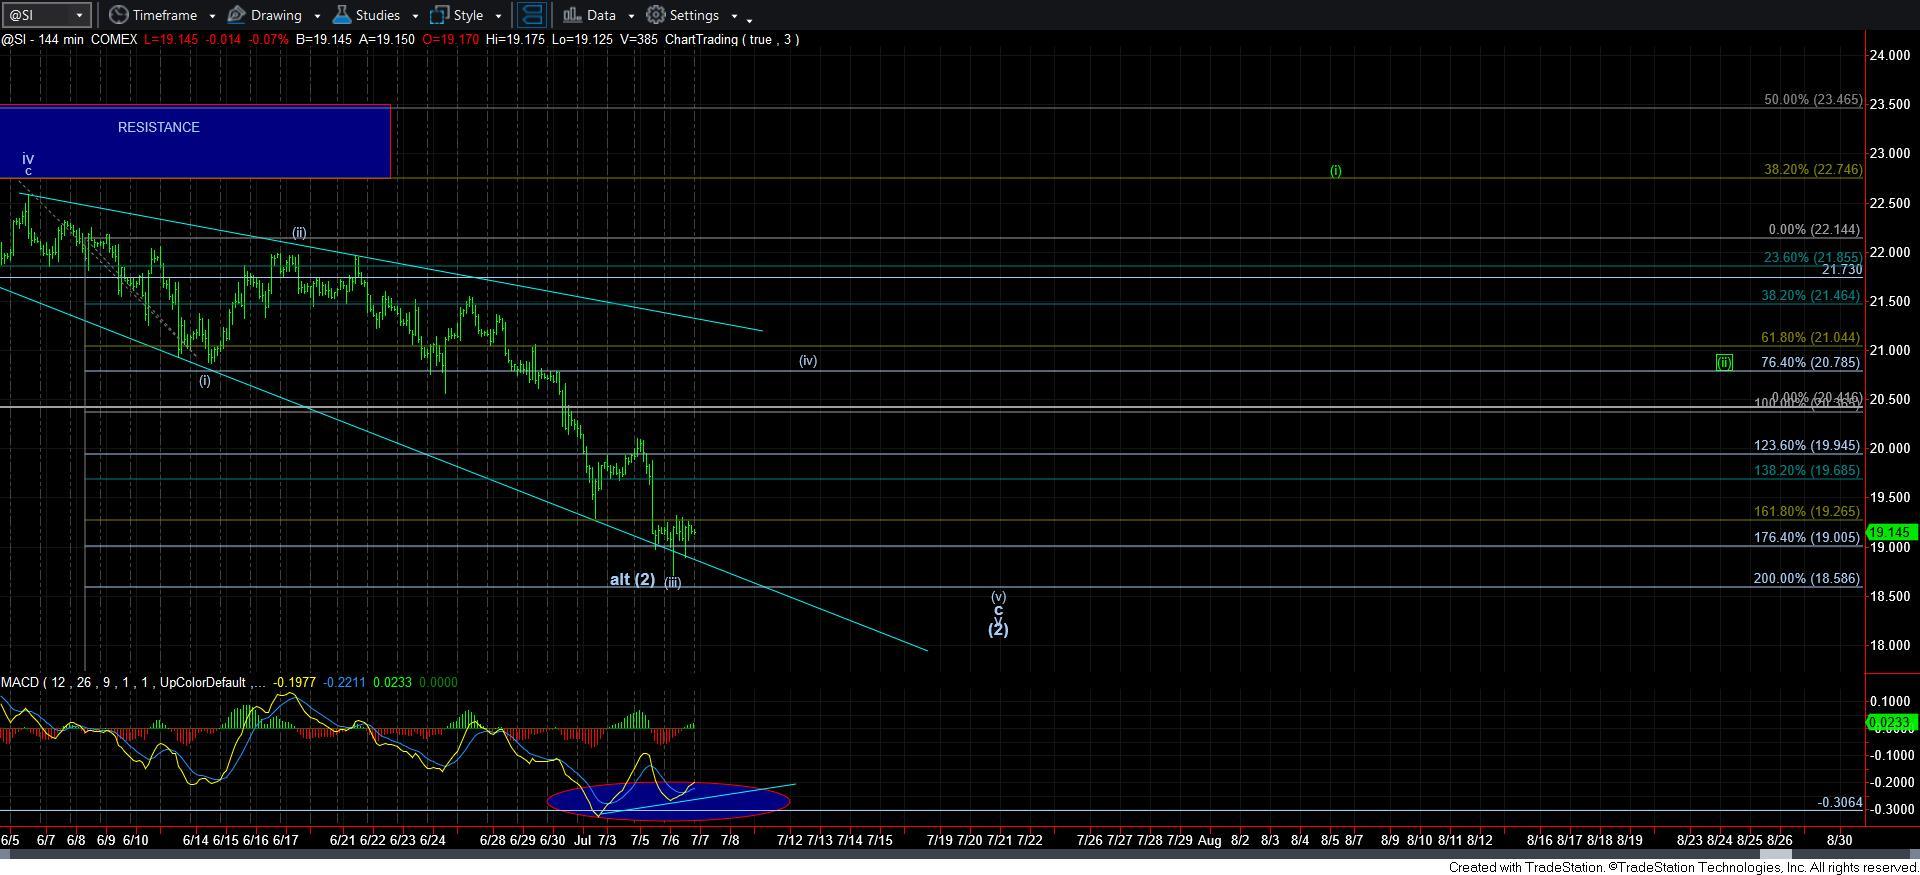
Silver-144min
Read Full Story »»»
DiscoverGold
Jack Chan: Gold Price Exclusive Update
By: Jack Chan | July 9, 2022
Our proprietary cycle indicator is down.
To public readers of our updates, our cycle indicator is one of the most effective timing tool for traders and investors. It is not perfect, because periodically the market can be more volatile and can result in short term whipsaws. But overall, the cycle indicator provides us with a clear direction how we should be speculating.
Investors
During a major buy signal, investors can accumulate positions by cost averaging at cycle bottoms, ideally when prices are at or near the daily 200ema.
During a major sell signal, investors should be hedged or in cash.
Traders
Simply cost average in at cycle bottoms when prices are at or near the daily 200ema; and cost average out at cycle tops when prices are above the daily 50ema.
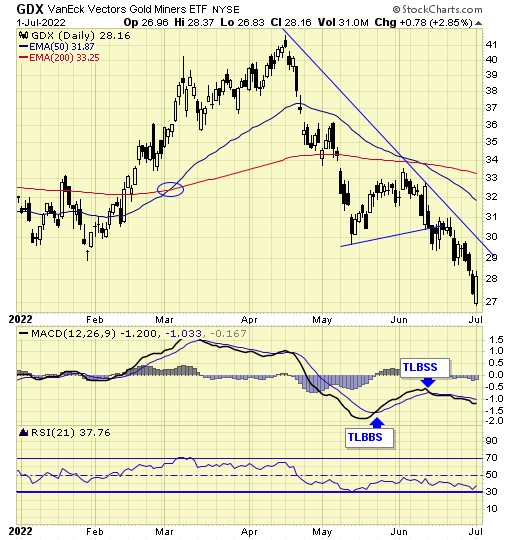
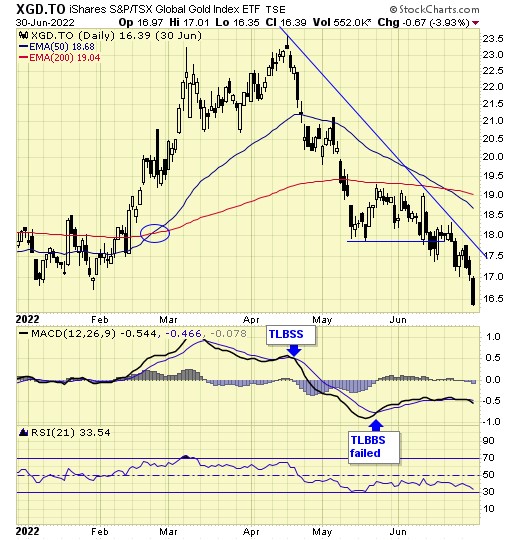
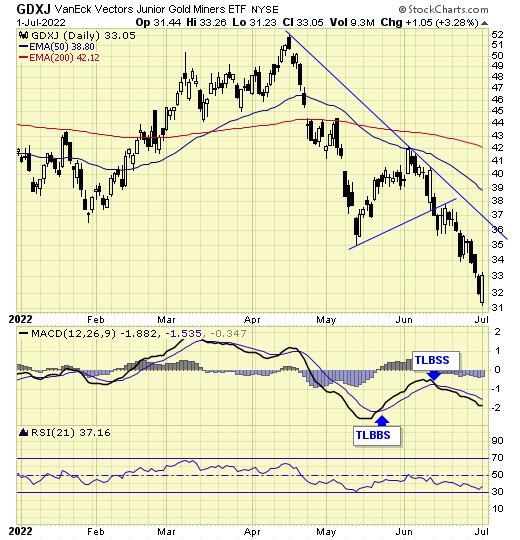
Gold sector is on long term SELL signal as the recent buy signal has failed.
The correction since 2020 drags on.
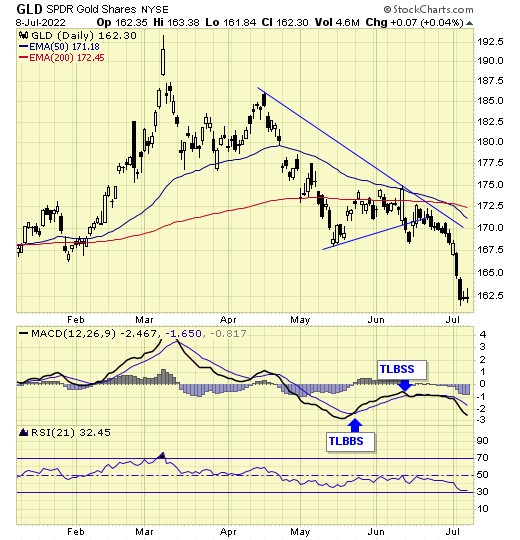
GLD is on short term sell signal.
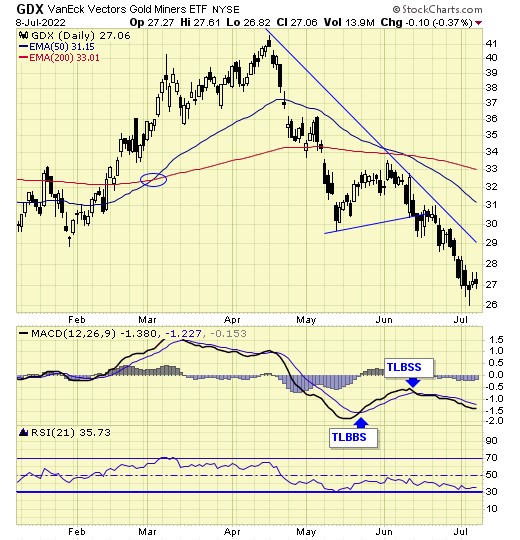
GDX is on short term sell signal.
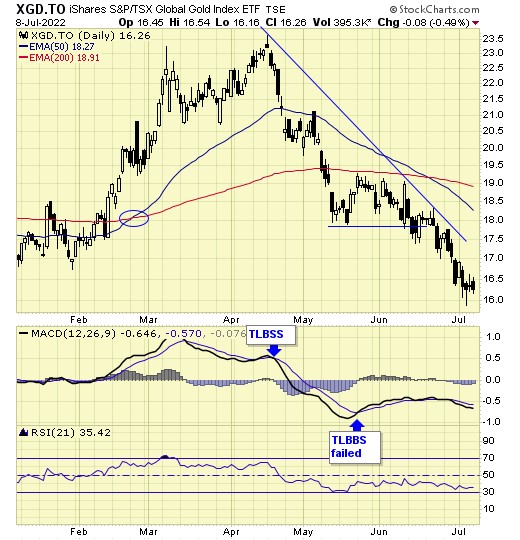
XGD.to is on short term sell signal.
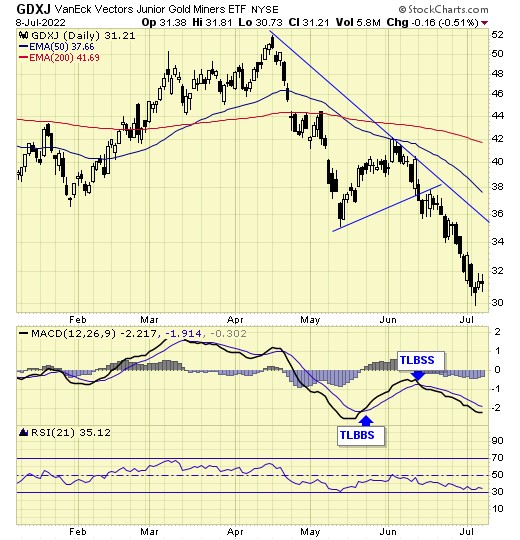
GDXJ is on short term sell signal.
Analysis
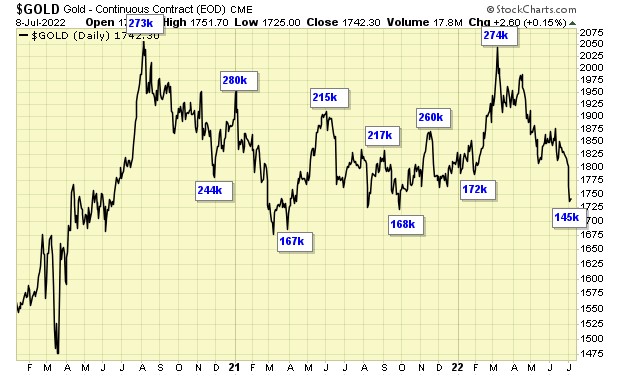
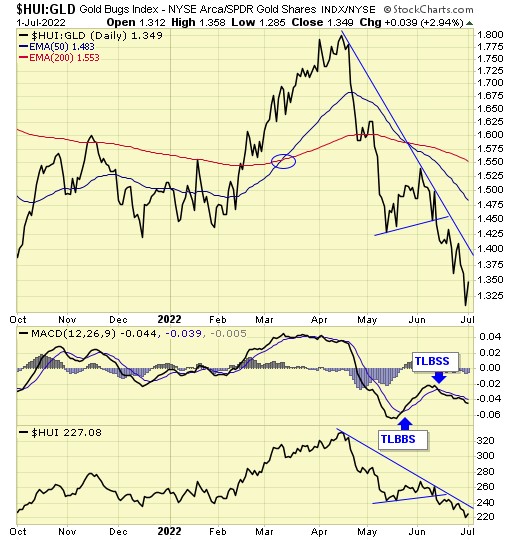
Speculation now at the lowest level in two years.
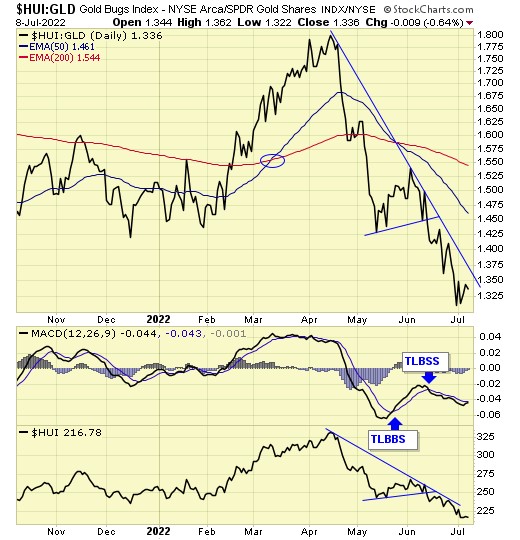
Our ratio is on sell signal.
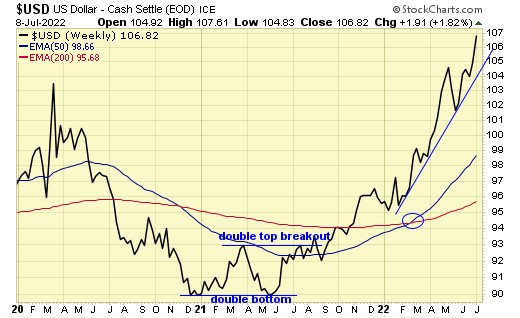
Trend is up for the dollar.
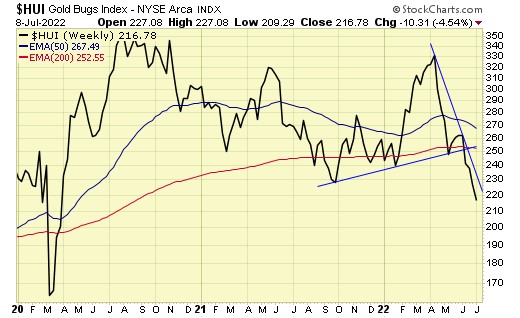
Trend is down for gold stocks.

Trend is down for gold also.
Downside target is the 200ema support.
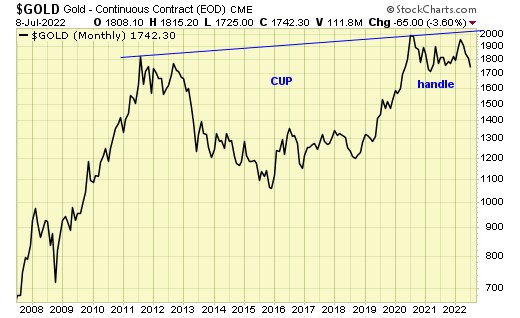
The decade long cup with handle remains in progress.
Summary
Long term – on SELL signal.
Short term – on sell signals.
Gold sector cycle is down.
$$$ We are now holding trading positions as no core positions should be held during a long term sell signal.
Read Full Story »»»
DiscoverGold
Gold & Gold Stocks Weeks From Historic Bottom
By: Jordan Roy-Byrne | July 9, 2022
Gold and Gold stocks have fallen to levels from which we should see excellent returns over the next 12 months and potentially spectacular over the long term. However, that does not mean a bottom and reversal are imminent.
Concerning the gold stocks, the indicators are extremely oversold and have reached levels similar to the 2020 and 2018 bottoms.
You will rarely hear a technician say this, but whether markets make an oversold bounce or the actual bottom depends on fundamentals. Concerning precious metals, Fed policy changes have been quite significant.
In late 2018, Gold and gold stocks rebounded and sustained gains around the time of the Fed’s last interest rate hike. The Gold breakout in 2019 occurred when the Fed cut interest rates for the first time in over a decade.
The Covid crash low occurred as the Fed cut rates to 0 and the market sensed massive fiscal stimulus and transfer payments. In 2008, the Fed cut rates to 0 a month before the October bottom.
I could go on but you get the point.
Gold and gold stocks are struggling because the market continues to anticipate rate hikes through the end of the year. When the market and economic outlook force the Fed to stop, Gold and gold stocks will rebound violently, if they remain extremely oversold as they are now.
Before we get to the breadth indicators, let us focus on price.
The weekly candle charts for GDX and GDXJ are below.
After a nasty 12 weeks of decline, the miners are sporting bullish hammers. They could rally for at least a few weeks.
The red lines show initial resistance targets, while the blue lines show strong support targets if this week’s lows did not mark the bottom.
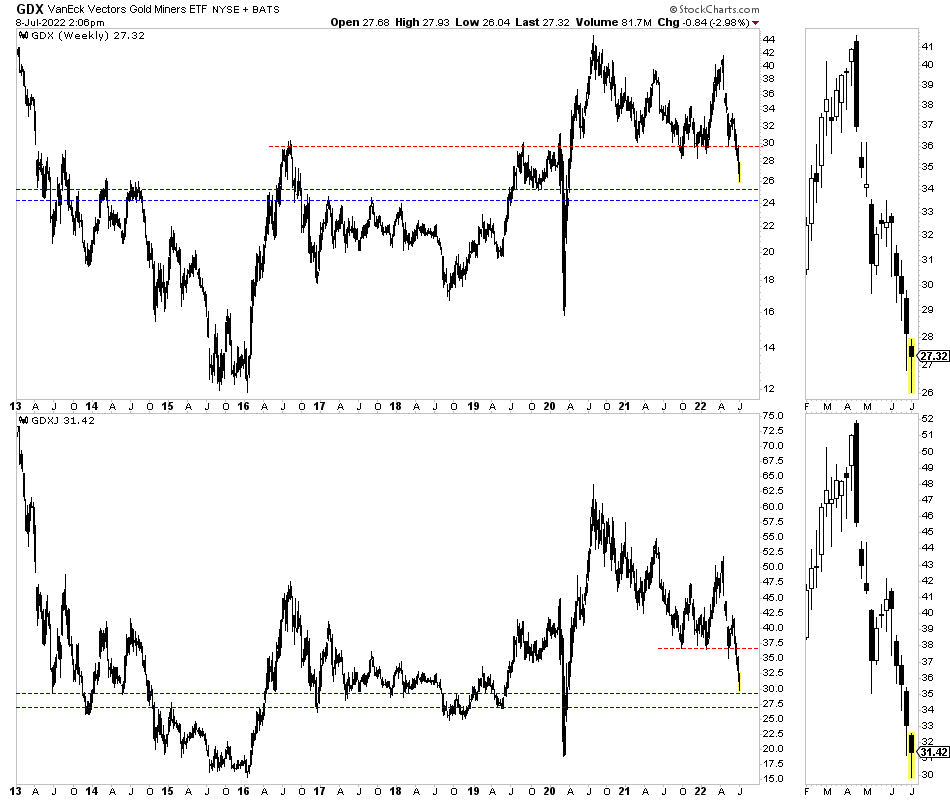
A few days ago, 58% of GDXJ stocks made a new 52-week low. That is tied with the highest single-day mark of the past seven years.
Also, the percentage of GDXJ stocks trading above the 200-day moving average (smoothed by a 20-day average) is at the second-lowest level of the past seven years.
Also, 59% of GDX stocks made a new 52-week low a few days ago. That was in line with the August 2018 and March 2020 lows data.
Meanwhile, Gold has broken below support at $1780 and $1750.
It has key support at the 40-month moving average ($1720) and a confluence of support around the 2021 lows at $1675.
Technicals and sentiment indicators (which are not yet extreme) suggest Gold could easily fall and test those support levels. Perhaps that would coincide with a final selloff in the gold stocks.
The turning point for precious metals will align with or begin as the market senses a shift in Fed policy. Whether July or September is the last rate hike, I expect the turn to be in August or September.
Read Full Story »»»
DiscoverGold
COT - Commitments of Traders in Metals Futures Market Reports
By: Software North | July 8, 2022
Gold

Silver

Read Full Story »»»
DiscoverGold
NY Gold Futures »» Weekly Summary Analysis
By: Marty Armstrong | July 9, 2022
The NY Gold Futures closing today at 174230 is immediately trading down about 4.71% for the year from last year's settlement of 182860. Caution is now required for this market is starting to suggest it will deline further on a monthly level. Up to this moment in time, this market has been rising for this month going into July reflecting that this has been only still a bullish reactionary trend. As we stand right now, this market has made a new low breaking beneath the previous month's low reaching thus far 172500 while it's even trading beneath last month's low of 180250.
Up to now, we still have only a 1 month reaction rally from the low established during May. We must exceed the 3 month mark in order to imply a trend is developing.
ECONOMIC CONFIDENCE MODEL CORRELATION
Here in NY Gold Futures, we do find that this particular market has correlated with our Economic Confidence Model in the past. The Last turning point on the ECM cycle low to line up with this market was 2015. The Last turning point on the ECM cycle high to line up with this market was 2020 and 2011 and 1996.
MARKET OVERVIEW
NEAR-TERM OUTLOOK
The historical perspective in the NY Gold Futures included a rally from 2015 moving into a major high for 2020, the market has been consolidating since the major high with the last significant reaction low established back in 2015. The market is still holding above last year's low but is trading rather weak at this moment. The last Yearly Reversal to be elected was a Bullish at the close of 2020.
This market remains in a positive position on the weekly to yearly levels of our indicating models.
Focusing on our perspective using the indicating ranges on the Daily level in the NY Gold Futures, this market remains in a bearish position at this time with the overhead resistance beginning at 176300.
On the weekly level, the last important high was established the week of June 13th at 188250, which was up 4 weeks from the low made back during the week of May 16th. We have been generally trading down for the past 3 weeks, which has been a very dramatic move of 8.366%.
Looking at this from a broader perspective, this last rally into the week of June 13th reaching 188250 failed to exceed the previous high of 200300 made back during the week of April 18th. That rally amounted to only four weeks. Subsequently, the market has breached that low of the week of May 16th and has closed beneath it warning the market is weak. Right now, the market is below momentum on our weekly models casting a bearish cloud over the price action.
INTERMEDIATE-TERM OUTLOOK
YEARLY MOMENTUM MODEL INDICATOR
Our Momentum Models are declining at this time with the previous high made 2020 while the last low formed on 2021. However, this market has rallied in price with the last cyclical high formed on 2020 and thus we have a divergence warning that this market is starting to run out of strength on the upside.
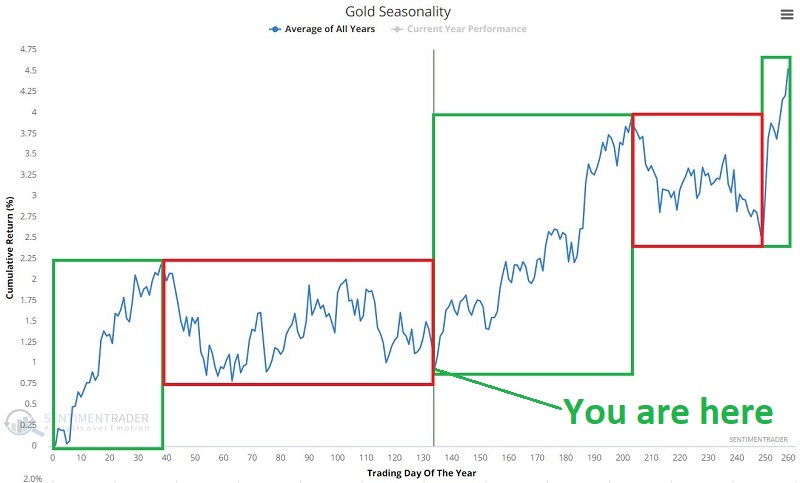
DiscoverGold Gold Seasonality
By: Nautilus Research | July 8, 2022
• Gold Seasonality.

Read Full Story »»»
DiscoverGold
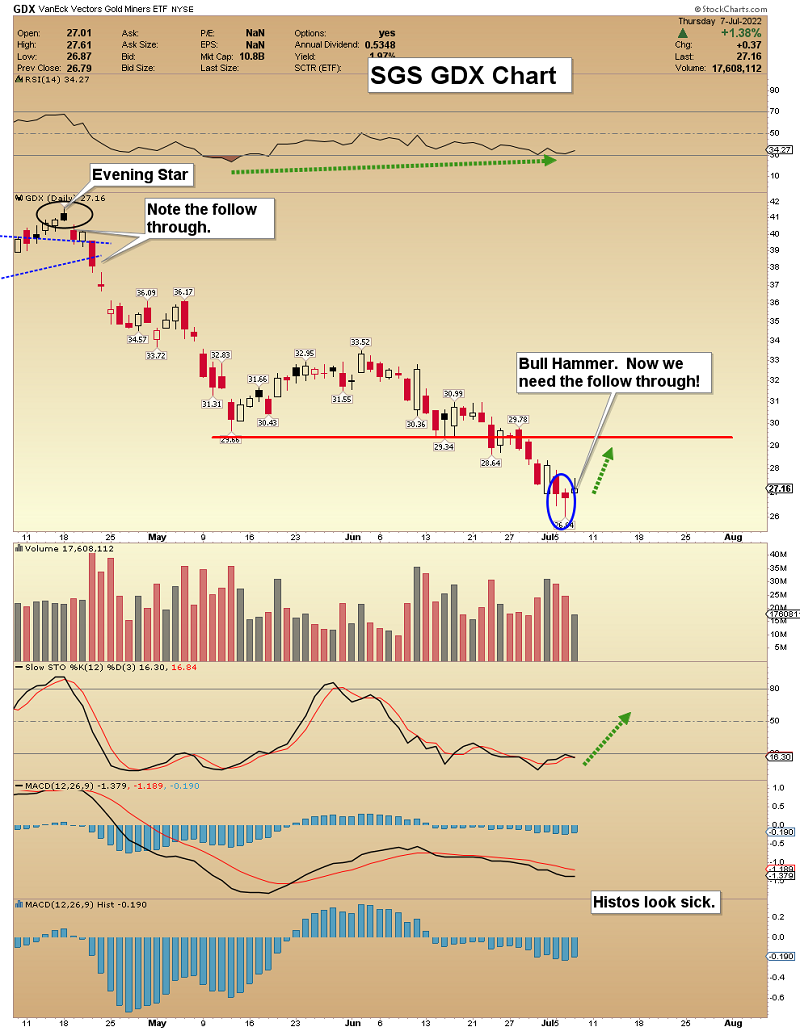
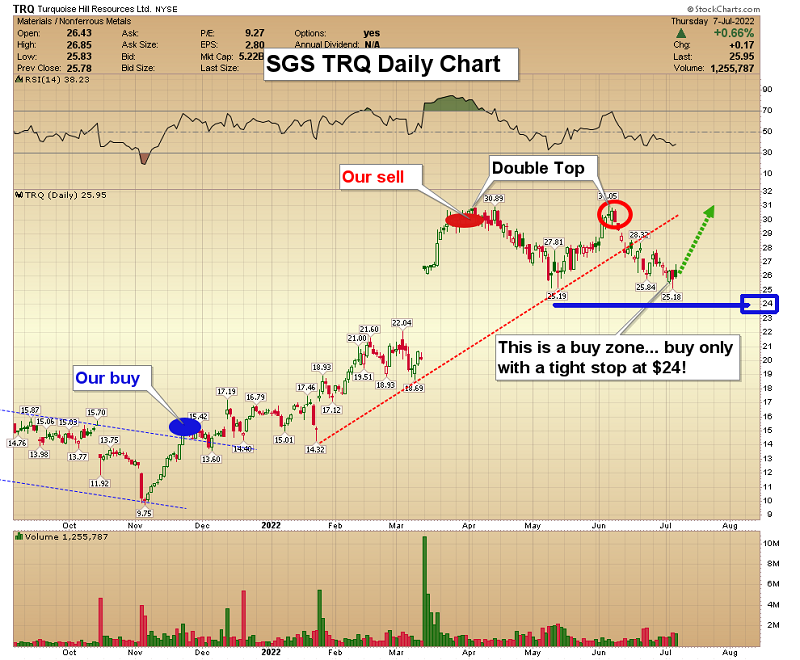
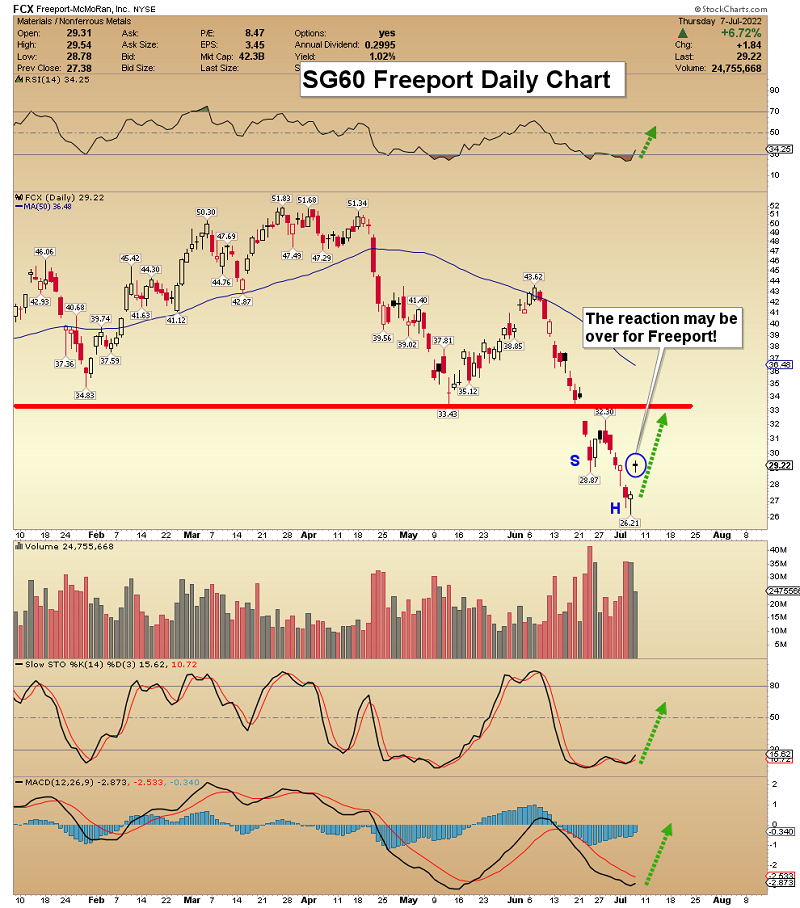
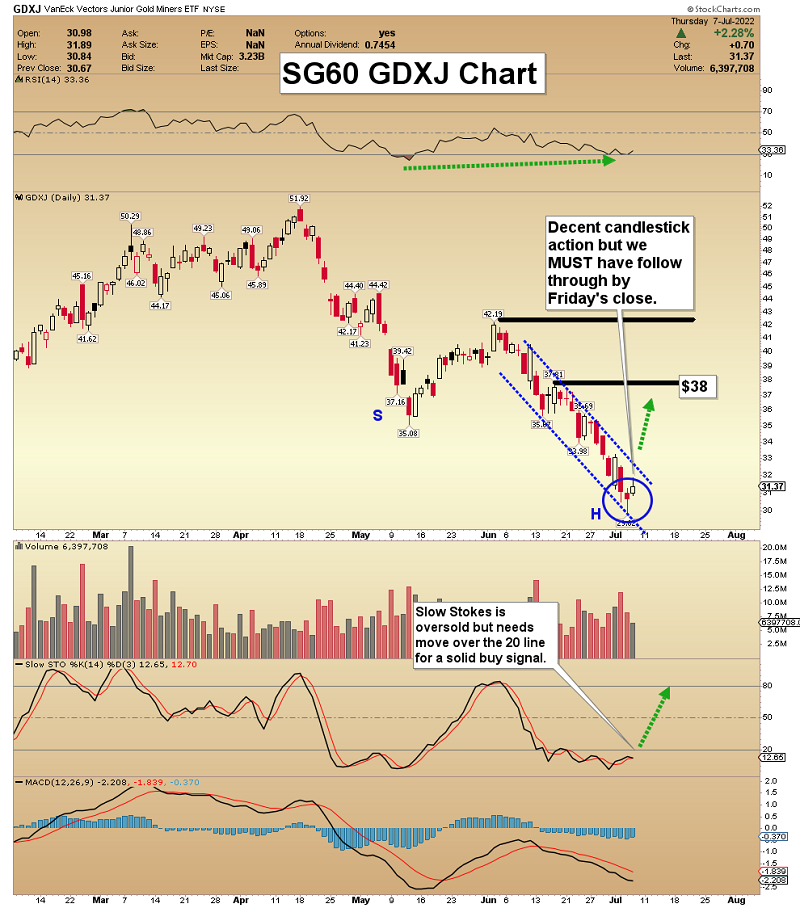
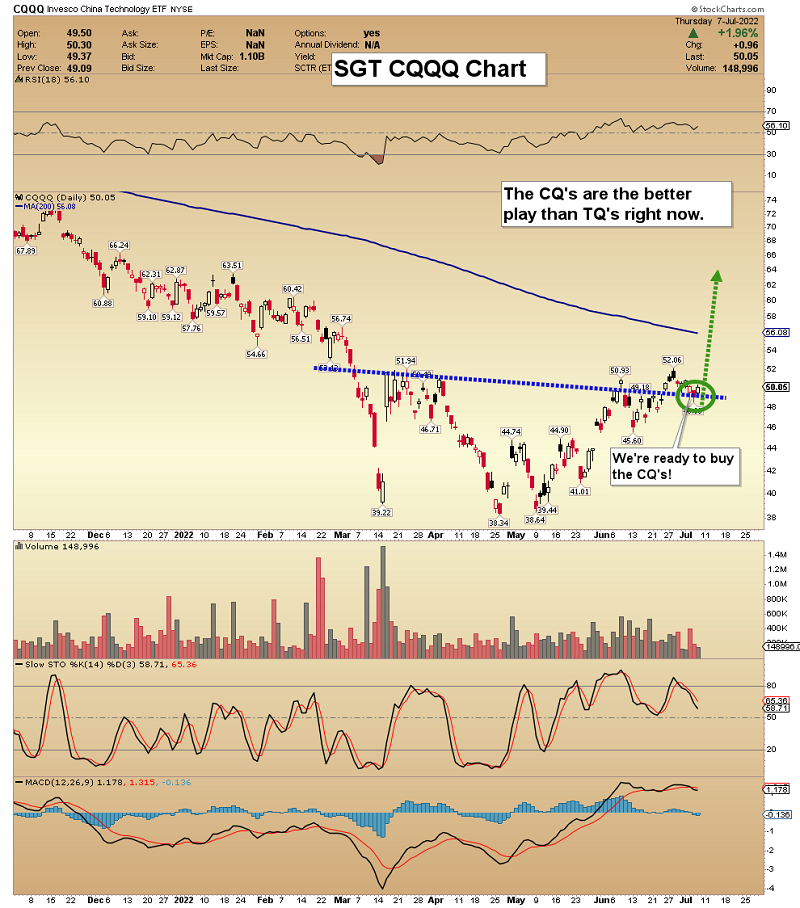
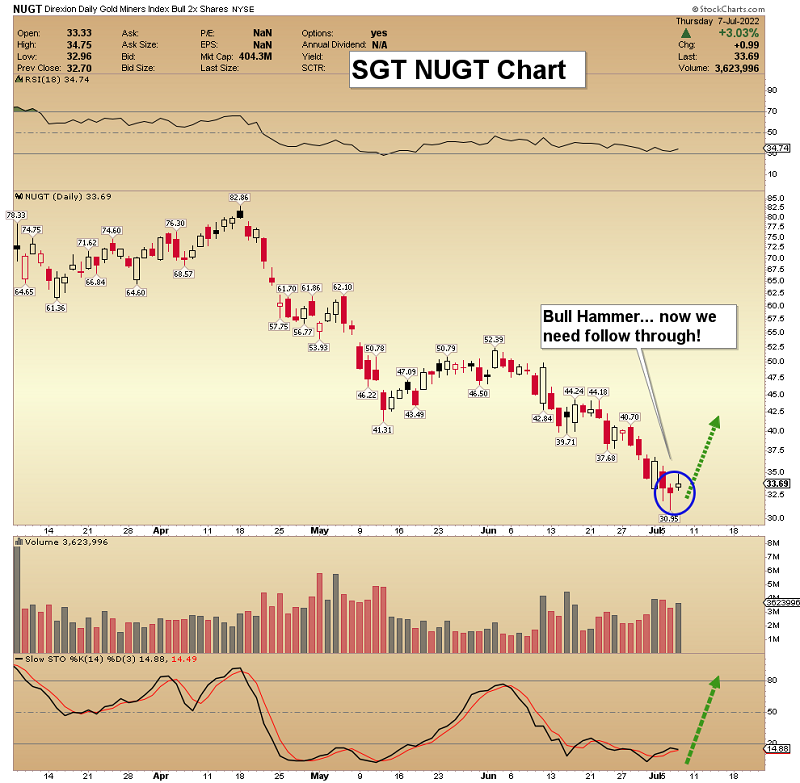
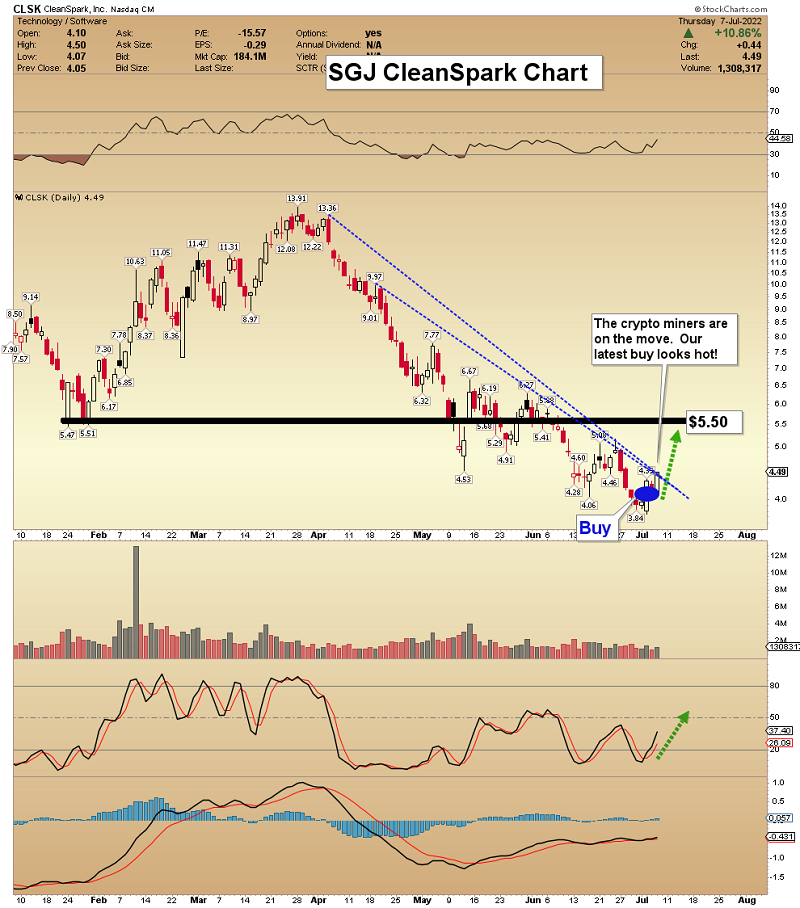
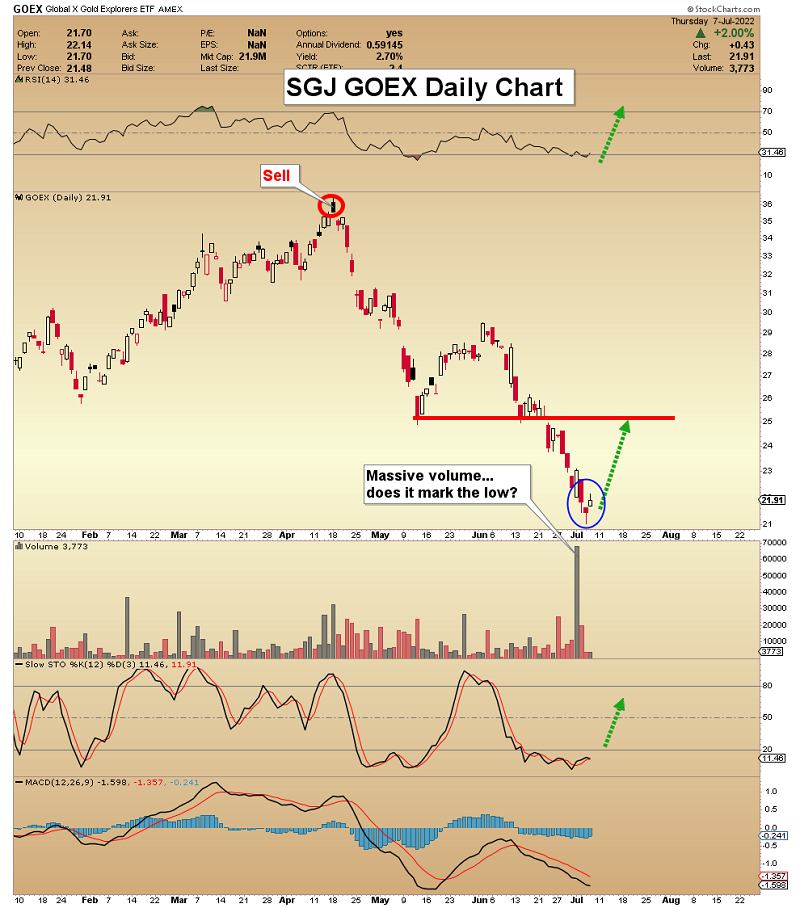
Gold Stocks: Jobs Report & Key Candlesticks
By: Morris Hubbartt | July 8, 2022
Super Force Signals (SFS) is being rebranded as Super Gold Signals (SGS at https://supergoldsignals.com), to reflect the growing global importance of gold.
SG60 Key Charts, Signals, & Video Analysis
SGT Key Charts, Signals, & Video Analysis
SGJ Key Charts, Signals, & Video Analysis
Read Full Story »»»
DiscoverGold
What Needs to Happen for the GDXJ to Hit New Lows?
By: Przemyslaw Radomski | July 8, 2022
• Although the general stock market has risen, this trend may soon reverse. Since it often moves along with gold stocks, junior miners can face a fall too.
Let the S&P 500 Be a Clue
Mining stocks declined significantly this week, but they haven’t severely underperformed gold. There is a good reason for it – the general stock market moved higher recently.
What would have to happen for the mining stocks (in particular, junior mining stocks) to decline in a more profound manner and slide well below $30 (in the GDXJ)? For example, the trend in the stock market could reverse.
Guess what – that’s exactly what’s likely to happen based on what’s going on in the S&P 500 chart.

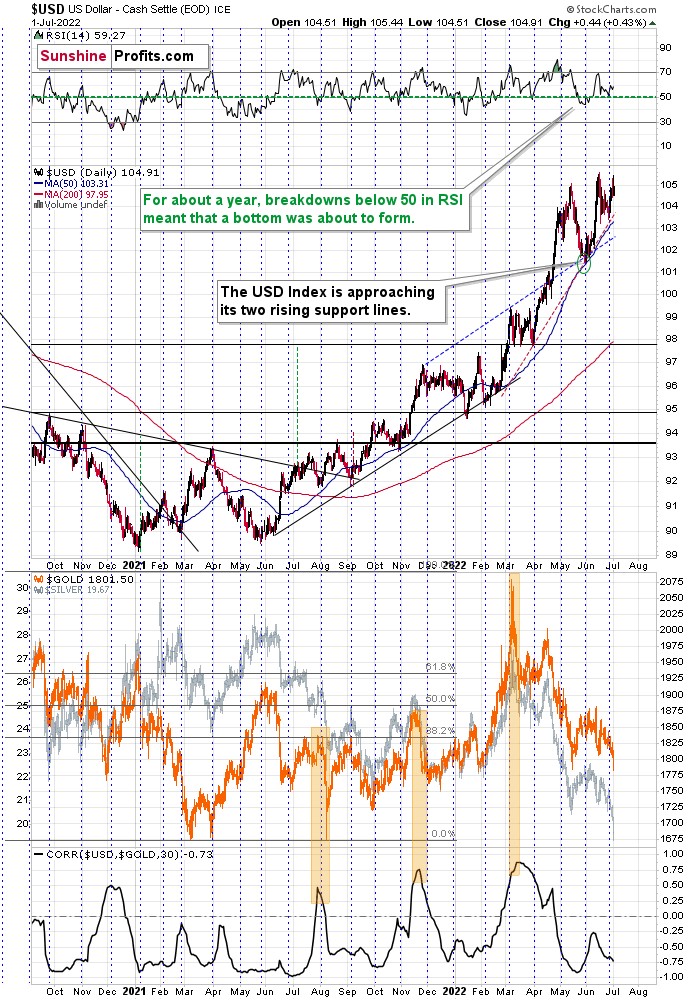
The S&P 500 just moved to the upper border of its trading channel, which means that it’s now likely to reverse its course. This scenario is supported by the action in the RSI indicator.
As you can see on the above chart (marked with red arrows), when the RSI moved to or close to 50 in recent months, it meant that the corrective rally was either over or about to end. The RSI just moved to 50.76.
In all recent cases, the declines that followed this RSI-close-to-50 sell signal were sharp. All of them, except the last one, were quite significant from the short-term point of view. In fact, if the S&P 500 does exactly what it did after the previous signals, it will likely move close to the 3,500 level, which has been my target area for some time now. That’s where we have the 50% Fibonacci retracement based on the entire 2020-2022 rally.
Most interestingly, though, such a decline would likely have a devastating effect on the prices of mining stocks (especially junior mining stocks) and silver. There might be some impact on gold, too.
The Rise of the Dollar
The above would also be in tune with an extra rally in the USD Index. After all, less competitive exports are not that favorable for the U.S. economy.

Speaking of the USD Index, after invalidating the breakout below the multi-year head-and-shoulders pattern, the USDX was poised to soar, just like I’ve been expecting it to do for more than a year, and that’s exactly what it did. And now it’s as high as it hasn’t been that high in 20 years!
The USD Index just broke above the previous highs, and it did so after correcting, which means that it just completed a massively bullish cup-and-handle pattern. This pattern is likely to send the USD Index much higher. However, since no market moves in a straight line, either up or down, let’s see where we have potential resistance levels.
The nearest resistance is provided by the 2002 high, and it’s slightly above the 108 level.
This means that the USD Index could easily rally by another 1 index point or so, which in turn could easily trigger another profound decline in gold.
This could happen this week (or early next week), so please stay tuned.
Whether this triggers a massive decline in junior miners or not is a different matter. It might, but it also might trigger a move back to this week’s intraday lows or just somewhat below them, and then miners could show strength. Either of the above – if accompanied by gold’s move to/below $1,700 – would serve as a signal for closing one’s current short positions and taking our massive profits off the table.
If the general stock market declines along with a rally in the USD Index, then the scenario in which the junior miners decline profoundly will likely be realized. I think it’s the more likely scenario here.
Do I plan to enter a long position once I close the current short position? Yes (just like I did at the end of the previous big correction), but only if gold declines below $1,700. If it doesn’t, and it moves higher right now, then I most likely won’t make any adjustments to the current short position. Remember – it’s not the point to catch each and every price move – in fact, it’s impossible to do so. The point is to select those trades that have the best risk-to-reward ratio and then enter trades while waiting out (i.e., ignoring) possible trades that don’t have a very favorable risk-to-reward ratio.
Read Full Story »»»
DiscoverGold
Gold is 'undeservedly' cheap relative to equities as inflation sticks around - Felder Report
By: Neils Christensen | July 6, 2022
Expectations that the Federal Reserve will continue to aggressively raise interest rates at the end of the month have sent the gold market plunging lower, with prices testing long-term support at $1,730 an ounce.
However, one market analyst is warning that the Fed’s fight against inflation could prove futile and be good for gold prices.
In a report published Tuesday, Jesse Felder, creator of the Felder Report, said that markets anticipate that inflation pressures will quickly ease through the rest of the year. However, he added that historically inflation pressure could take longer than expected to cool.
He added that in this environment, gold continues to shine brighter than equity markets.
"If inflation proves more durable than markets currently discount, the recent volatility may be merely prelude to a more significant repricing across a number of asset classes," he said in his latest report.
"In fact, the level of CPI today already suggests that gold, relative to equities, maybe just about as undeservedly cheap as it was a half-century ago, the last time inflation really became a problem. And if inflation remains elevated, gold prices could have a terrific amount of upside ahead, especially relative to stock prices," he added.
The comments come as gold prices have dropped 4% in the last two days. August gold futures last traded at $1,738.70 an ounce.
According to some analysts, the gold market is struggling as markets continue to price in aggressive interest rate hikes from the Federal Reserve.
The minutes of the U.S. central bank’s June monetary policy meeting didn’t reveal any new surprises or shift market expectations.
However, the Federal Reserve did signal that it is prepared to do what it takes to get inflation back down to 2% even as it sees downside risks to the economy.
"Many participants judged that a significant risk now facing the Committee was that elevated inflation could become entrenched if the public began to question the resolve of the Committee to adjust the stance of policy as warranted. On this matter, participants stressed that appropriate firming of monetary policy, together with clear and effective communications, would be essential in restoring price stability," the minutes said.
Read Full Story »»»
DiscoverGold
The Ord Oracle: GDX Update
By: Tim Ord | July 6, 2022
SPX Monitoring Purposes: Long SPX on 5/31/22 at 4151.09.
Monitoring Purposes GOLD: Long GDX on 10/9/20 at 40.78.
Long Term SPX Monitor Purposes: Neutral.
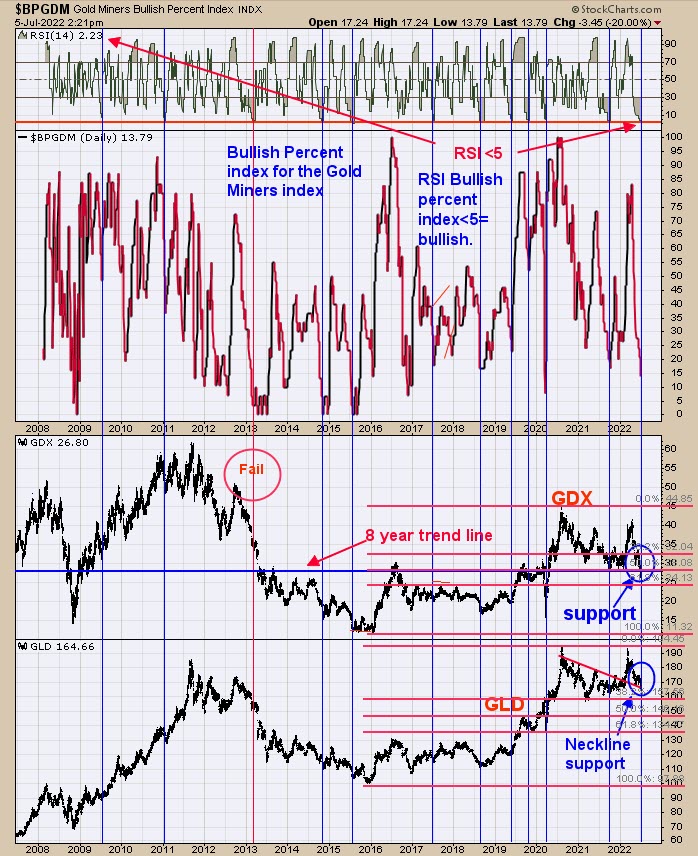
Last week, we said, "'Rare signal generated on GDX. The last time this type of signal was generated was last October low. The signal is the RSI for the Bullish Percent index for the Gold Miners index. When the RSI for the Bullish Percent index falls below 5 (current reading is 4.40), the market was at an intermediate-term low.' This chart is displayed above and updated to current data. We took this indicator back to where it began, which is 2008. There have been eleven signals of this type (not counting the current signal) going back to 2008 and there where one failure in 2013 (middle of a major bear market for Gold and gold stocks), which works out to a 91% success rate. Of the 10 signals that did work out, all had good rallies and some turned into major advances. All major signals are hard to stick with and the current one is no different." Added to the above, the RSI for the Bullish Percent index for the Gold Miner's index stands at 2.23. We added Fibonacci retracements, which GDX stands at 50% and GLD at 38.2%, showing GLD holding up better than GDX. Either this is like 2013 (marked with Fail on chart above) or the market is making a bottom here like the other 91% of the time. At major lows in GDX, there is a "Flush", and maybe that is what is going on here.
Tim Ord,
Editor
Read Full Story »»»
DiscoverGold
Even after months of gold loving news, especially today, it’s trashed down to 1736 currently, and should be taking off higher. If it does not there are possibly fundamental changes in metals market that may change forward directions and outlooks. I can only say be careful, July is supposed to be one of best months for gold, but much more suspect trending and trading says never before manipulation.
Well I don’t see gold bottom yet and it just went below 1750. If it stays below, watch out below.
Precious Metals Stocks To Buy Or Not To Buy That Is The Question
By: Rambus | July 5, 2022
My job is to give you the best unbiased opinion of the markets to the best of my ability. That means my opinion is my opinion and not someone else’s. Opinions are a dime a dozen when it comes to the markets including mine. There are some good analysts and some not so good market analyst which can become very confusing when one tries to read every stock market timer on the planet.
Most investor will gravitate to someone that says what they want to hear to reenforce what they think the markets should be doing. Keeping an open mind can be very hard when so much information is bombarding us each and everyday of our life especially in this day and age. Information overload can cause mental paralysis which can lead to unwanted mistakes.
The most important thing to have when trading the markets, which is the toughest game on the planet to win, is to have a game plan and the discipline to execute it. It all sounds so easy on paper, but in reality it is much harder to do because we are human beings who have survived by following the herd.
The markets are like a casino in Las Vegas, sometimes you win and sometimes you lose, but in the end they will end up with most of your money. In the markets you may get some good trades off, but eventually you will give your profits back and then some until you realize this game we choose to play is much harder than we thought. I’ve said this many times in the past, “we are going up against the greatest traders and trading systems in the world that want every penny you have and won’t feel bad if it is your “LAST PENNY.”
I’m going to focus exclusively on the PM complex tonight and lay out the groundwork for what is possible if one can keep an open mind. There are never any 100% guarantees when it comes to the markets, but if we can get the odds in our favor we have a fighting chance to be successful. When looking at the charts below please keep an open mind.
Many of the charts you will see were down loaded last Thursday which was the end of the month and end of the quarter with a few downloaded this weekend. Lets start with the long term monthly chart for Gold which shows the possible double H&S bottom with the right shoulder still under construction. If you look at the thumbnail on the right sidebar you will see that Gold closed the month of June just below the 20 month ema for the first time since neckline1 gave way. It was only by a small margin which doesn’t look that significant, but it was the first time in a couple of years.
The best way to understand the importance of the 20 month ema is to start at the beginning of the bull market back in 2000 by following the price action and the 20 month ema together. The only time that Gold closed below the 20 month ema was during the 2008 crash which ended up being the head of the H&S consolidation pattern and only lasted one month. The very next month Gold closed back above the 20 month ema and stayed above the 20 month ema until the top completed at the 2011 high. It is all about where Gold closes at the end of the month and not what it does during the month. For now this is a warning sign.
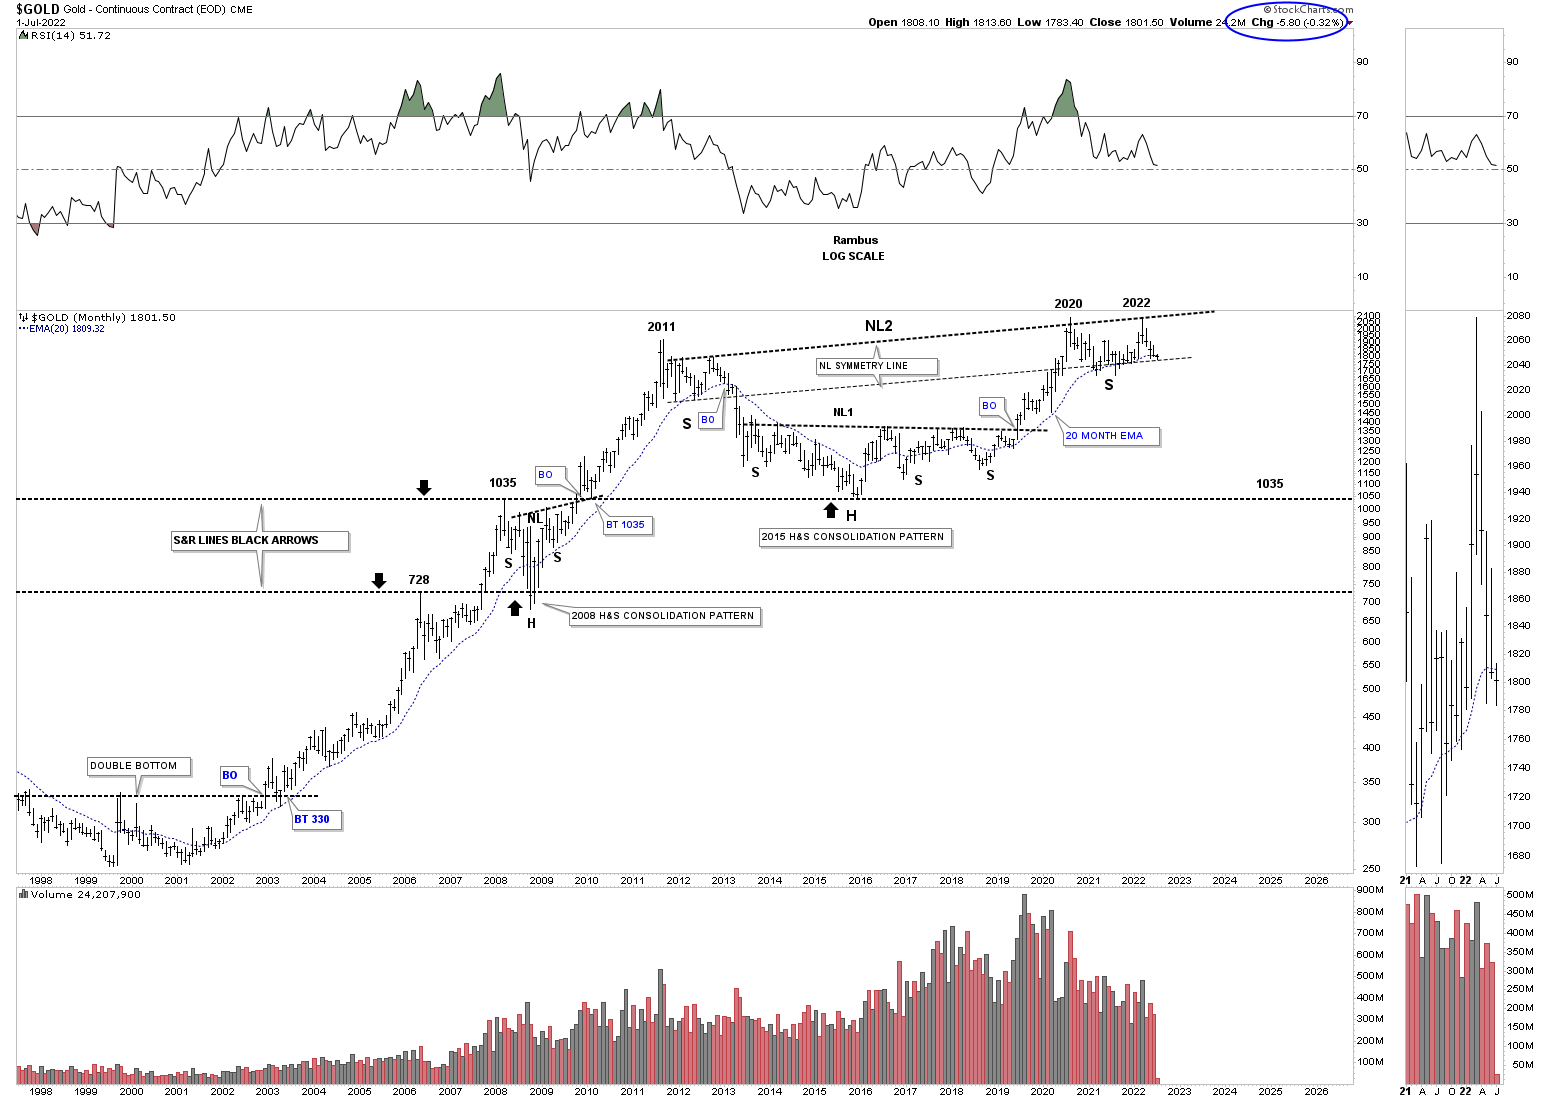
Next is the Gold fractal chart which shows the 2011 and 2020 trading ranges which are very similar in time and price. It is not the end of the world, but Gold was supposed to breakout one way or the other at the end of June and didn’t, calling the fractal into question. Again, it is not the end of the world just a warning sign.
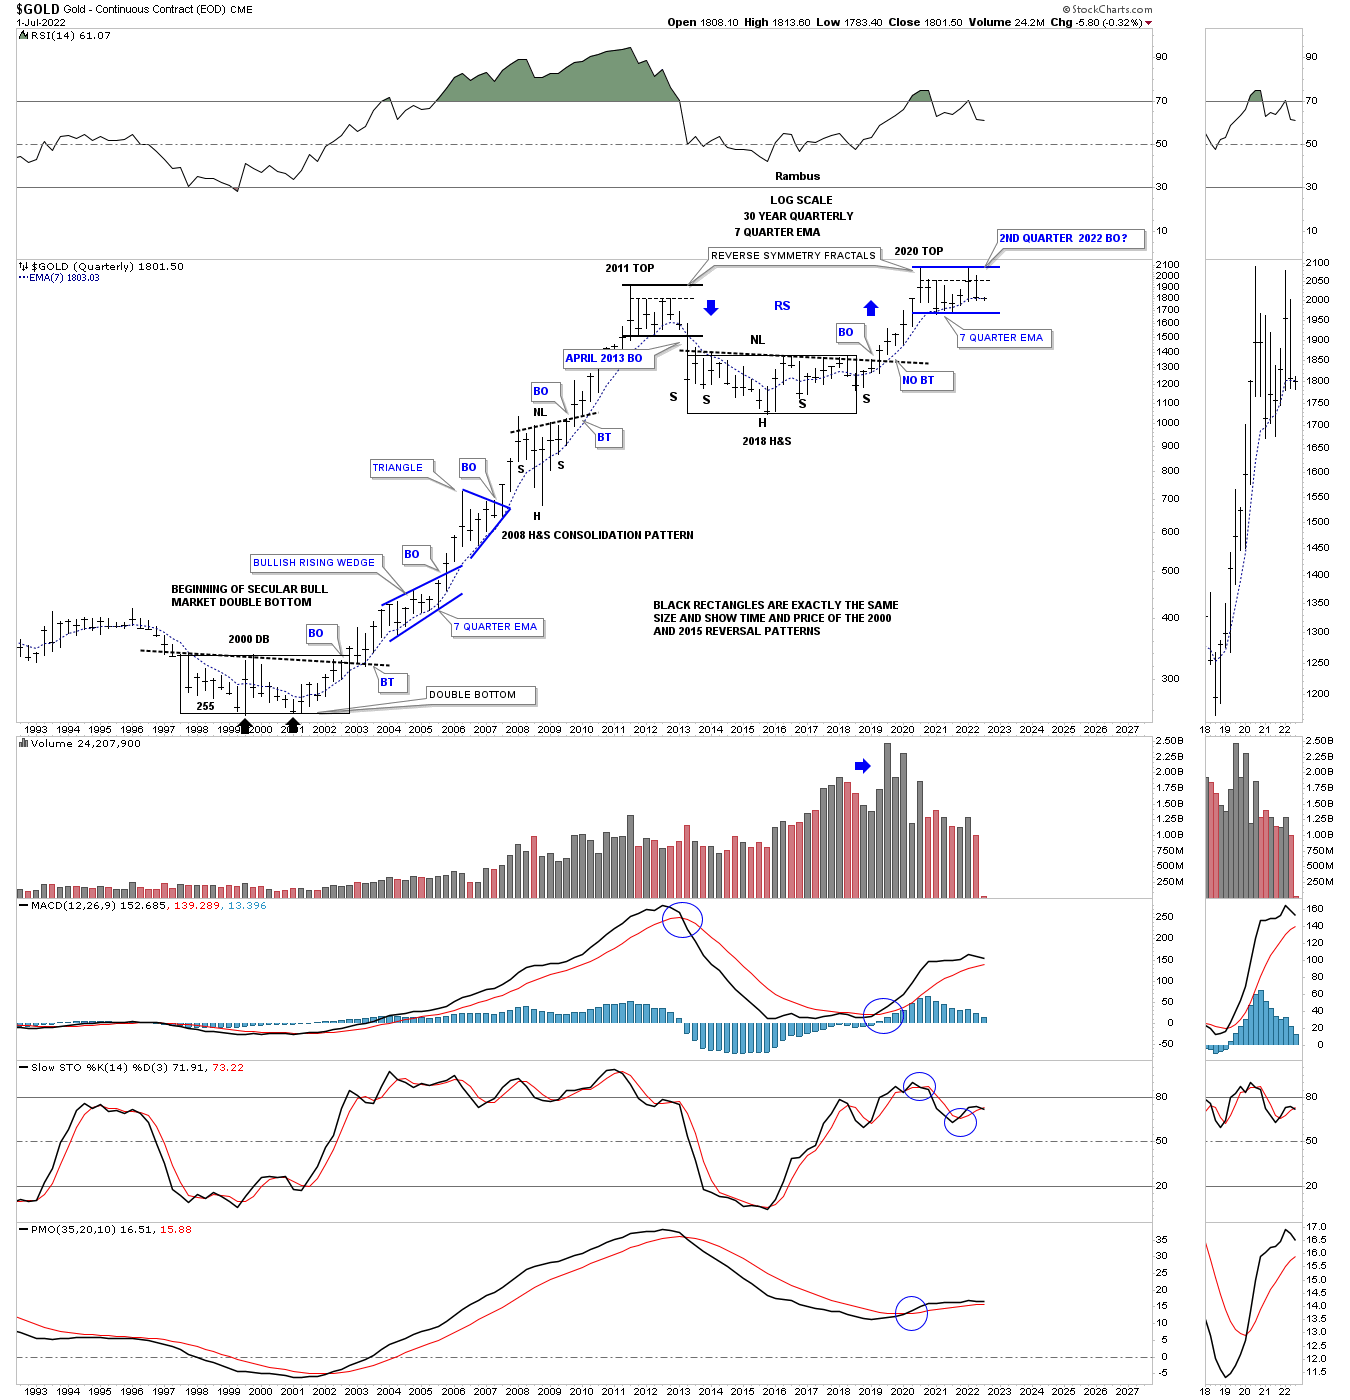
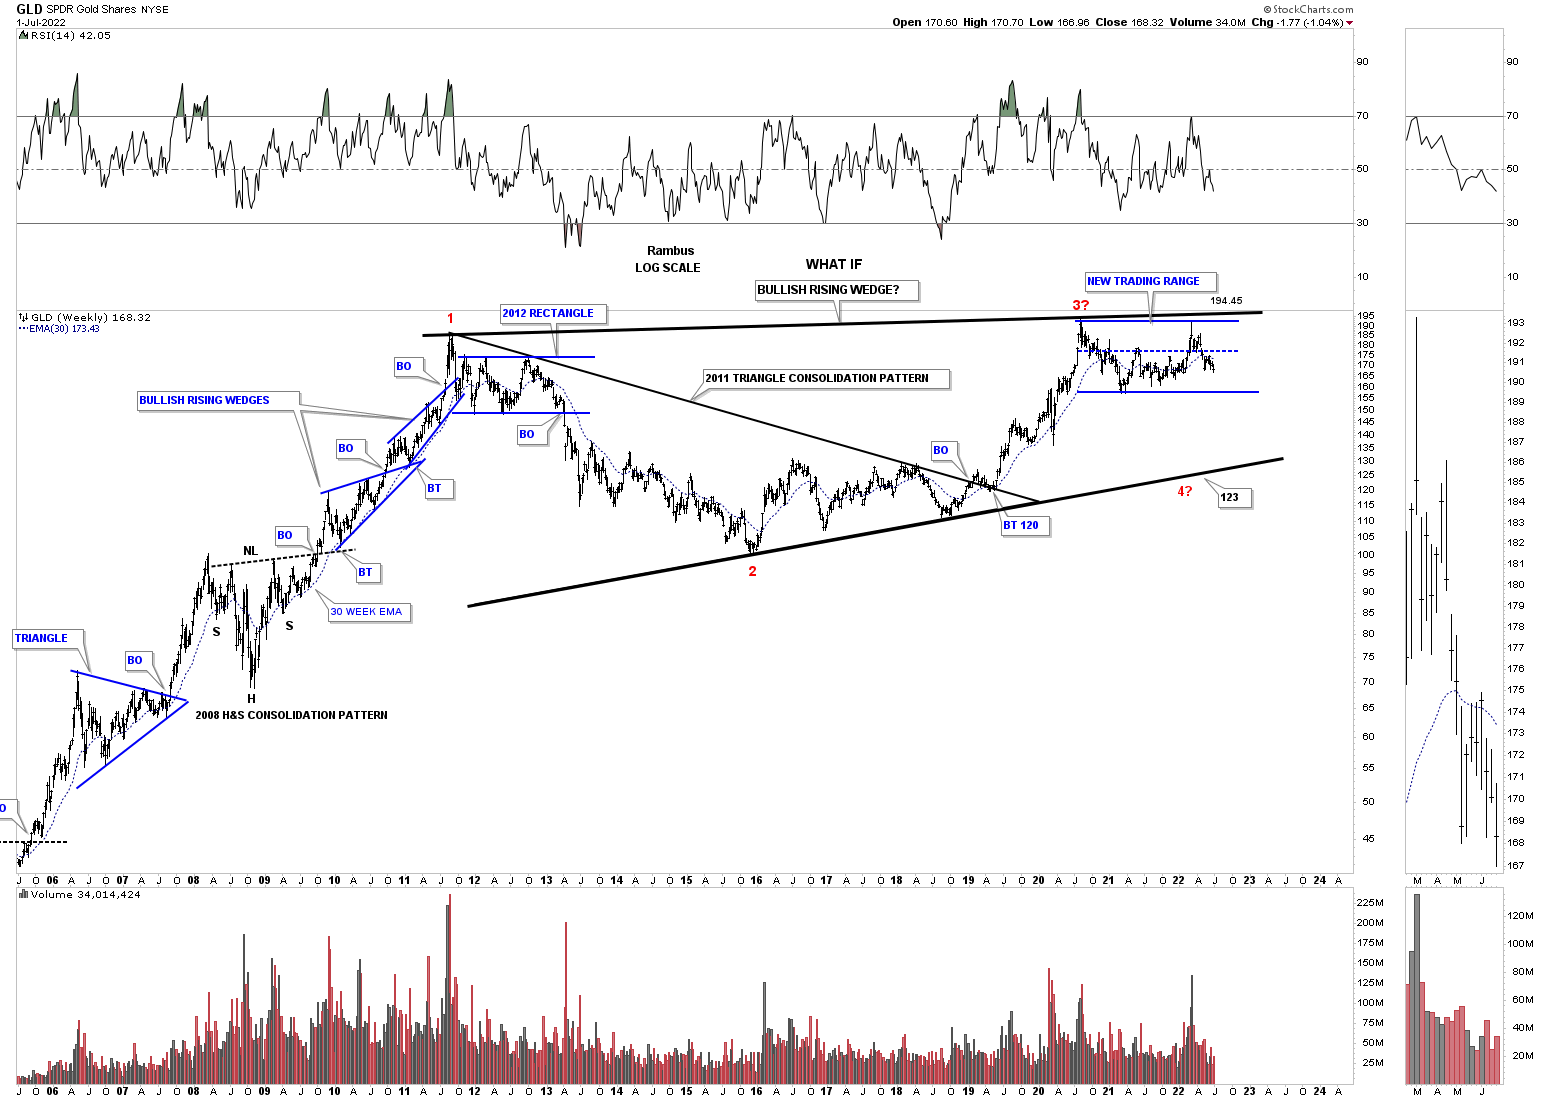
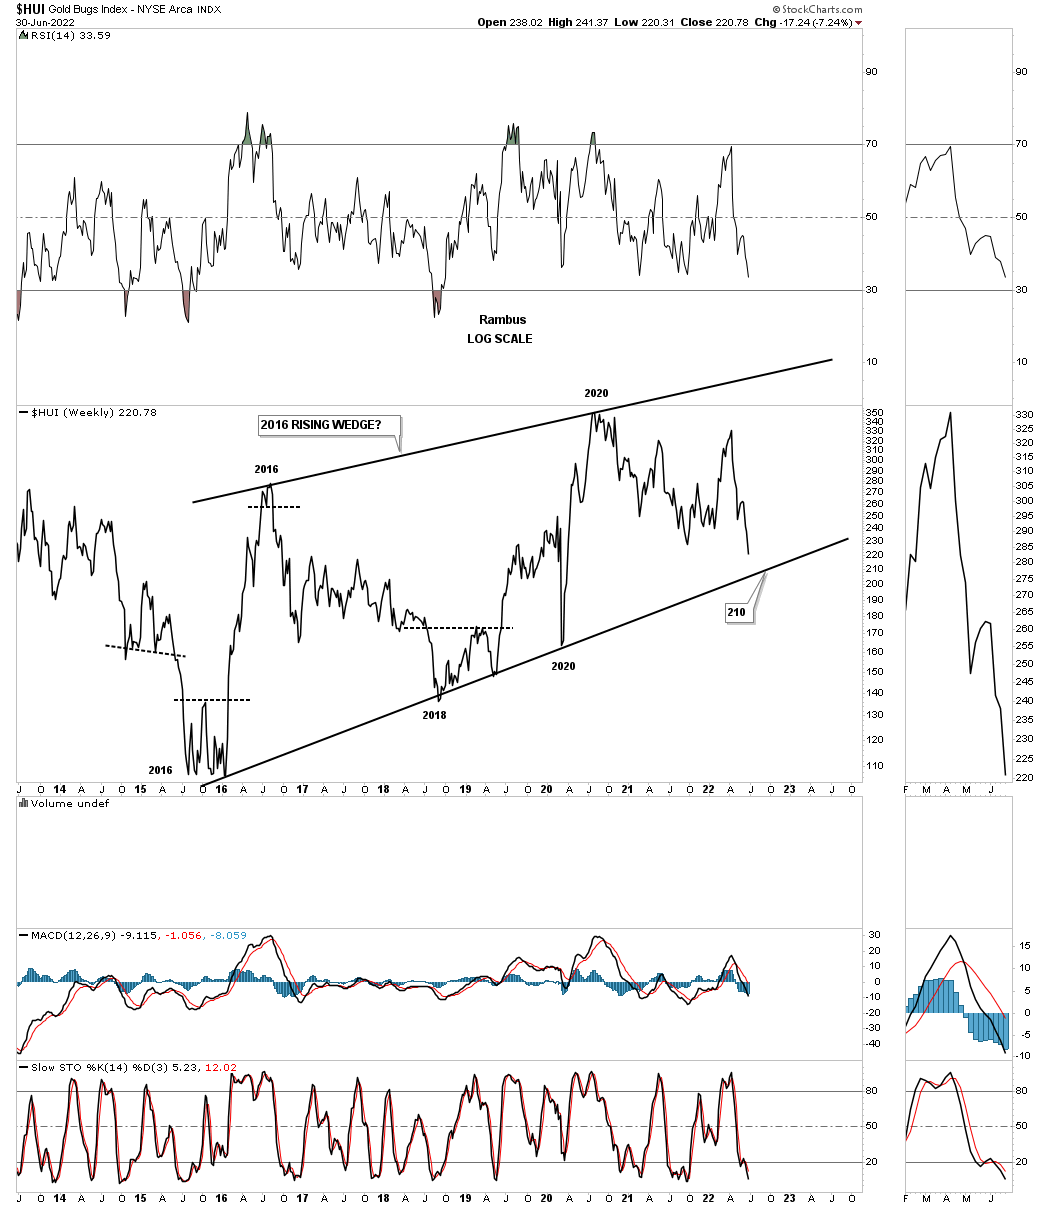
Keeping an open mind this weekly chart shows how Gold could still be in a bull market, but could have one more leg down to the bottom rail of a very large rising wedge formation that began forming at the 2011 high. Currently Gold is in no mans land offering no low risk entry point from this long term perspective.
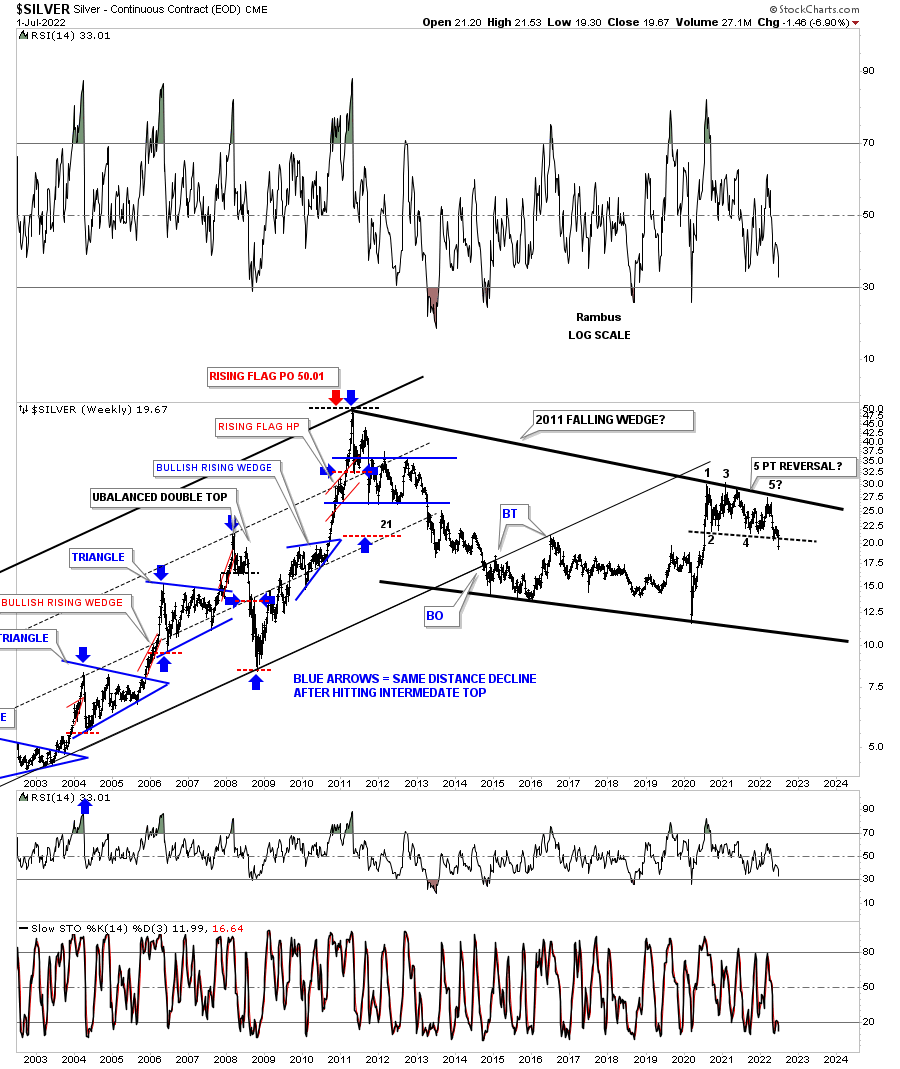
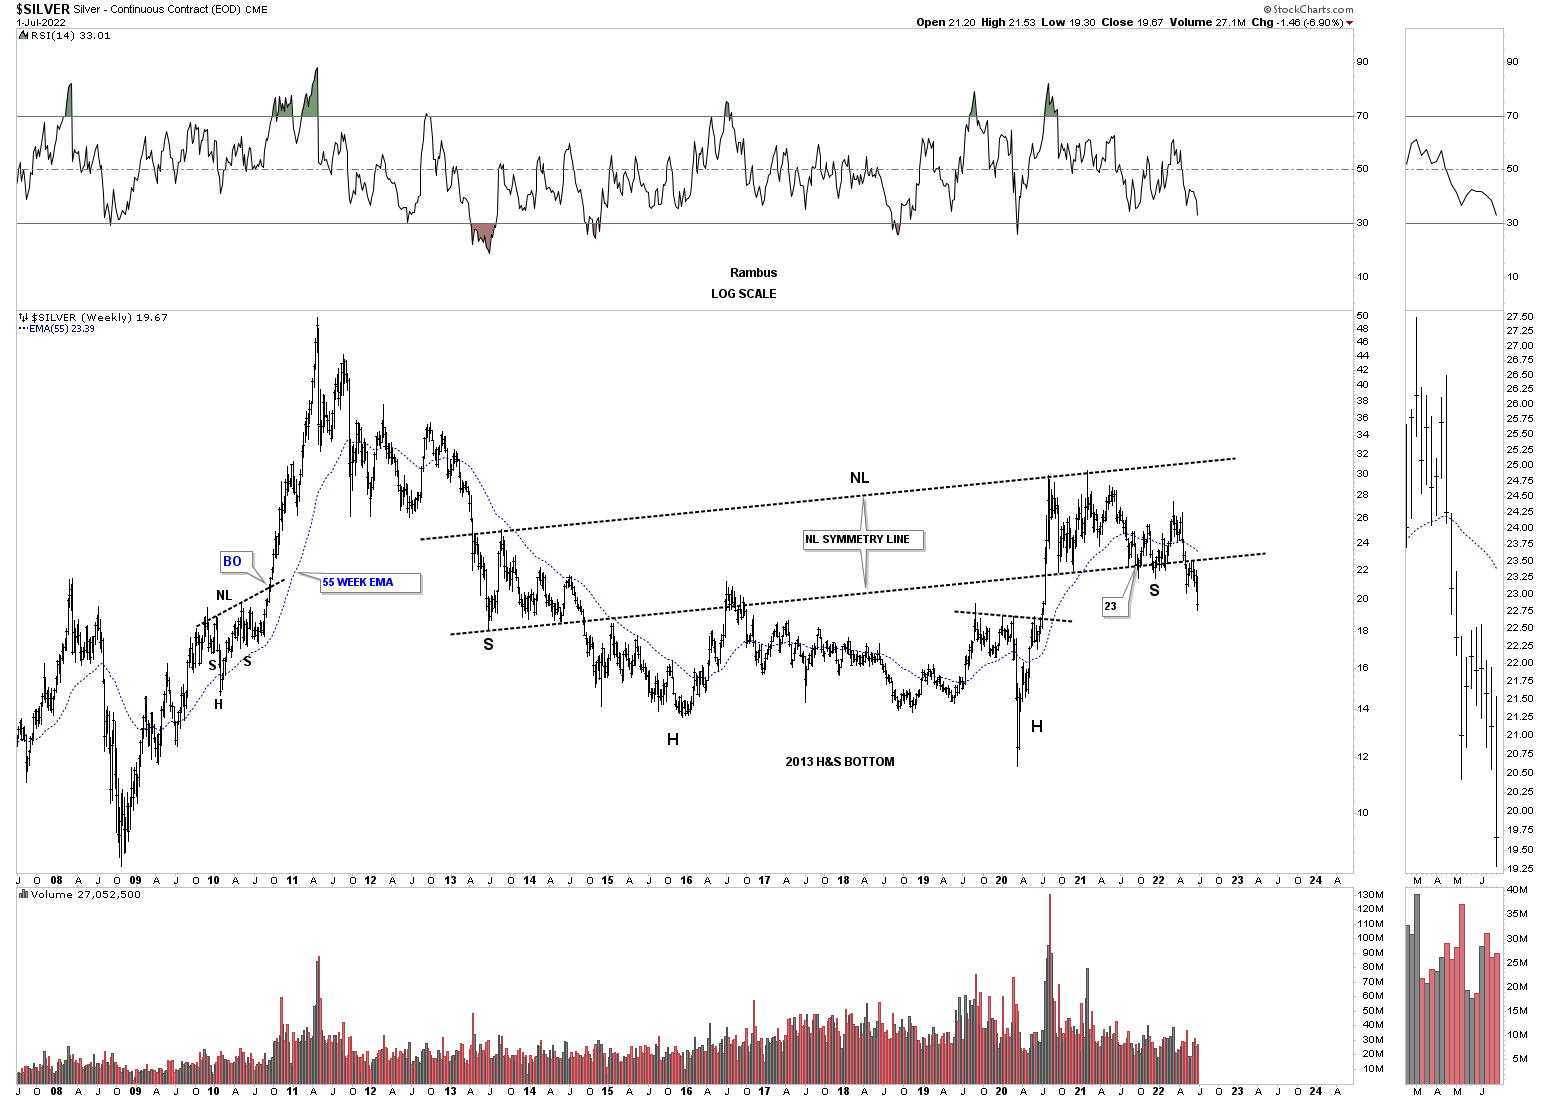
Lets move on to Silver which we know has been one of the laggards in the PM complex. After topping out in 2020 like everything else in the PM complex Silver has formed a flat top expanding triangle which gave way to the downside last week. Before breaking the bottom rail of the flat top expanding triangle, Silver put in the blue bearish expanding rising wedge which experienced a breakout and backtest to the bottom rail which strongly suggested the bottom rail of the 2020 trading range was going to give way. The blue circle shows weakness when Silver couldn’t rally all the way back to the top rail. We shouldn’t be surprised to see a backtest to the bottom rail of the flat top expanding triangle before the impulse move really takes hold to the downside.
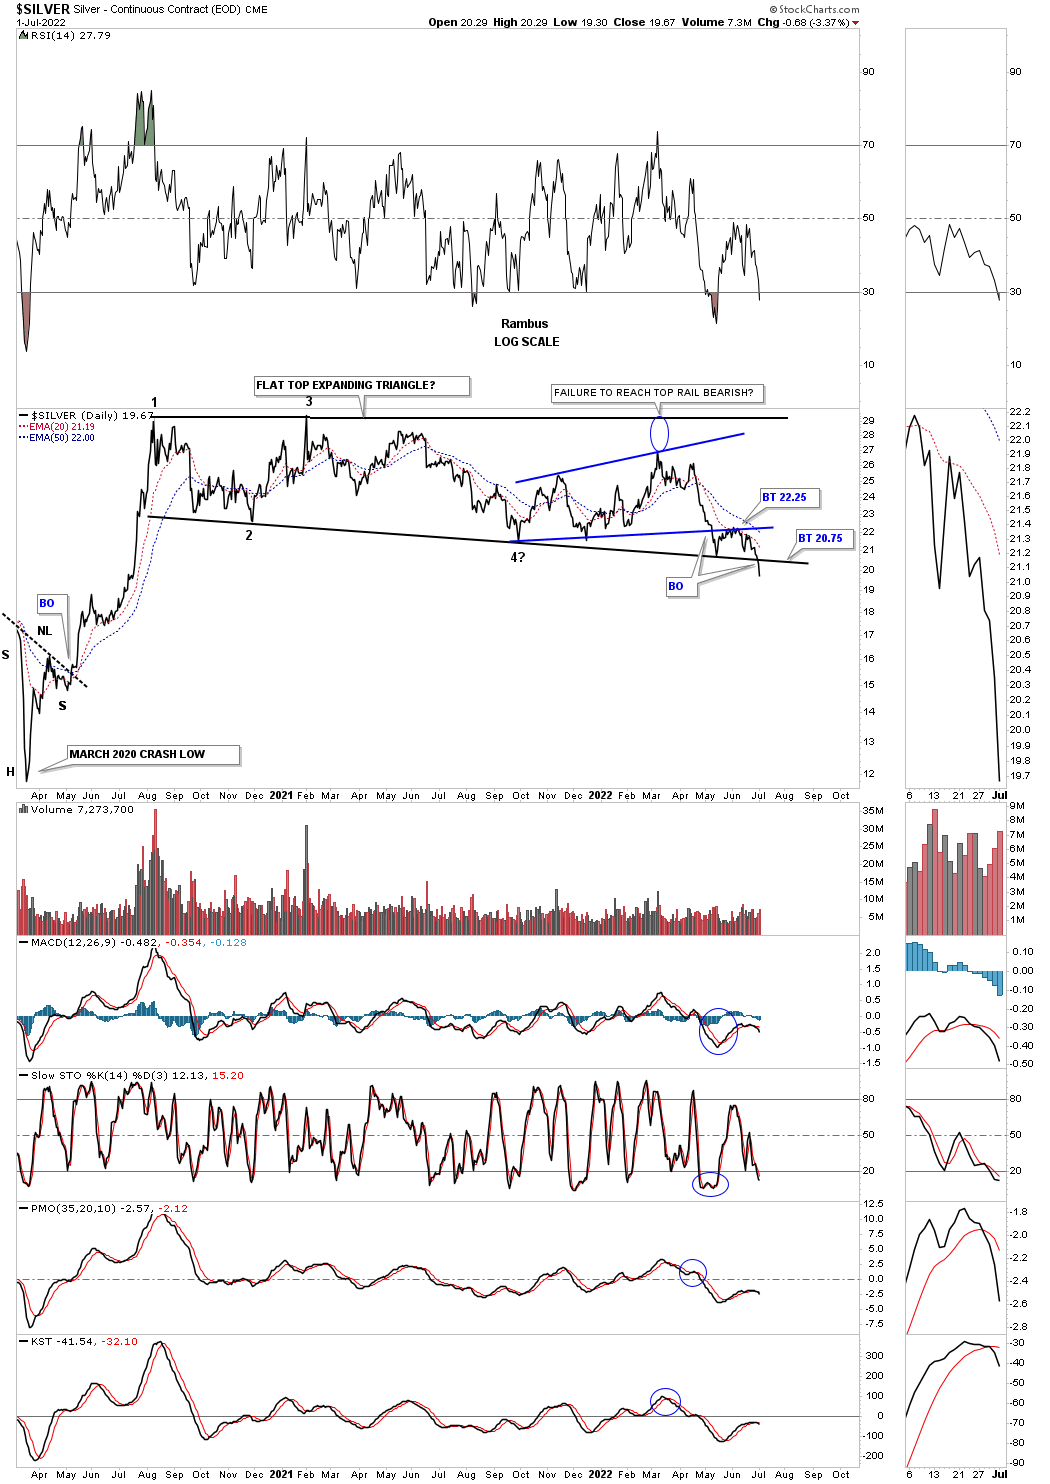
This next chart is an old chart I used during the bull market years charting the bull market in Silver. It is hard to see now but during each impulse move the price action would form a small red bullish rising wedge between each consolidation pattern.
Now look at the top rail of the 2011 falling wedge and how nicely the 2020 trading range, on the daily chart above, interacts with it. As you can see there is no gap at the 5th reversal point as the angle of the top rail takes care of it now. You can see last weeks bar traded the entire week below the bottom rail. Again, we should expect to see a backtest.
This slightly different version of the chart above shows the 2013 rectangle which was the first consolidation pattern in the 2011 bear market. Now look at the 2020 trading range and the similarity to the 2011 trading range. From strictly a support and resistance perspective you can see how the 2020 trading range has ran into resistance at the bottom of the 2013 trading range with just a bit of overlap. You can also see how the top of the 2016 trading range has been holding support. With Silver breaking below the bottom of its 2020 trading range the odds favor Silver moving lower leaving the 2020 trading range as a distribution pattern.
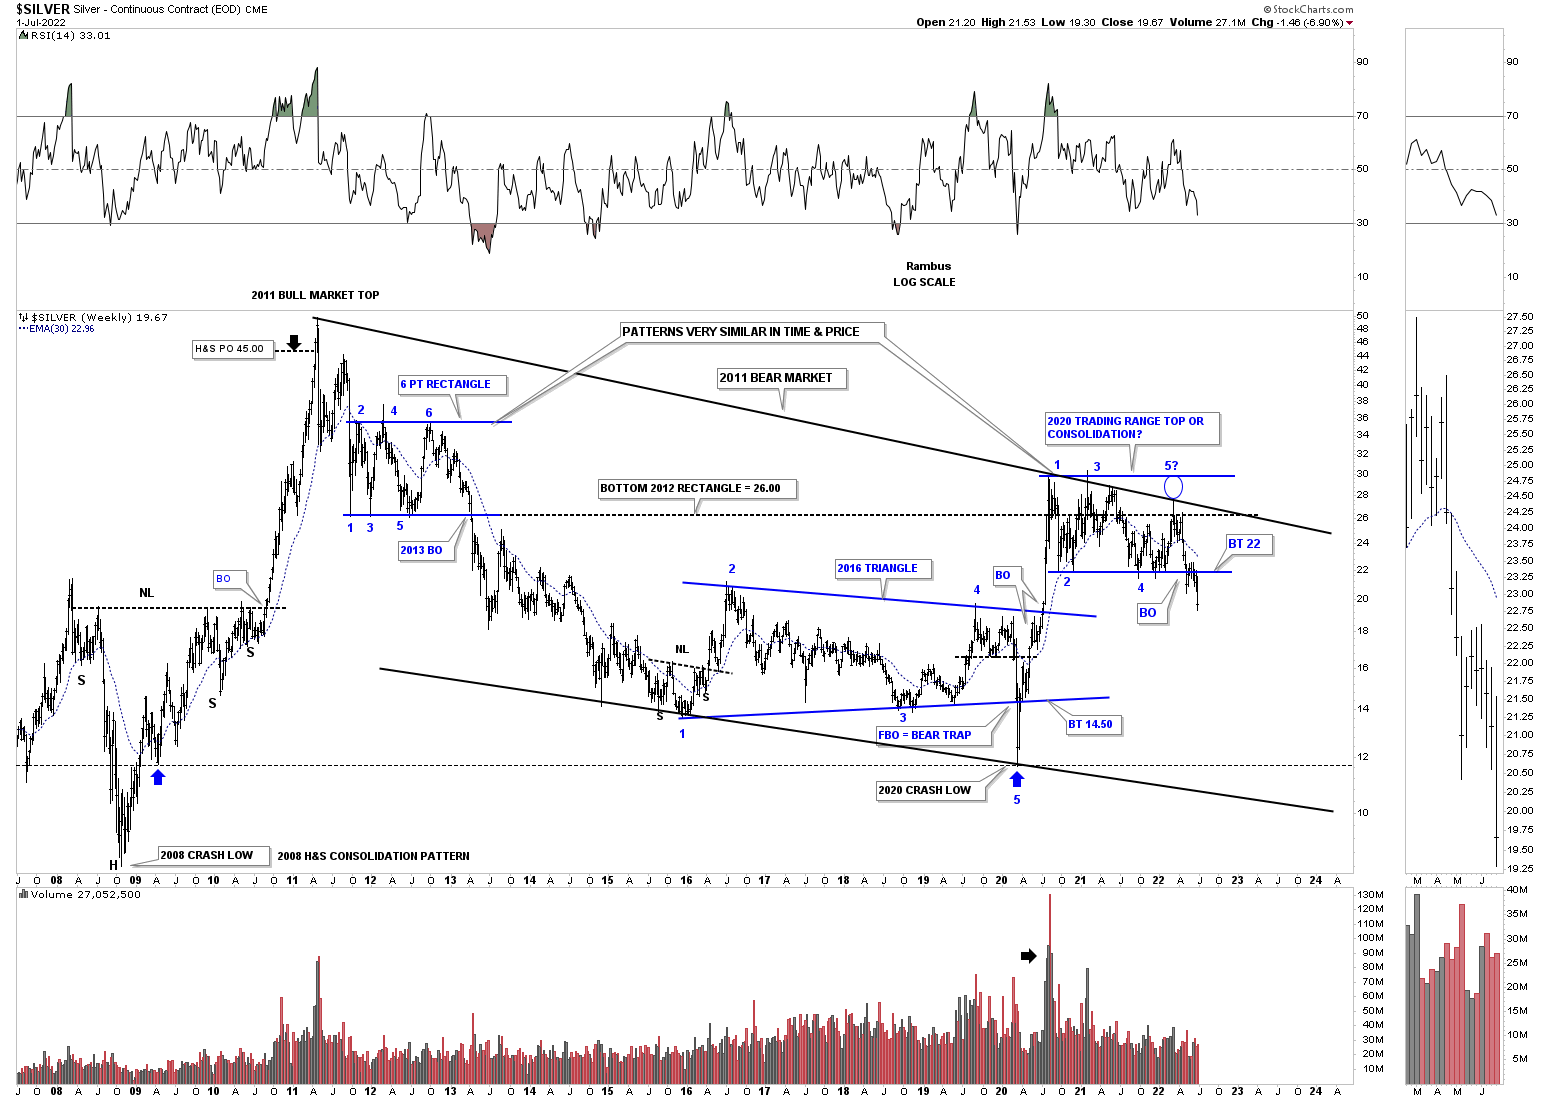
I realize that few can grasp what this big picture of Silver is strongly suggesting, but when the bottom rail of the 2020 trading range gave way the odds went way up that the top rail of the 2011 bear market downtrend channel is still hot and to be respected. The bulls had every chance in the world to hold support at the bottom blue rail, but they told us they are weaker than many think is possible.
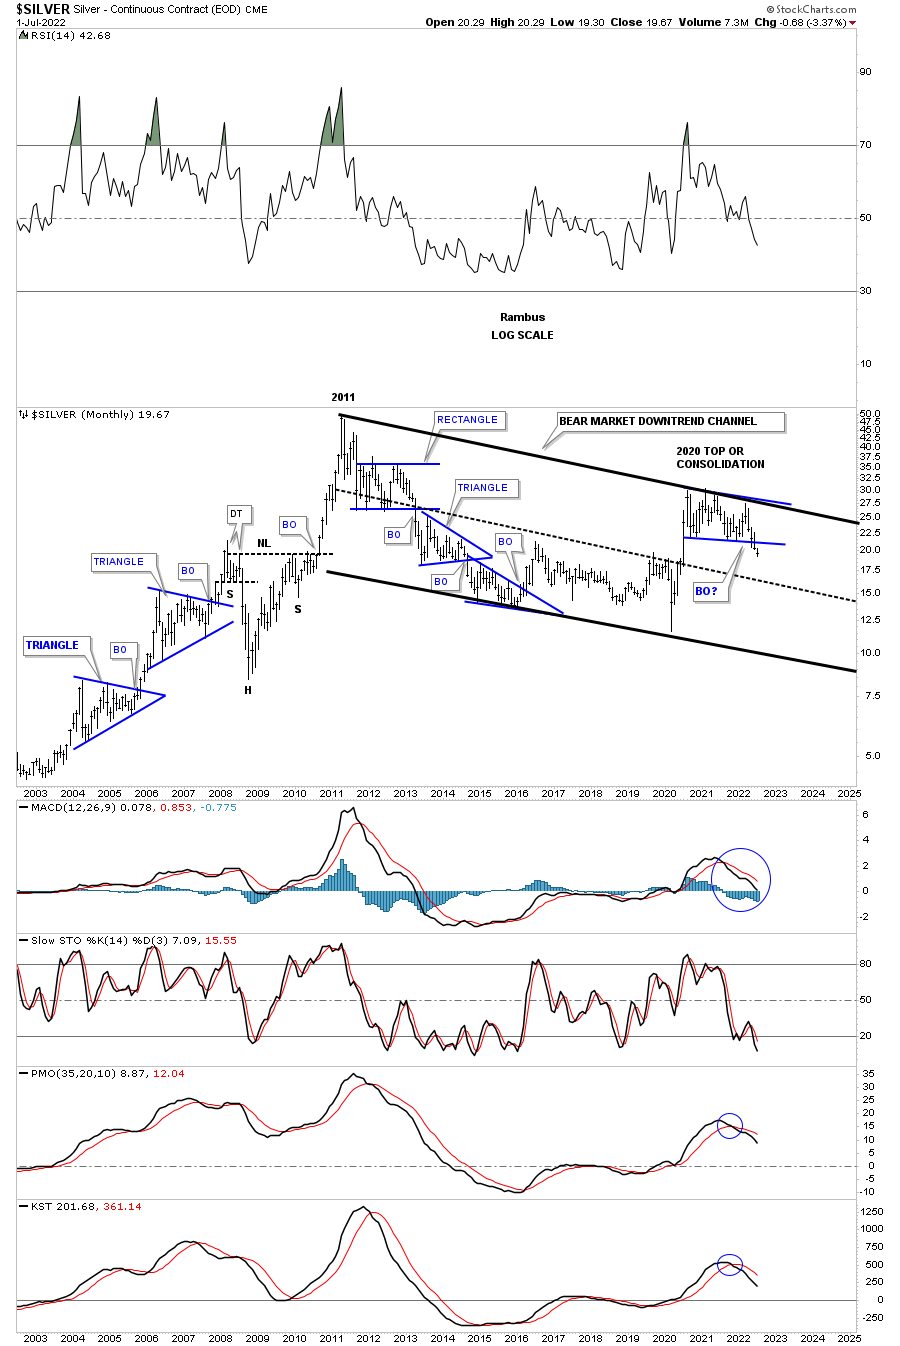
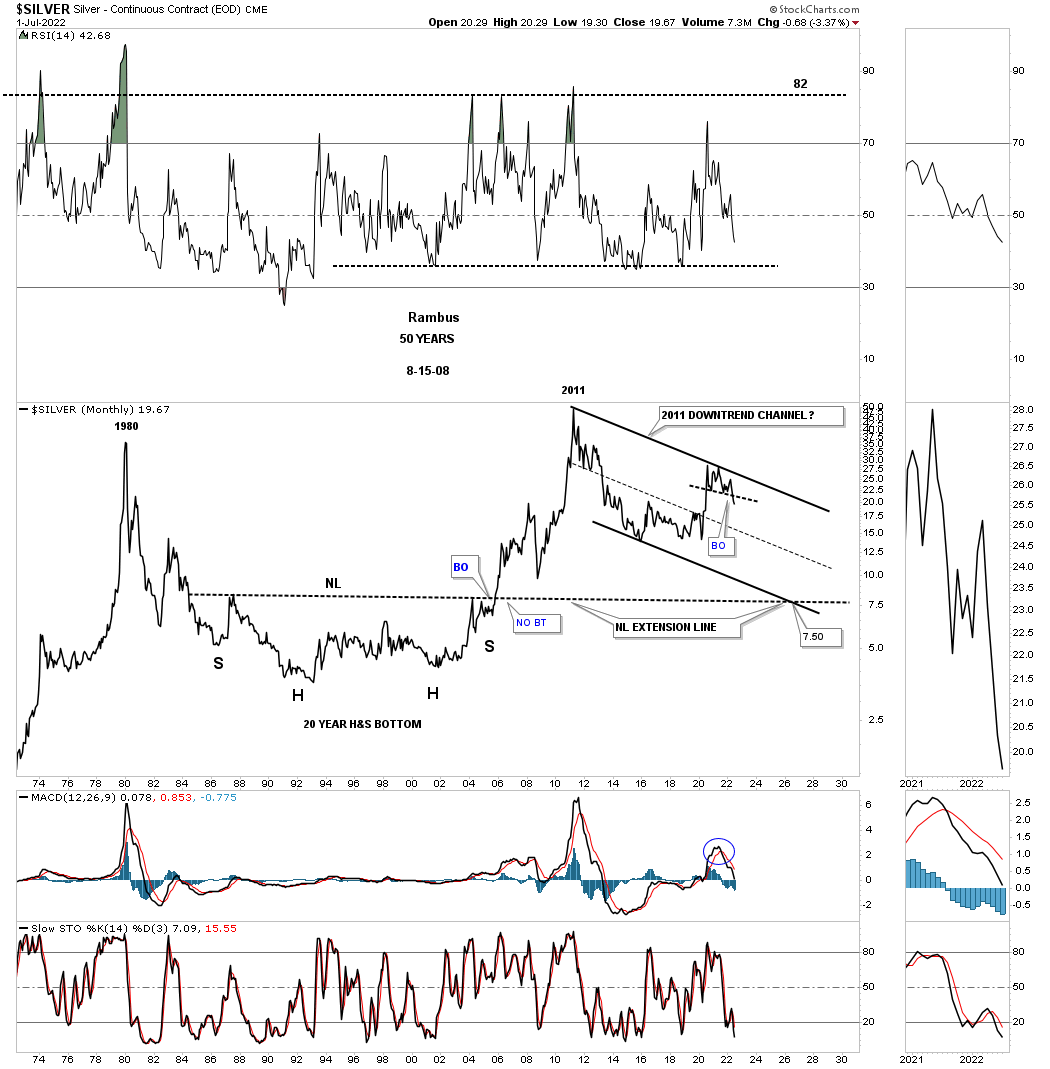
This 50 year monthly chart for Silver puts the 2011 downtrend channel in perspective. I know it seems impossible at this time, but the bulls are doing nothing to change this possible scenario. Until they do, it is what it is until it isn’t.
About ten months or so ago I showed this chart for Silver and the rest of the PM complex which were forming a possible massive H&S base with the neckline symmetry line holding support for the low of the right shoulder. As you can see that possible H&S bottom is fading fast as the price action is now trading below the neckline symmetry line which isn’t the end of the world of the possible H&S bottom, but it now puts it in question. It is not pretty and symmetrical anymore.
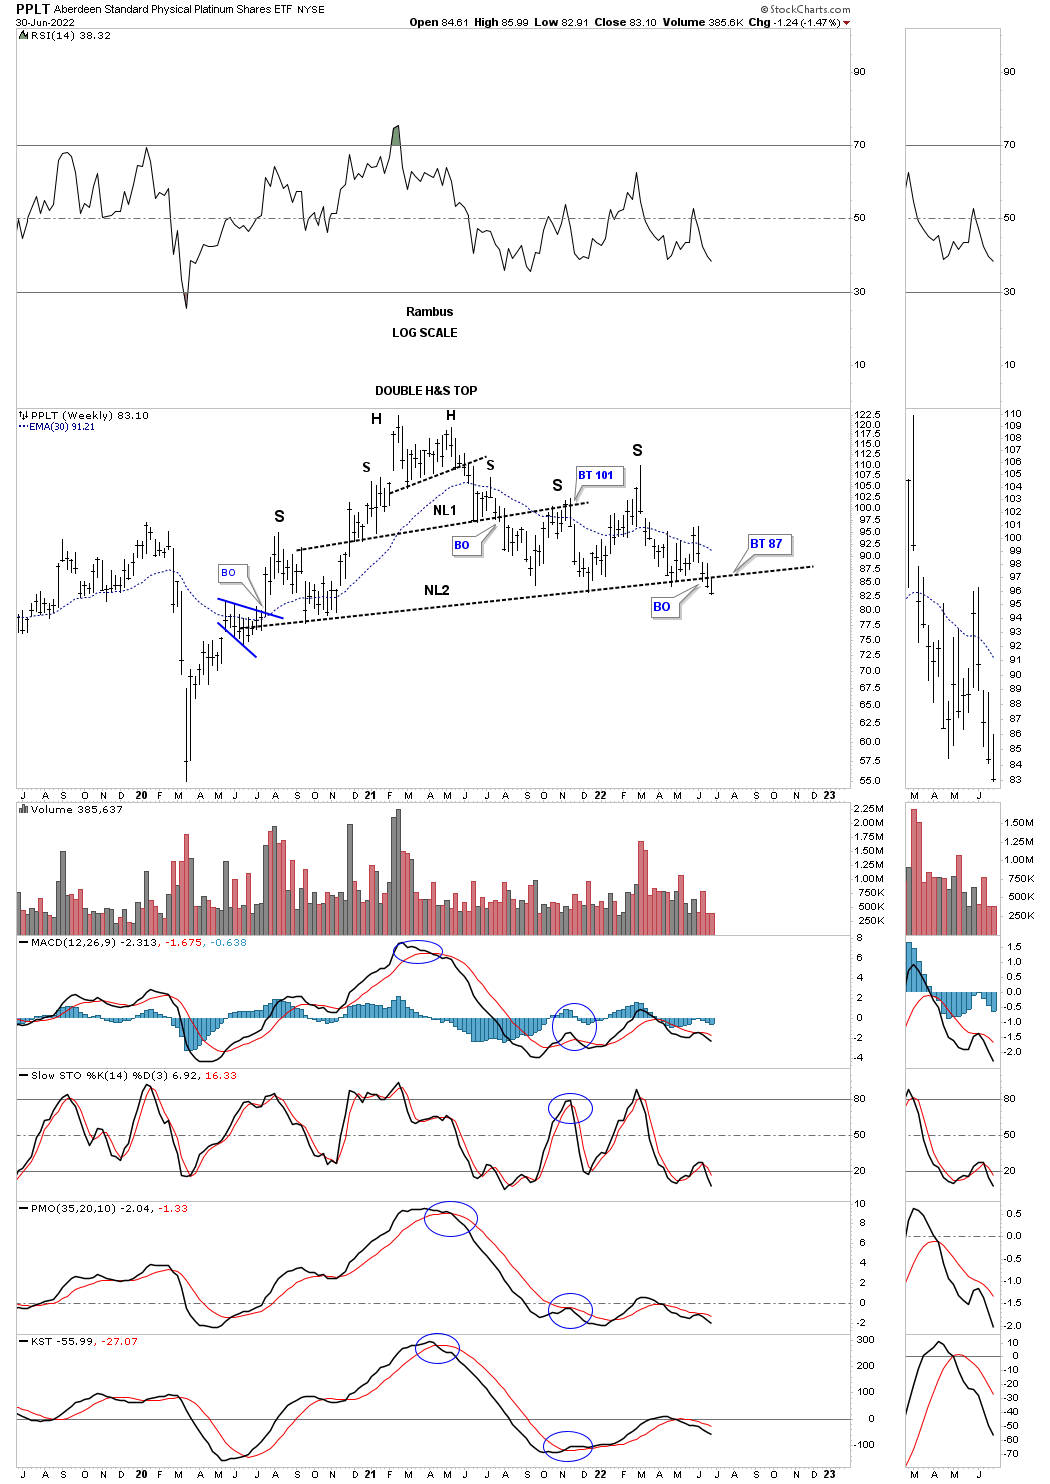
PPLT, Platinum, has now traded two weeks below its possible very large H&S top neckline. Now we’ll watch the neckline for a backtest to see what happens.
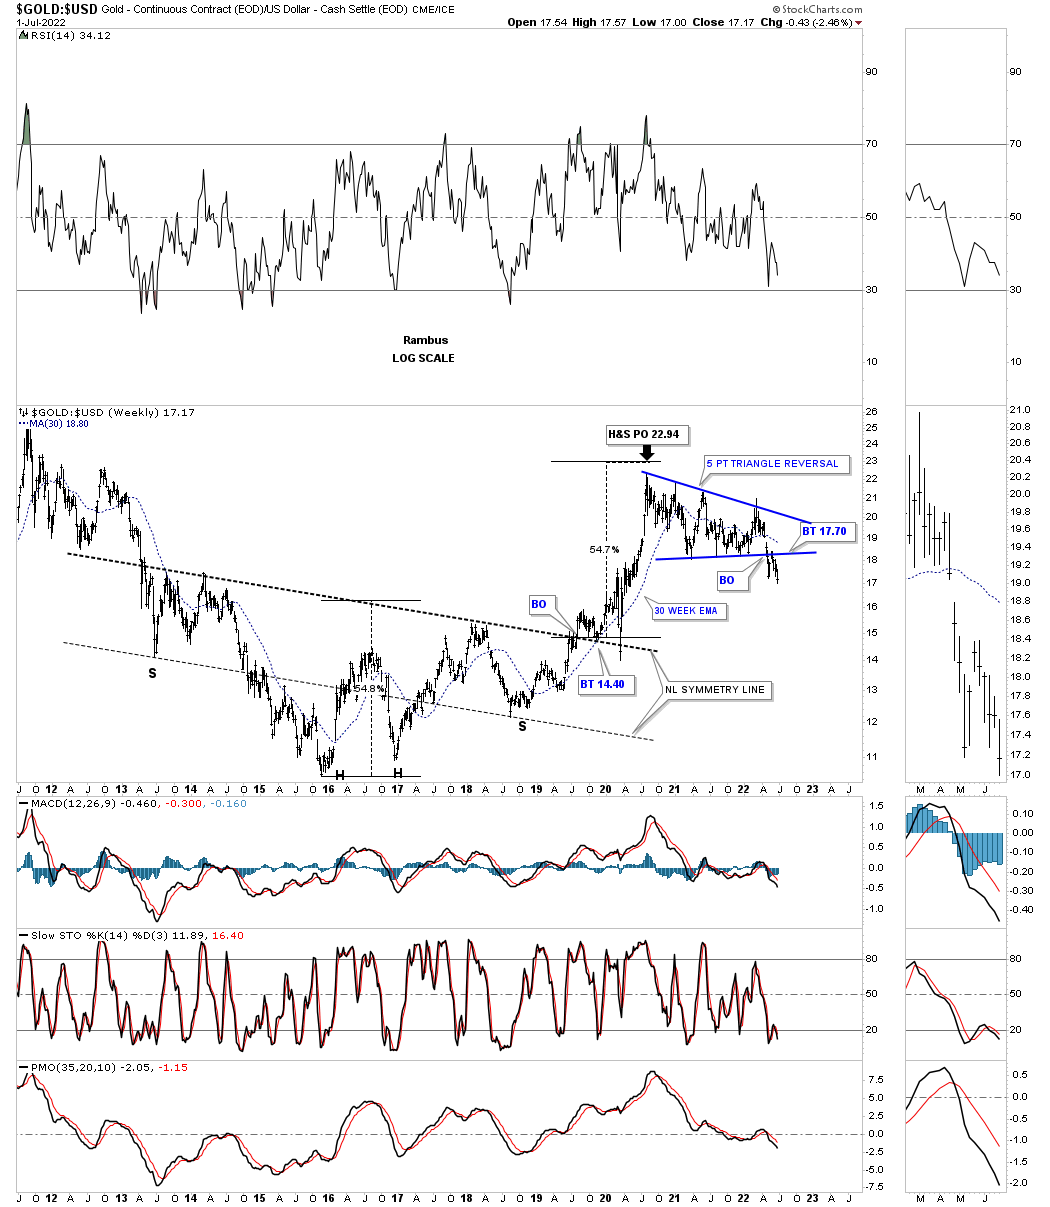
Now lets look at a couple of ratio charts to see if they can help us in determining the next important move in the PM complex. This first ratio chart compares Gold to the US dollar which shows the ratio built out a very large H&S bottom, meaning Gold was outperforming the US dollar into the 2020 high. As you can see the price action fell just shy of reaching the minimum price objective for the H&S bottom.
Since the high made in 2020 the ratio formed the five point blue triangle reversal pattern that shows a breakout and backtest that may be complete. I don’t want to sound like a broken record, but if the Gold bulls were in charge the triangle should have broken to the upside and not the downside.
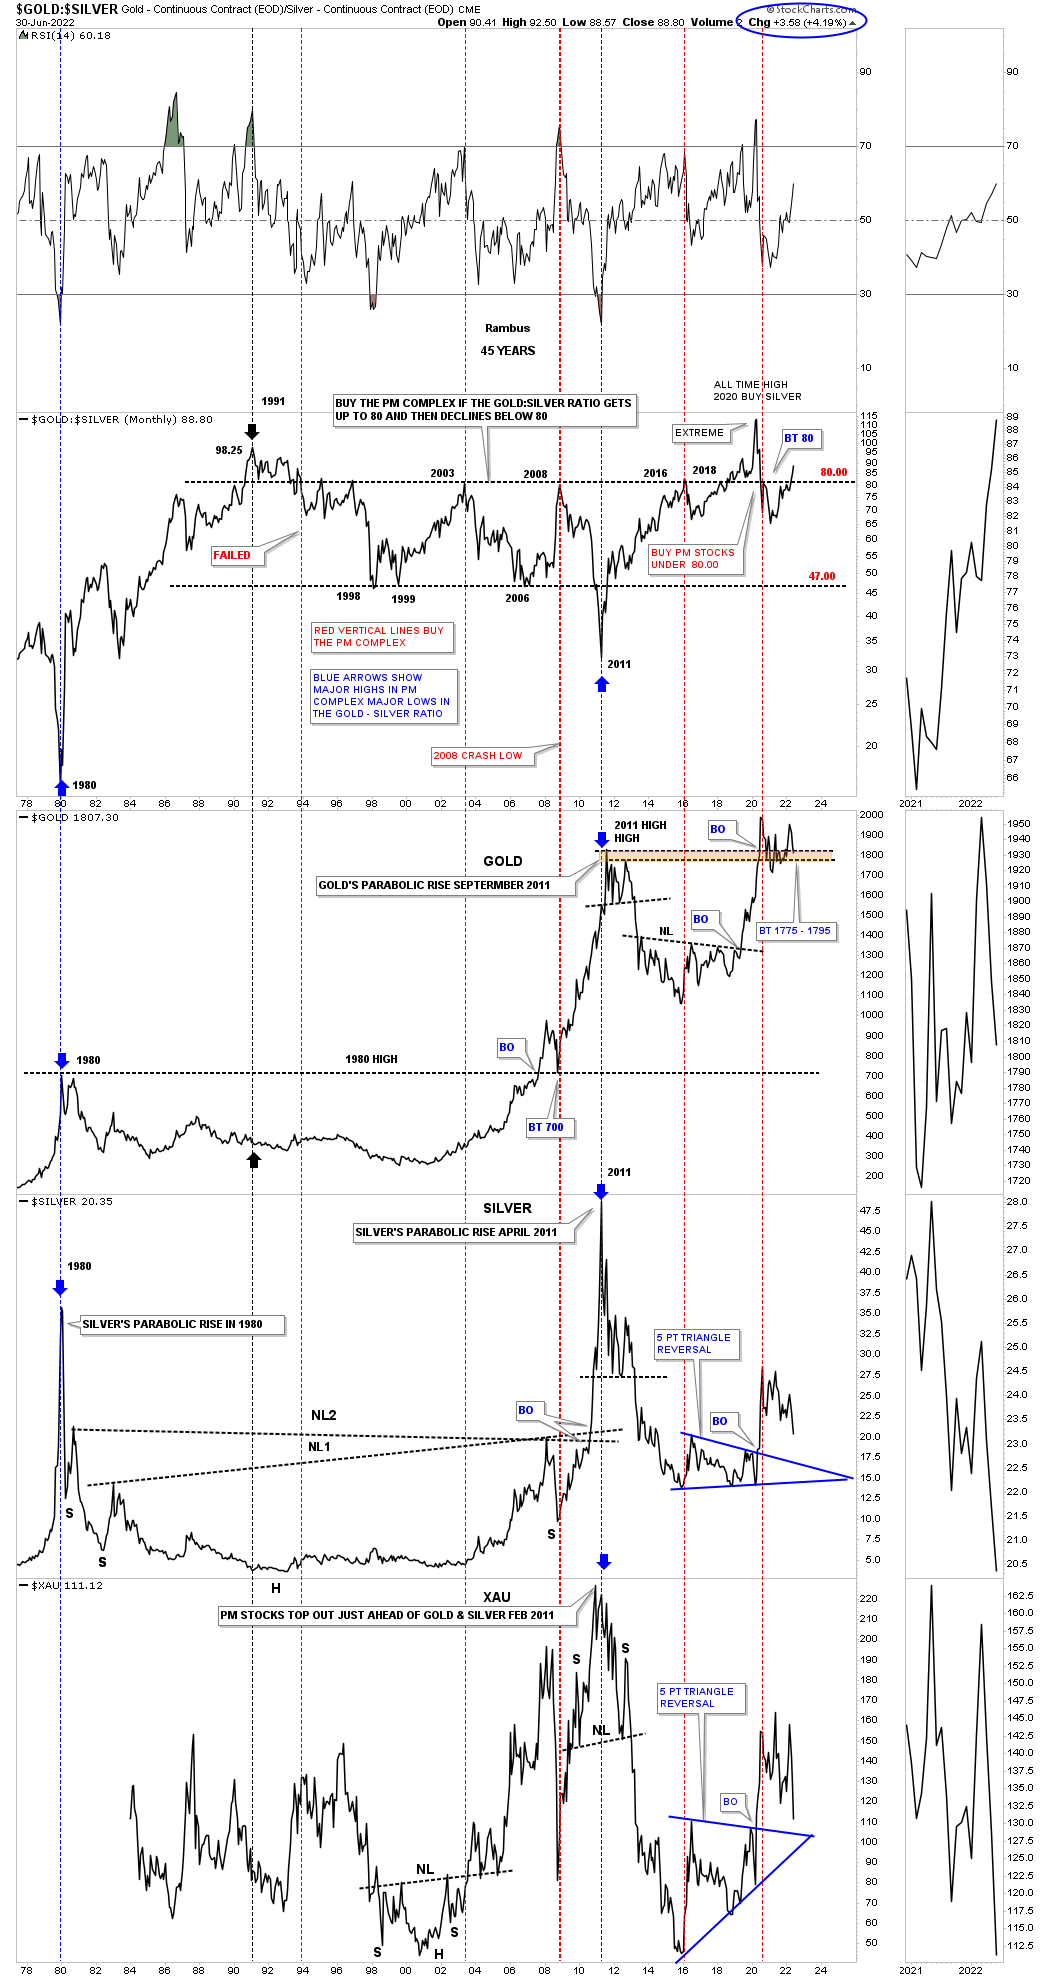
Everyone who follows the Gold:Silver ratio has their own interpretation of what it means. For me when the ratio is rising that is generally, but not always, not a good time to be in PM stocks. Since the 2020 low in the ratio and the high in the PM complex the ratio has broken back above 80 which is not a bullish sign if one is long the PM complex. Again, it is not the end of the world, but a huge warning sign to stay vigilant if one is thinking about entering the PM complex.
Lets look at a few PM stock indexes to see if they can give us any good clues on the next important direction for the PM stocks. Lets start with the long term monthly chart for the HUI which shows its 2000 bull market uptrend channel. The two black rectangles measure each half of the uptrend channel. The HUI could decline down to the bottom rail and the bull market would still be intact with no damage done, frustrating the bulls.
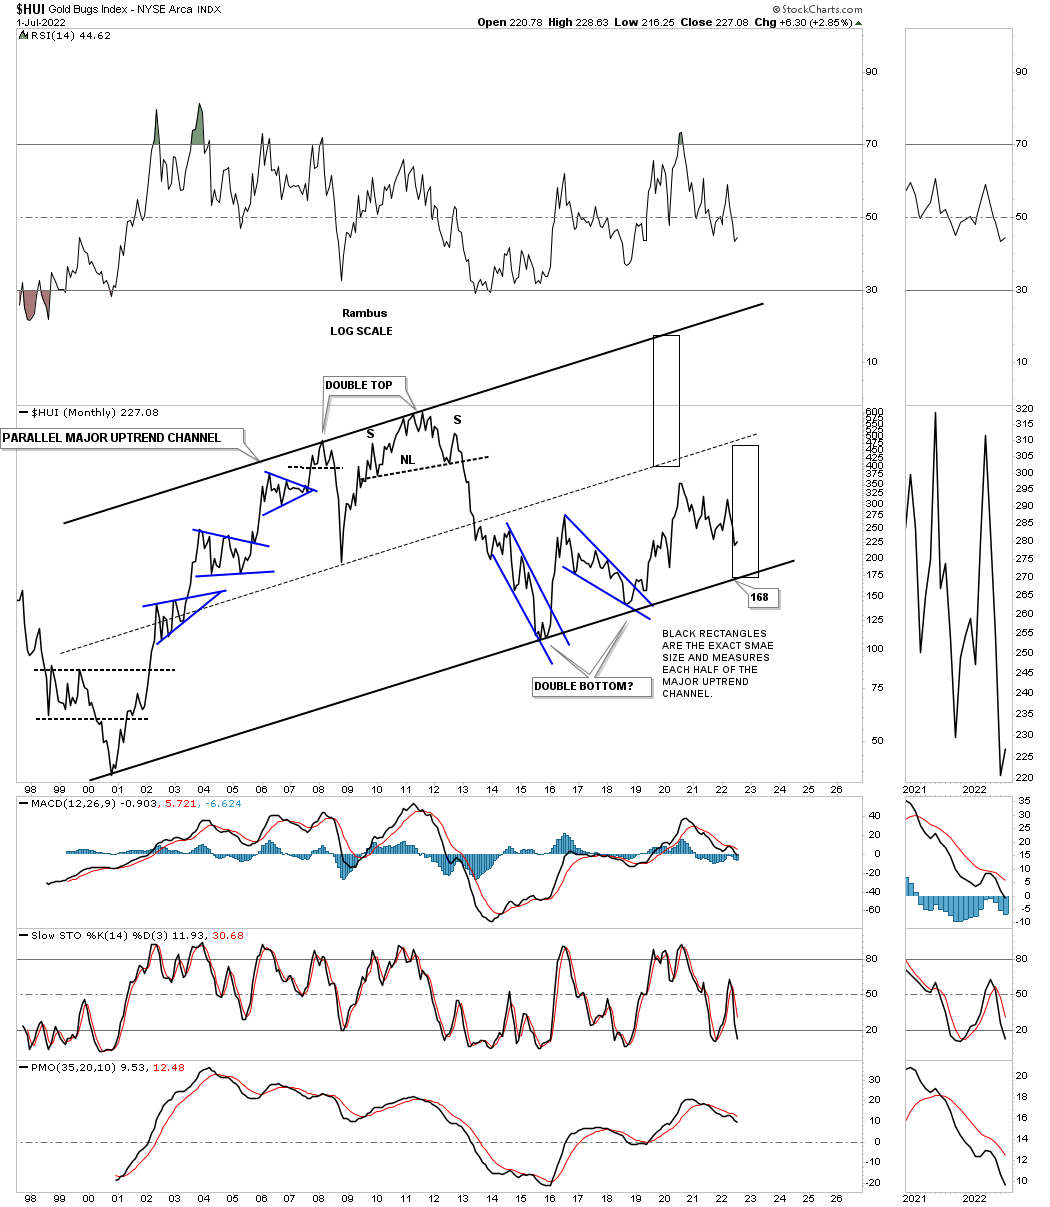
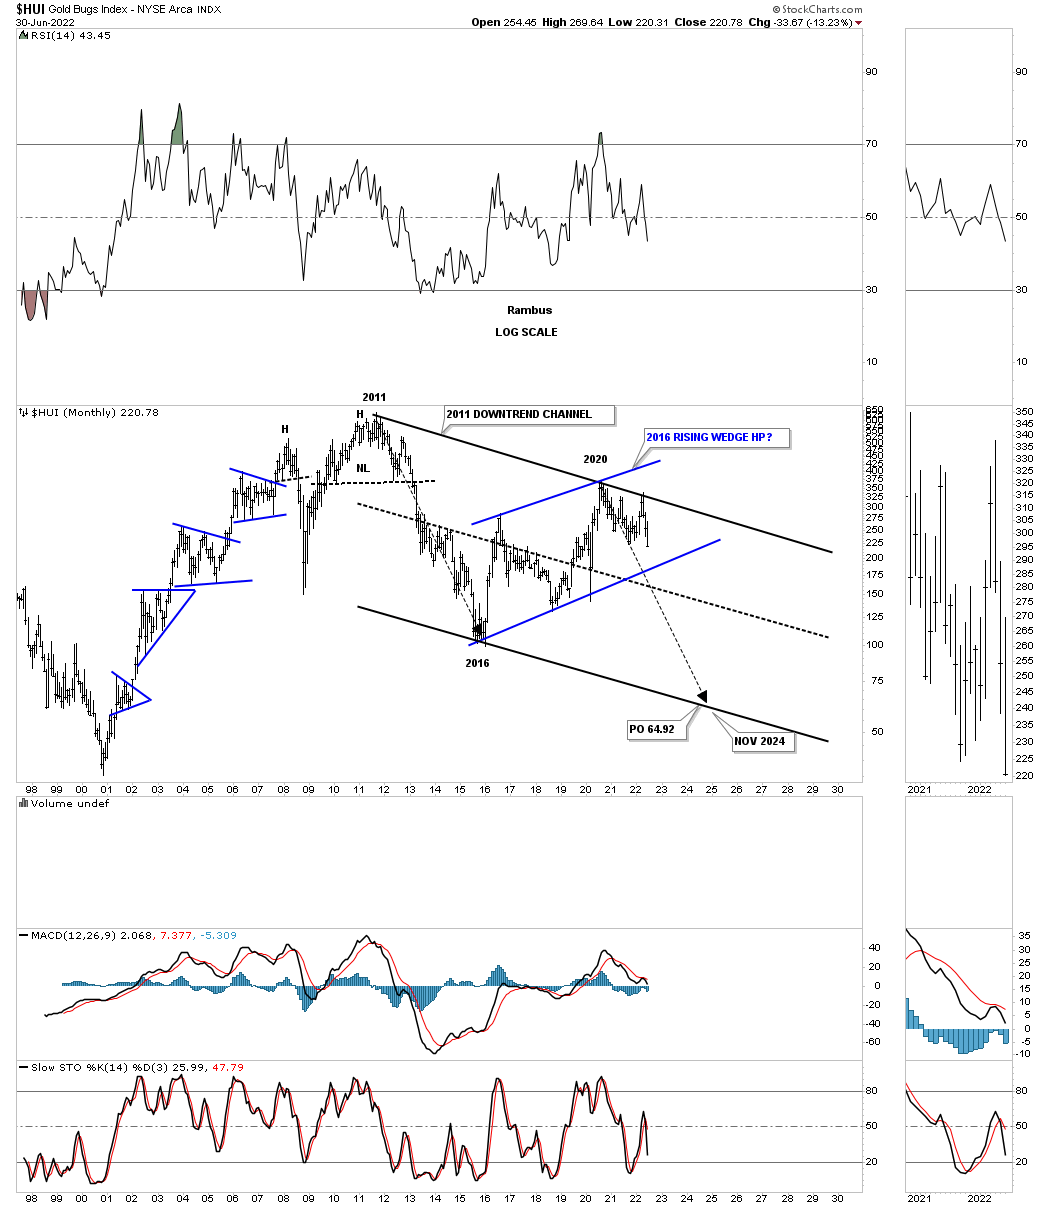
And then there is another possibility that few are even aware of which is the possible 2016 rising wedge formation. As you can see each important reversal point comes at an important top or bottom in the past five years or so. A touch of the bottom rail will complete the all important 4th reversal point in the rising wedge and is where the bulls need to step up and hold support. If they fail to do so the rising wedge will then be a consolidation pattern to the downside.
This longer term bar chart for the HUI shows how the 2016 rising wedge would look as a halfway pattern if the bottom blue trendline is broken to the downside.
This monthly chart for the GDX shows the 2013 brown shaded S&R zone, which has been holding support since the 2020 high, with the price action closing last week below it. During a strong impulse move down you will generally see a string of black candlesticks all in a row, with the end of June showing the third. Just the opposite in a strong impulse move up where you will see a string of white candlesticks.
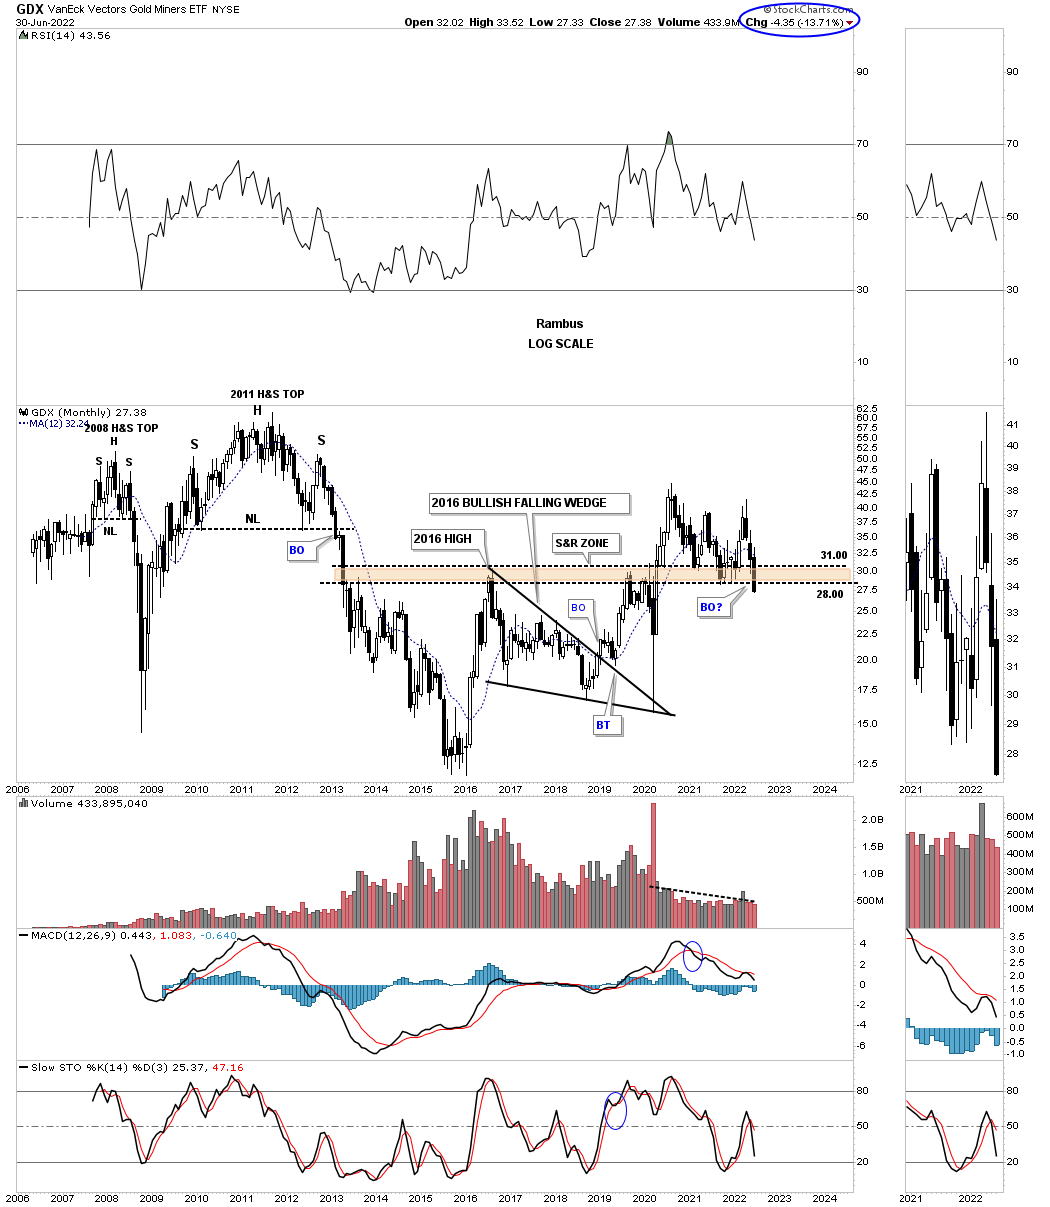
This next monthly chart for the GDX shows the price action hitting critical support last week where the bottom rail of the 2016 uptrend channel and the bottom rail of the possible blue bull flag intersect. The possible blue flag won’t be complete until the top rail is broken to the upside leaving the bulls with a lot of work on their hands if the 2016 trading range is going to be bullish. On the other hand if the bottom rail of the 2016 uptrend channel and the bottom rail of the possible blue bull flag give way then we’ll be left with a bearish rising channel.
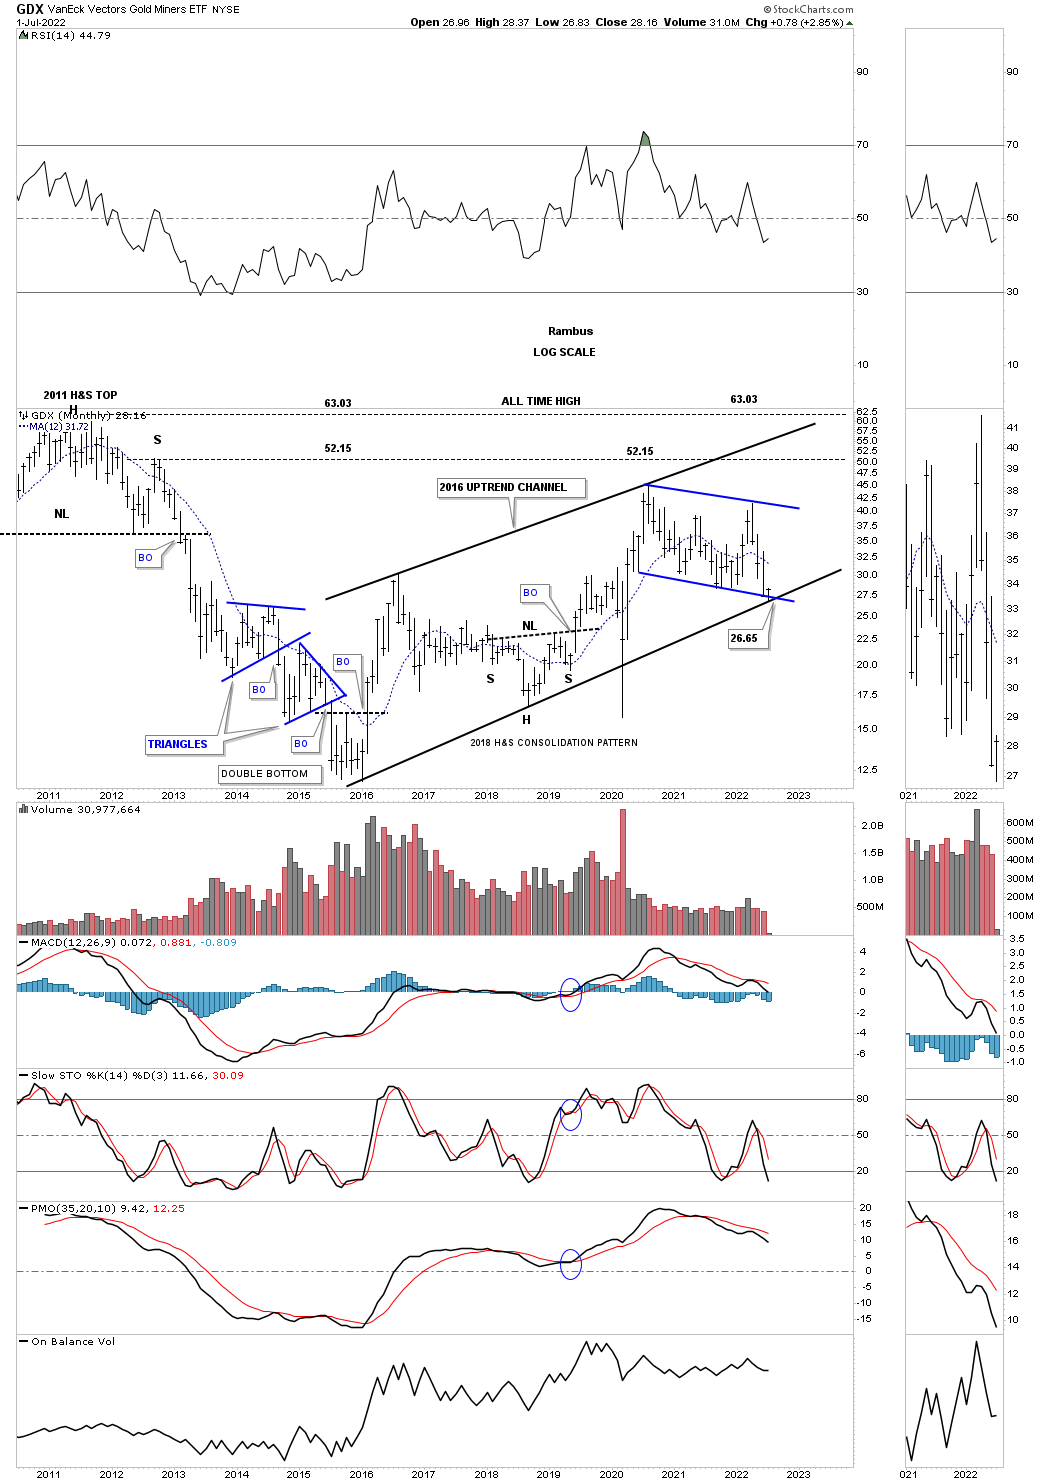
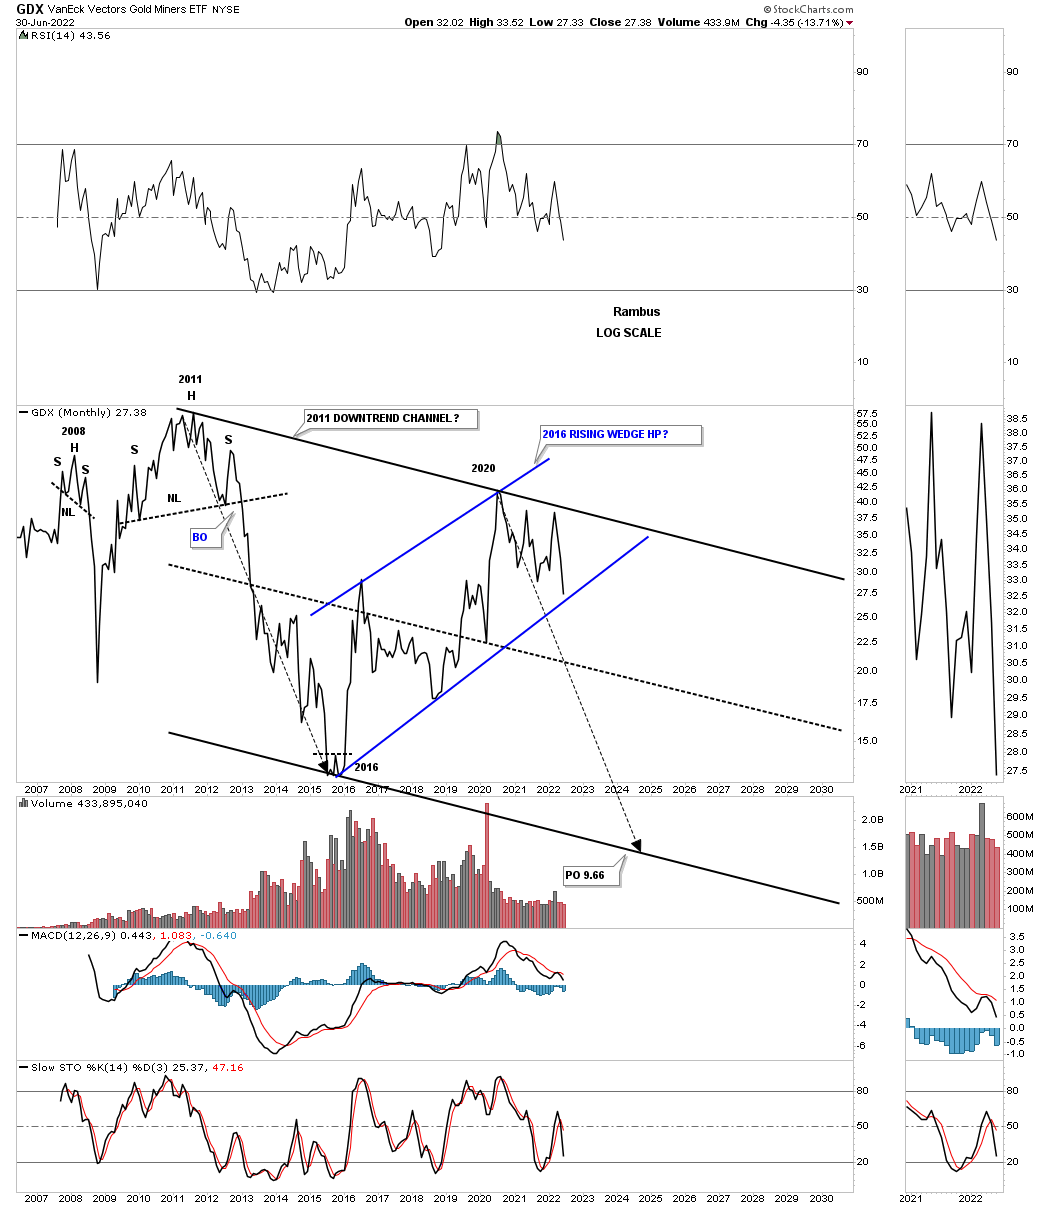
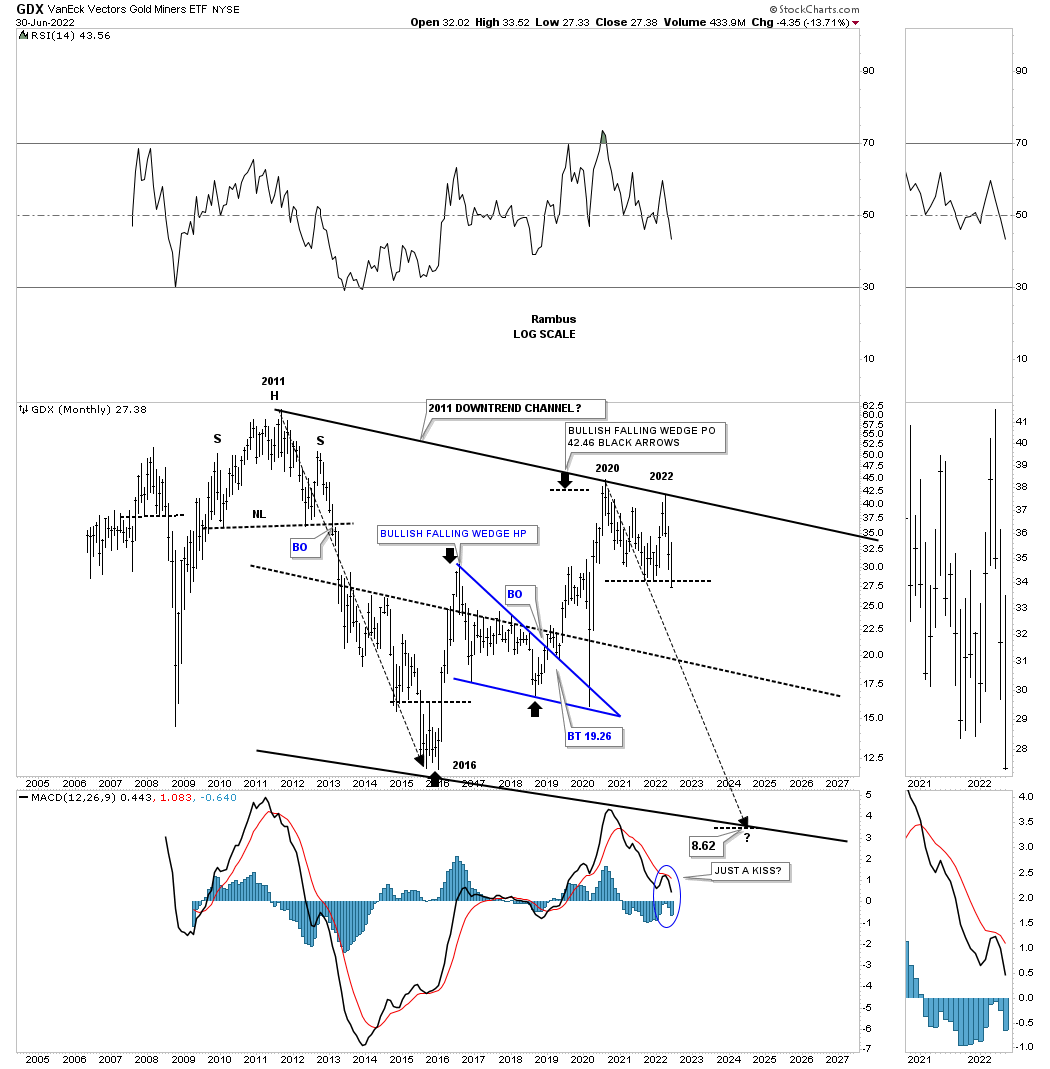
This monthly line chart shows how the blue rising channel would look in the 2011 downtrend channel as a possible halfway pattern to the downside.
The monthly bar chart for the GDX.
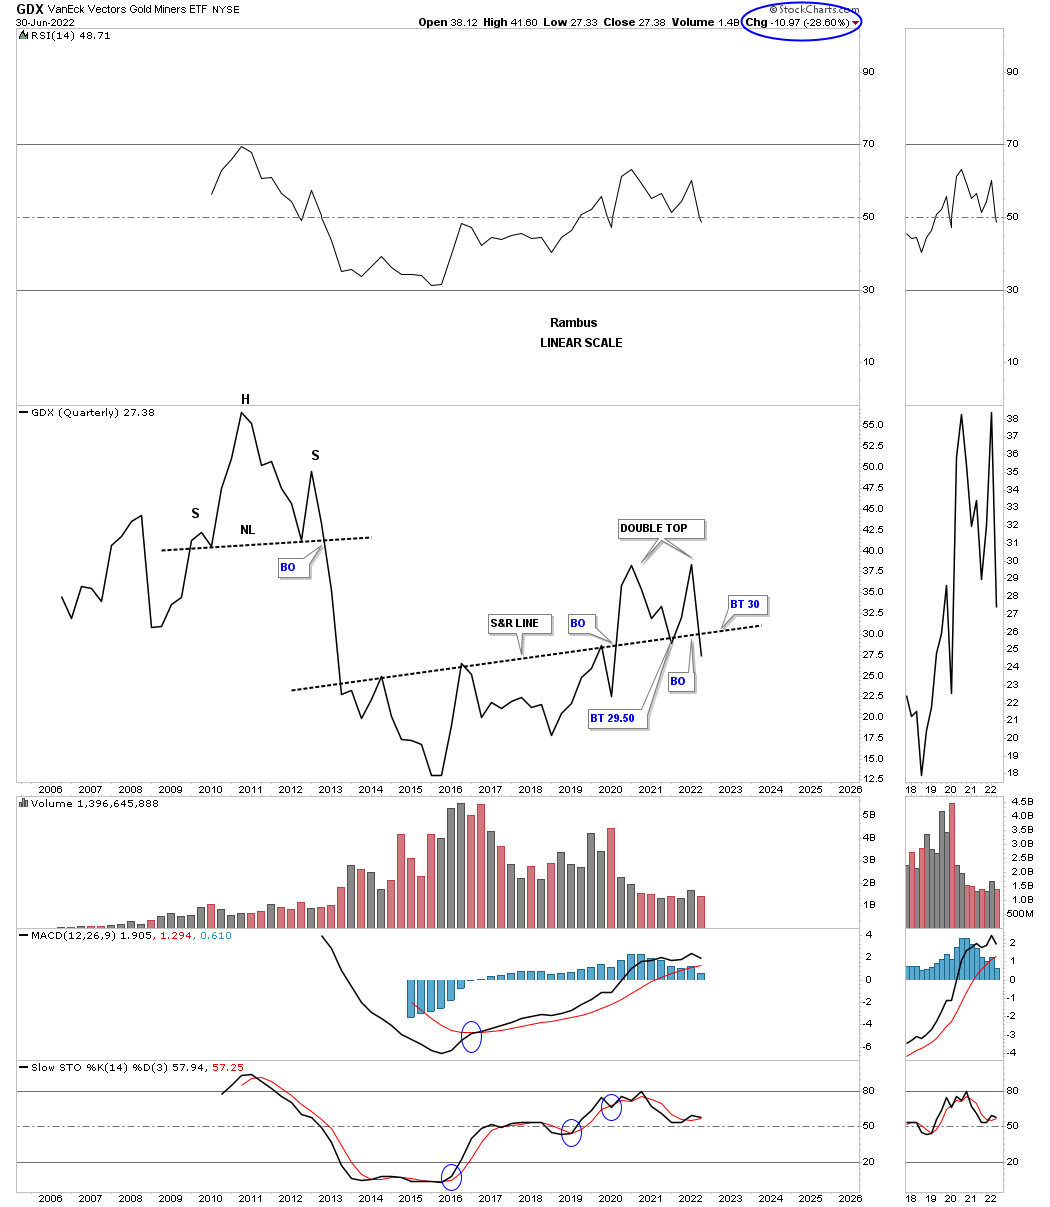
Something happened this quarter that I wasn’t excepting when the 2nd quarter began. This quarterly line chart for the GDX shows the price action closing the quarter below the S&R line going all the way back to 2013. I’ve been following that S&R line for many years and to see it give way like that was very interesting. As you can see I’ve labeled the price action above it as a double top reversal pattern which I have to admit I wasn’t expecting when the quarter began three months ago.
I’ve been mentioning for quite sometime that Silver and the GDXJ have been the weakest areas in the PM complex. This monthly line chart for the GDXJ, junior miners, closed the month of June below the bottom rail of its 2016 rising wedge formation. Now we’ll see if the bottom rail can hold resistance on the backtest...
* * *
Read Full Story »»»
DiscoverGold
GDX made a lower low today which means the 40 week cycle low isn't in but should happen this week
By: CyclesFan | July 5, 2022
• $GDX made a lower low today which means the 40 week cycle low isn't in but should happen this week. The daily cycle is on day 35 and may bottom any day now. In addition, there's significant support in the 26 area from the 4th quarter of 2019.

Read Full Story »»»
DiscoverGold
Don’t Be Fooled by the Daily Rally in Junior Miners
By: P. Radomski | July 5, 2022
Mining stocks moved higher on Friday, and you might be wondering if this was anything more than a daily breather – so let’s start today’s analysis with the GDXJ ETF.
In short, so far, we haven’t seen a good indication that the rally is anything more than a normal daily rebound. Even the very sharp declining, red, dashed resistance line remains unbroken.
Consequently, the trend remains down.
Now, the bigger of the orange rectangles that you see on the above chart just ended, which means that, based on the time analogy to the April-May decline, we might see a bigger corrective upswing shortly. However, it’s not very likely that this is going to be the case. The reason is that this time the decline was visibly smaller than it was before, and thus the GDXJ is not as severely oversold.
Additionally, there are good reasons (like the situation in the USD Index) to think that the precious metals sector is about to move much lower instead of rallying. I covered many of them in Friday’s flagship Gold & Silver Trading Alert.
So, won’t there be any corrective upswing this time? Well, based on Friday’s 3% upswing, it’s obvious that we already saw one, and based on the following chart, it seems that even seeing an additional small upswing would be a part of a bigger bearish pattern.
The GDXJ is after a breakdown below the head and shoulders formation, which is a very bearish fact for the following weeks. However, on a very short-term basis, it’s important to remember that breakdowns below those formations tend to be followed by a corrective rally back (or almost back) to the previously broken neck level.
That’s exactly what we saw on Friday, and if we see a move even closer to the neck level, it won’t make the situation bullish – it’s all part of a big, bearish pattern with a downside target slightly below $24.
Moreover, please keep in mind that despite Friday’s small upswing, the GDXJ just closed the week at the lowest level since the first half of 2020.
Amazingly bearish, isn’t it? So much money has been printed in the last 2 years, and there’s a war in Europe, yet junior miners are trading at lower levels.
Speaking of weakness and major breakdowns, here’s what silver did recently.
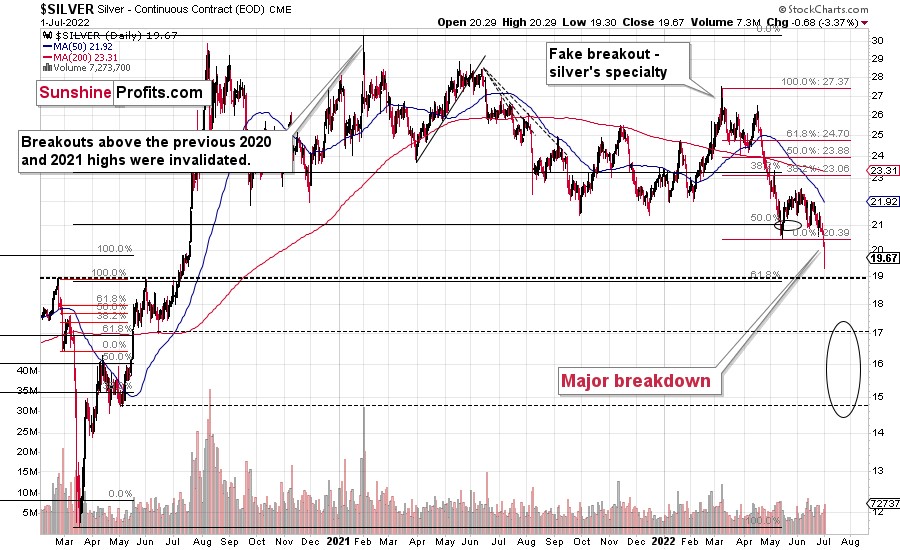
The white metal corrected part of its decline, but it still ended $0.68 lower on Friday, which was the lowest daily and weekly close since mid-2020. This is profoundly bearish.
Remember when everyone and their brother thought that silver was about to soar to the moon in early 2021? When (with silver close to $30) I warned that while I agree that it’s eventually likely to do it, it’s very unlikely to happen without a bigger decline first?
While silver might correct this breakdown and move back to $20.5 or so, it’s quite likely that the breakdown will hold.
The real bearish fireworks are likely to start once gold breaks below its own head and shoulders pattern, though.
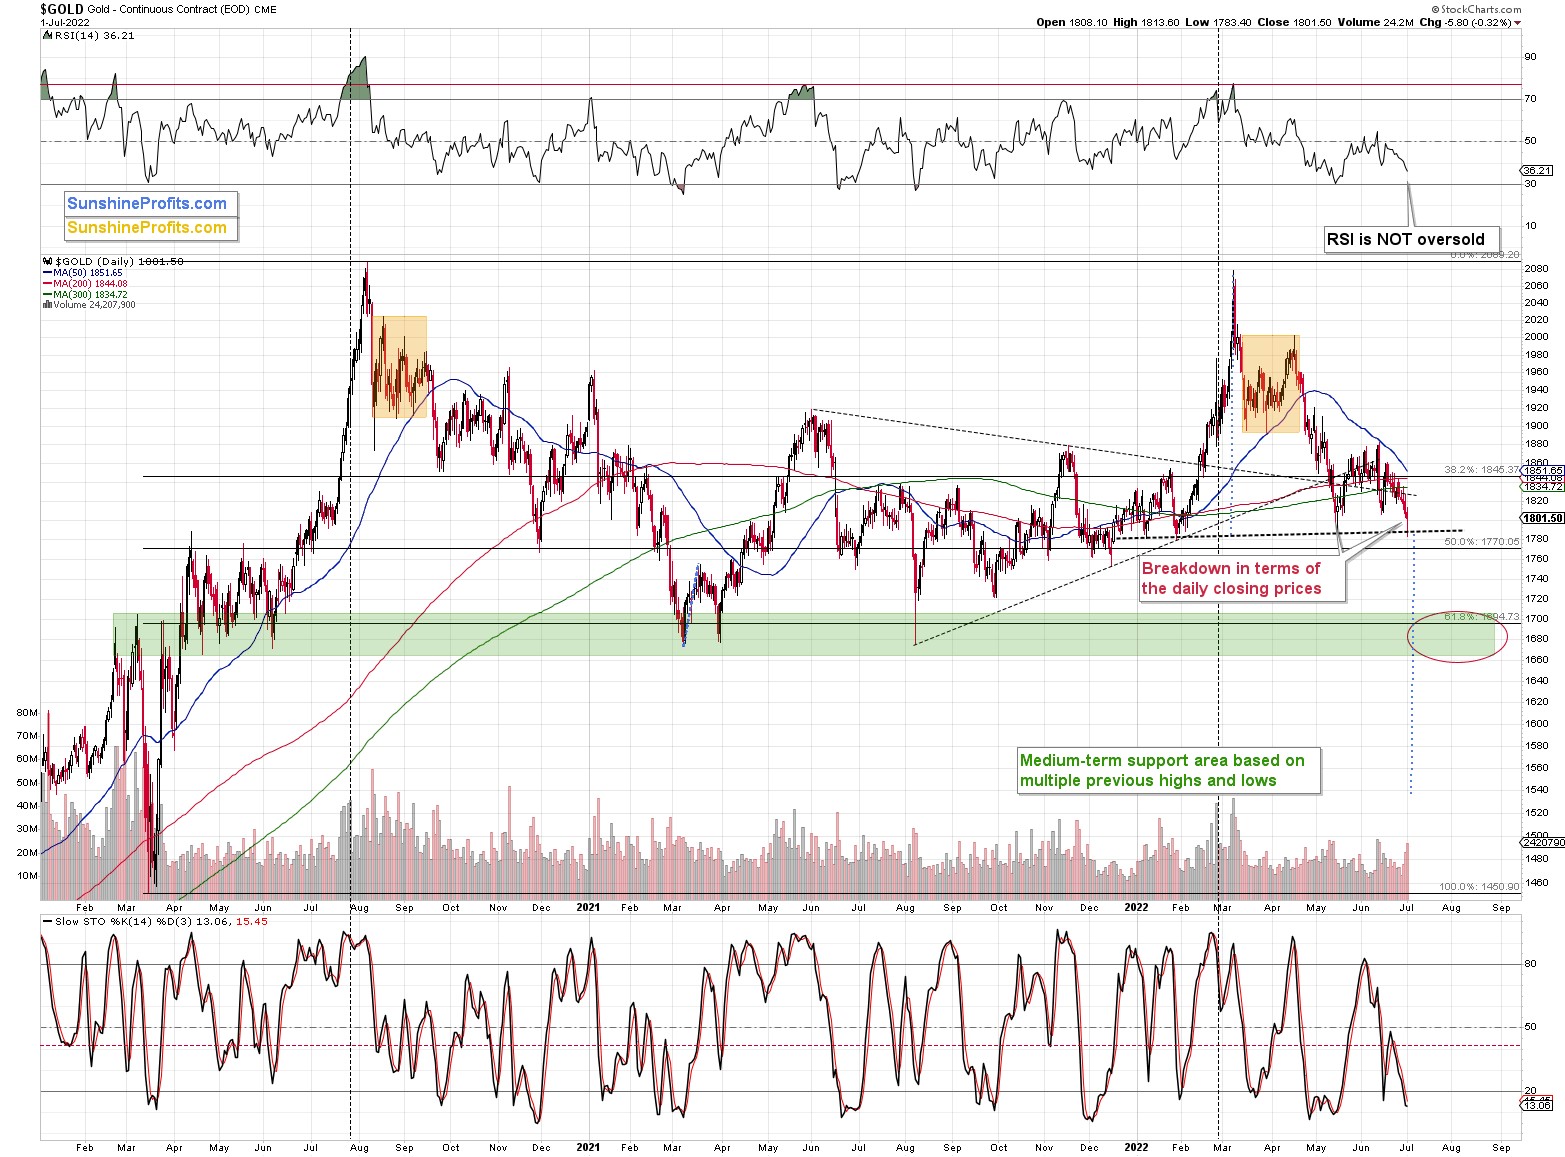
Gold touched the neck level based on the previous lows on Friday (July 1), but it didn’t break below it. Once it does, it’s likely to fall significantly. The target based on the formation is about $1,540. However, since we have a strong support area close to the 2021 lows, I think that seeing an interim bottom close to them is a likely outcome.
If only there was some kind of trigger that could push gold prices lower and make them complete the H&S formation.
Oh wait, there is one – a major one.
The USD Index is trading very close to the 105 level, and while it didn’t manage to break to new highs on Friday, its persistence is quite clear. It only has to confirm the breakout once for the bullish floodgates to be opened.
Given the rising real interest rates in the U.S. that are rising at a faster pace than the ones in the Eurozone, it seems that the USDX will continue to move to higher levels in the following weeks and months.
Therefore, it seems that the breakout and its confirmation are just a matter of time, and given that the corrective downswings after the attempts to break above the 105 level are getting smaller and smaller, it’s likely that we won’t have to wait too long for the USDX to show this material strength.
This, in turn, means that gold would be likely to break below its head and shoulders pattern, and junior miners would be likely to continue their massive slide after a brief correction. While I can’t promise any kind of performance, it seems that the profits on our short positions in junior miners are likely to increase even more.
Summary
Summing up, it seems to me that the short-term rally in the precious metals market is over, and the decline will now continue.
As investors are starting to wake up to reality, the precious metals sector (particularly junior mining stocks) is declining sharply. Here are the key aspects of the reality that market participants have ignored:
1. rising real interest rates,
2. rising USD Index values.
Both of the aforementioned are the two most important fundamental drivers of the gold price. Since neither the USD Index nor real interest rates are likely to stop rising anytime soon (especially now that inflation has become highly political), the gold price is likely to fall sooner or later. Given the analogy to 2012 in gold, silver, and mining stocks, “sooner” is the more likely outcome.
Read Full Story »»»
DiscoverGold
Gold miner selling triggers a Panic Breadth Composite extreme
By: Jason Goepfert | July 5, 2022
• Gold bugs should be used to disappointment, but the latest round of selling has to be especially painful. It comes on the heels of what had been impressive momentum, which had a good track record of continuing. Not this time, and last week the selling pressure was enough to trigger a true extreme in a Panic Breadth Composite.
Read Full Story »»»
DiscoverGold
GDX - Given the bullish reversal on Friday and since it closed above the 0.618 ret. of the 2020 bull, the 40 week cycle low is probably in
By: CyclesFan | July 3, 2022
• $GDX - Given the bullish reversal on Friday and since it closed above the 0.618 ret. of the 2020 bull, the 40 week cycle low is probably in. A close above 29.78 or the 10 week MA will confirm it. Once confirmed I expect a rally into August before the next leg down into 2023.

Read Full Story »»»
DiscoverGold
IMS ramping up new reserve currency with China and Russia, and India. US has exhausted its rule with the dollar watered down and weaponizing it against the very countries who will follow BRICs new currency based on gold. I dont think US can base dollar on gold anymore, i think reserves are not what they say, and migration to new reserve will accelerate at warp speed once the world knows it. Steve Mnuchin went to the vaults right after getting in office, he only take away statement was "the gold is safe" really now, was that 10 bars are safe or 10k bars, he didnt say, and in another discussion his actions as Treasurer seemed to reflect the lack of reserves per dollar.
i see gold going up so fast its gonna give people whiplash, johnny whiplash.
Forecast: What's Next for Gold
By: Jim Curry | July 3, 2022
Recapping Last week
Gold saw its high for last week registered in Monday's session, here doing so with the tag of the 1842.80 figure. From there, a sharp decline was seen into late week, with the metal dropping all the way down to a Friday low of 1783.40 - before bouncing off the same into the daily/weekly close.
Gold Market, Short-Term
For the very short-term, the downward phase of the 10-day cycle is still deemed to be in force, with the same now at 13 trading days along from its last labeled low, with this wave shown again on the chart below:
As mentioned last weekend, the next smaller-degree bottom is expected to come from this same 10-day wave. In terms of price, any reversal back above the 1815.10 figure (August, 2022 contract) - if seen at any point - would be our best indication of a turn higher with the same, thus making this a key level heading into the new week.
Otherwise, holding below the aforementioned 1815.10 figure will keep the downward phase of this 10-day wave intact, still with the potential for lower lows before it bottoms. Going further, this upside reversal point of 1815.10 could continue to drop going forward - depending on the action - with the most up-to-date numbers always noted in our thrice-weekly Gold Wave Trader report.
Gold's Stepped-Back View
.
Stepping back slightly, as noted in recent months, the bigger rally phase came from our larger 72-day cycle, which last bottomed out with the mid-May tag of the 1791.20 figure. Here again is that 72-day component:
In terms of price, there were two upside targets for the recent rally phase of this 72-day cycle. The first was to the upper 72-day cycle band (bright green), and which ended up being met with the June 13th spike up to the 1882.50 figure.
The second target was back to the 72-day moving average for Gold - which was not hit during the most recent upward phase of this wave. This action is an anomaly, since 85% of the upward phases of this 72-day cycle will see a reversion back to this key moving average. This particular setup has been true throughout the up-and-down phases of this 72-day wave, going back many decades.
Having said the above, with Friday's break below the 1791.20 figure, this 72-day cycle had to have topped out with the 1882.50 swing high - made at this upper 72-day cycle band. With that, the metal is likely heading on down into a much larger-degree low, now expected to come from the 310-day cycle, and shown again on the chart below:
In terms of time, the next trough for this bigger 310-day component is projected for the Autumn of this year (October, plus or minus). From whatever low that does form with this wave, the probabilities will favor a larger-degree rally of some 20-25% or more playing out into May of 2023 or later. This 20-25% rally range is the average statistical zone for the upward phases of this 310-day cycle.
With the above said and noted, the most recent swing high of 1882.50 now becomes a key dividing line going forward. That is, any push above that figure - if seen at any point - would be our indication of a 310-day cycle bottom set in place.
This 1882.50 figure is also the 'trigger' for the aforementioned rally of 20-25% or more, as the next upward phase of this 310-day wave assumes control, following an Autumn bottom. This 1882.50 figure is obviously well above current prices, though is a number which should continue to drop, as we move along.
For the in-between view, even with the confirmed turn south with the 72-day cycle, we could be at or nearing a short-term bottom for Gold; it could even have formed in Friday's session. That is, a confirmed turn with one cycle will often see an immediate reversal in the opposite direction - normally coming from a wave of the next smaller-degree degree.
With the above, this means a nice short-term rally should soon develop with the smaller 10 and 20-day cycles, though we would now expect that rally to end up as a countertrend affair - holding below the 1882.50 swing top. From there, a push back to lower lows for the bigger 310-day cycle downward phase into the Autumn months, before the next mid-term trough forms for the metal. Stay tuned.
Read Full Story »»»
DiscoverGold
Gold Stocks Are Extremely Oversold
By: Jordan Roy-Byrne | July 3, 2022
Gold stocks have broken down technically, but they are extremely oversold.
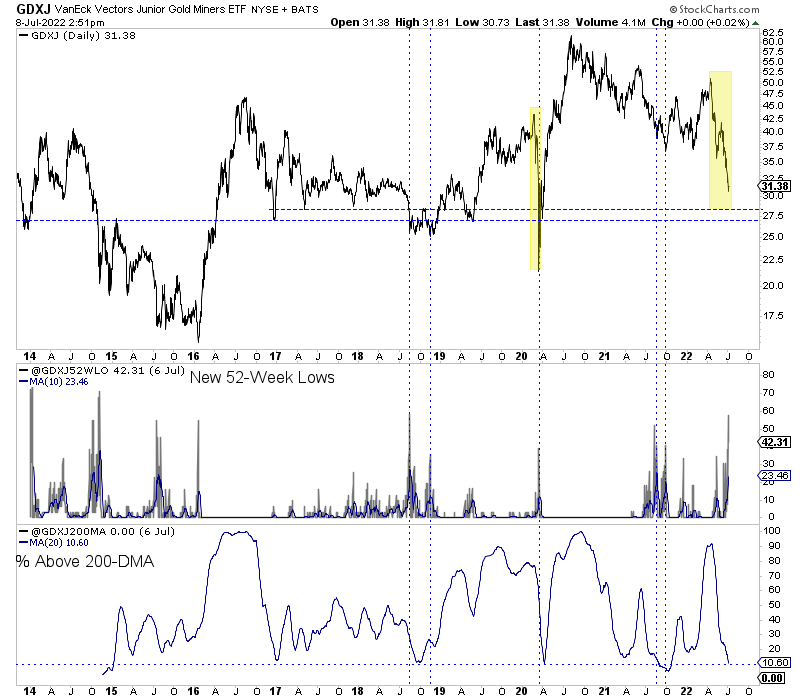
Let’s start with GDXJ, which is rebounding today after testing support at $32.
The chart below plots GDXJ along with four breadth indicators, including new 52-week lows and a 50-day rate of change. The blue lines mark where the percentage of GDXJ stocks above all the moving averages is similar, and the red lines mark where the percentage of GDXJ stocks above only the 20-day and 50-day moving averages are identical.
GDXJ is arguably the most oversold or the second most oversold (Covid crash) in the last six years. When the market is this oversold, it typically enjoys, at worst, a decent rebound.
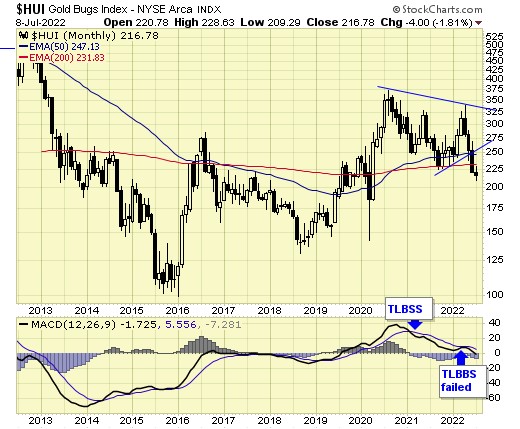
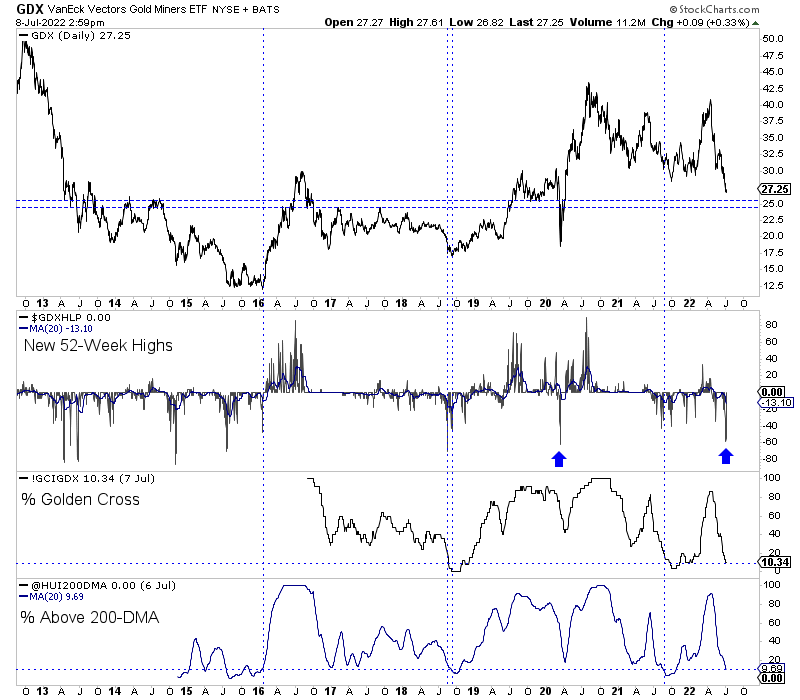
Meanwhile, the HUI Gold Bugs Index looks similar. It traded as low as 216 Friday, which is less than 5% from strong support.
No HUI stocks are trading above the 20-day, 50-day, and 200-day moving averages, and yesterday 48% of GDX stocks (all HUI stocks are in GDX) made a new 52-week low. In the last six years, the only time new 52-week lows spiked that high were at the 2018 and 2020 (Covid crash) bottoms.
The macro is also lining up in Gold’s favor as the 2-year yield plunged to as low as 2.72% this morning, inflation expectations have rolled over, and the Atlanta Fed model shows we are in a recession. The market is now aggressively pricing in rate cuts in 2023.
Later this month, the Fed will likely take rates up to 2.50% to 2.75%. Should the 2-year yield and inflation expectations continue to fall, this will certainly be the Fed’s final rate hike. It makes sense that precious metals would bottom right before the last rate hike.
Now is the time to be a buyer of weakness.
Read Full Story »»»
DiscoverGold
Jack Chan: Gold Price Exclusive Update
By: Jack Chan | July 2, 2022
Our proprietary cycle indicator is down.
To public readers of our updates, our cycle indicator is one of the most effective timing tool for traders and investors. It is not perfect, because periodically the market can be more volatile and can result in short term whipsaws. But overall, the cycle indicator provides us with a clear direction how we should be speculating.
Investors
During a major buy signal, investors can accumulate positions by cost averaging at cycle bottoms, ideally when prices are at or near the daily 200ema.
During a major sell signal, investors should be hedged or in cash.
Traders
Simply cost average in at cycle bottoms when prices are at or near the daily 200ema; and cost average out at cycle tops when prices are above the daily 50ema.

Gold sector is on long term SELL signal as the recent buy signal has failed.
The correction since 2020 drags on.

GLD is on short term sell signal.
GDX is on short term sell signal.
XGD.to is on short term sell signal.
GDXJ is on short term sell signal.
Analysis

Speculation now at the lowest level in two years.
Our ratio is on sell signal.

Trend is up for the dollar.
Trend is now down for gold stocks.
Trend is now down for gold also.

The decade long cup with handle remains in progress.
Summary
Long term – on SELL signal.
Short term – on sell signals.
Gold sector cycle is down.
$$$ We are now holding trading positions as no core positions should be held during a long term sell signal.
Read Full Story »»»
DiscoverGold
NY Gold Futures »» Weekly Summary Analysis
By: Marty Armstrong | July 2, 2022
The NY Gold Futures closing today at 180150 is immediately trading down about 1.48% for the year from last year's settlement of 182860. Caution is now required for this market is starting to suggest it will deline further on a monthly level. Immediately, this market has been rising for this month going into July reflecting that this has been only still a bullish reactionary trend. As we stand right now, this market has made a new low breaking beneath the previous month's low reaching thus far 178340 while it's even trading beneath last month's low of 180250.
Up to now, we still have only a 1 month reaction rally from the low established during May. We must exceed the 3 month mark in order to imply a trend is developing.
ECONOMIC CONFIDENCE MODEL CORRELATION
Here in NY Gold Futures, we do find that this particular market has correlated with our Economic Confidence Model in the past. The Last turning point on the ECM cycle low to line up with this market was 2015. The Last turning point on the ECM cycle high to line up with this market was 2020 and 2011 and 1996.
MARKET OVERVIEW
NEAR-TERM OUTLOOK
The historical perspective in the NY Gold Futures included a rally from 2015 moving into a major high for 2020, the market has been consolidating since the major high with the last significant reaction low established back in 2015. The market is still holding above last year's low but is trading rather weak at this moment. The last Yearly Reversal to be elected was a Bullish at the close of 2020.
This market remains in a positive position on the weekly to yearly levels of our indicating models.
Looking at the indicating ranges on the Daily level in the NY Gold Futures, this market remains in a bearish position at this time with the overhead resistance beginning at 180610.
On the weekly level, the last important high was established the week of June 13th at 188250, which was up 4 weeks from the low made back during the week of May 16th. We have been generally trading down for the past 2 weeks, which has been a very dramatic move of 5.264% in a stark panic type decline.
Looking at this from a broader perspective, this last rally into the week of June 13th reaching 188250 failed to exceed the previous high of 200300 made back during the week of April 18th. That rally amounted to only four weeks. Subsequently, the market has breached that low of the week of May 16th but has closed back above it and is holding for now. Right now, the market is below momentum on our weekly models casting a bearish cloud over the price action. Looking at this from a wider perspective, this market has been trading up for the past 13 weeks which from a timing perspective warrants concern.
INTERMEDIATE-TERM OUTLOOK
YEARLY MOMENTUM MODEL INDICATOR
Our Momentum Models are declining at this time with the previous high made 2020 while the last low formed on 2021. However, this market has rallied in price with the last cyclical high formed on 2020 and thus we have a divergence warning that this market is starting to run out of strength on the upside.
Critical support still underlies this market at 175200 and a break of that level on a monthly closing basis would warn that a sustainable decline ahead becomes possible. Nevertheless, the market is trading below last month's low warning of weakness at this time.
DiscoverGold
Final Squiggles in Metals
By: Avi Gilburt | June 30, 2022
• Following the Elliott Wave analysis:
As I have been outlining for several weeks now, we have some really nice positive divergences set up on the higher time frame charts, suggesting the metals complex is likely bottoming out.
The questions I have been having is how deep do the GDX and silver charts take us?
Well, when I look deeper into the GDX chart, I am seeing us in a final 5th wave of its c-wave, which is taking shape as an ending diagonal. And, even within that diagonal, I am questioning how deep it takes us. I am following two micro counts right now. If the a-b is in place as shown in the yellow count, then we have a [1][2] structure pointing us down for a 5-wave c-wave extension at the bottom of our target box in the 27 region. The micro resistance box on the 8-minute GDX chart is the resistance for the deeper yellow c-wave potential.
However, if the market is able to break out over the micro resistance box, then it is likely we will complete this (b) wave at the upper end of the target box (if we have not already bottomed). But, ultimately, I need to see an impulsive rally through the 29.30 level to provide us with an initial signal that a bottom is in place. That break out through 29.30 will likely point us up towards the 31 region for wave 1 of wave (i) of the next major rally phase in the GDX I am expecting to begin once we complete this bottoming structure.
The reason I am looking for the 31 region as our target for wave 1 of (i) is because that is where this ending diagonal began. And, when an ending diagonal completes, we often see a very strong reversal back to the region from which it began.
As far as silver, the structure to downside also looks like an ending diagonal for the c-wave of wave [2]. And, I would still imagine we can see a marginal lower low.
With regard to GLD, well, there is nothing to add. The structure is overlapping and I do not expect any impulsive rally in that chart. The next move higher will likely be an a-b-c structure for the 5th wave of the expanding ending diagonal.
In summary, I think we are in the final squiggles of the decline in the metals complex. And, when we see a strong reversal in both GDX and silver (both of which are in ending diagonal structures), then we will have a strong signal that a bottom has likely been struck.

GDX8min

GDXdaily

GLDdaily

Silver-144min
Read Full Story »»»
DiscoverGold
Gold & Silver Volatility: Investor Tactics Now
By: Morris Hubbartt | July 2, 2022
SGS Key Charts, Signals, & Video Analysis
Super Force Signals (SFS) is being rebranded as Super Gold Signals (SGS at https://supergoldsignals.com), to reflect the growing global importance of gold.
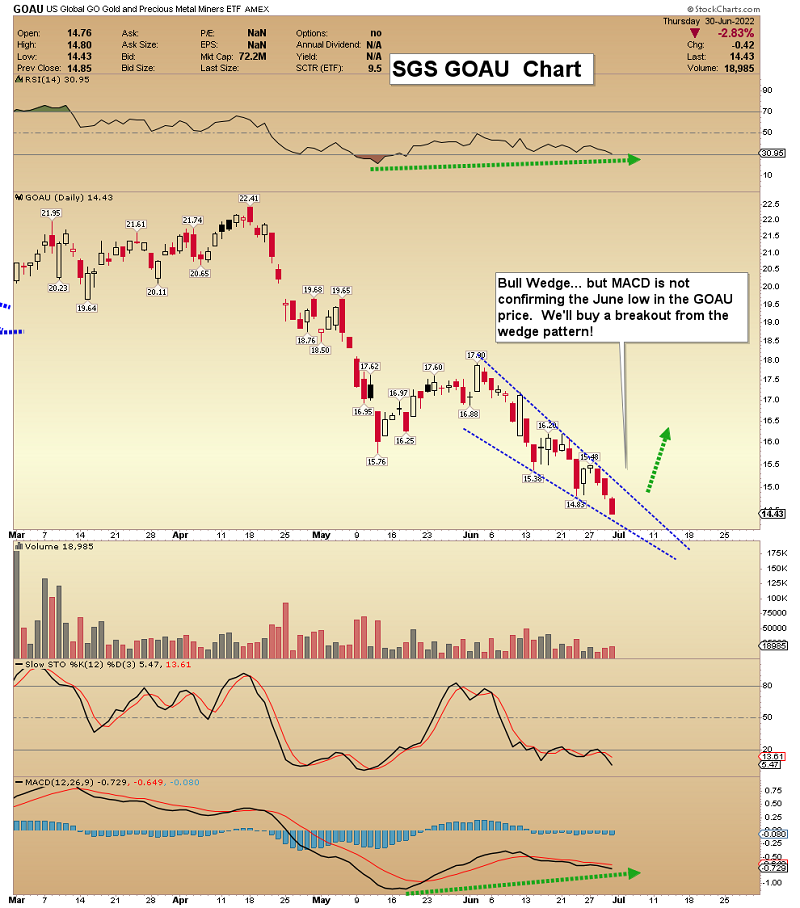
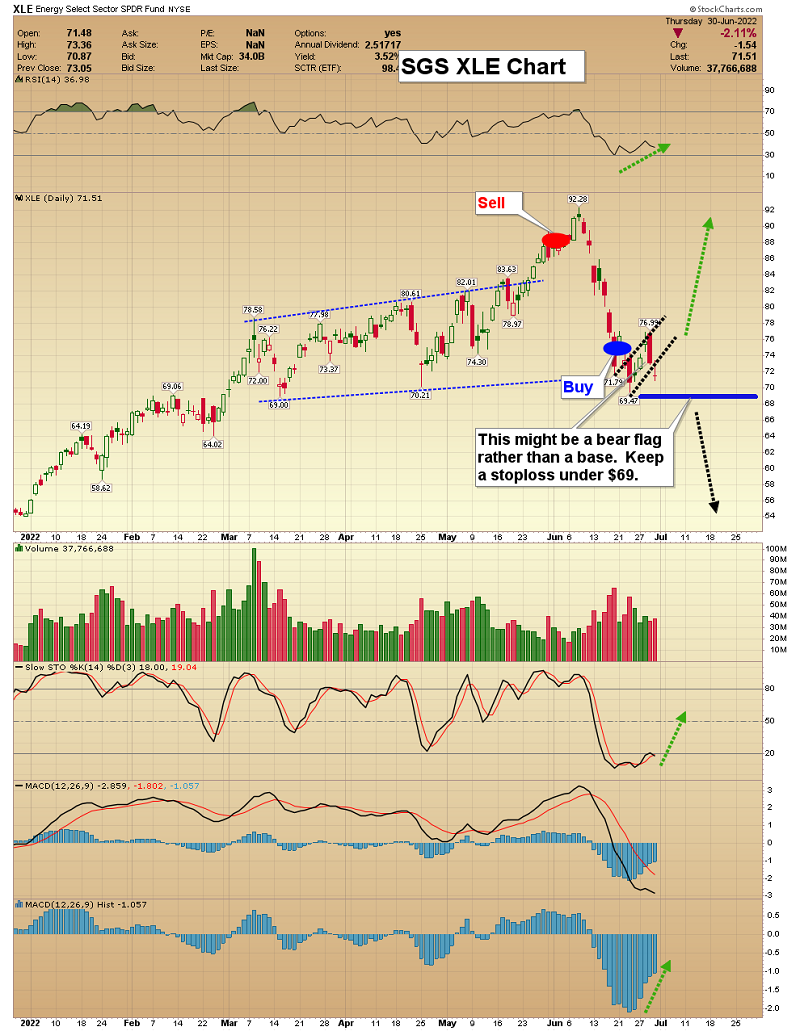
SG60 Key Charts, Signals, & Video Analysis

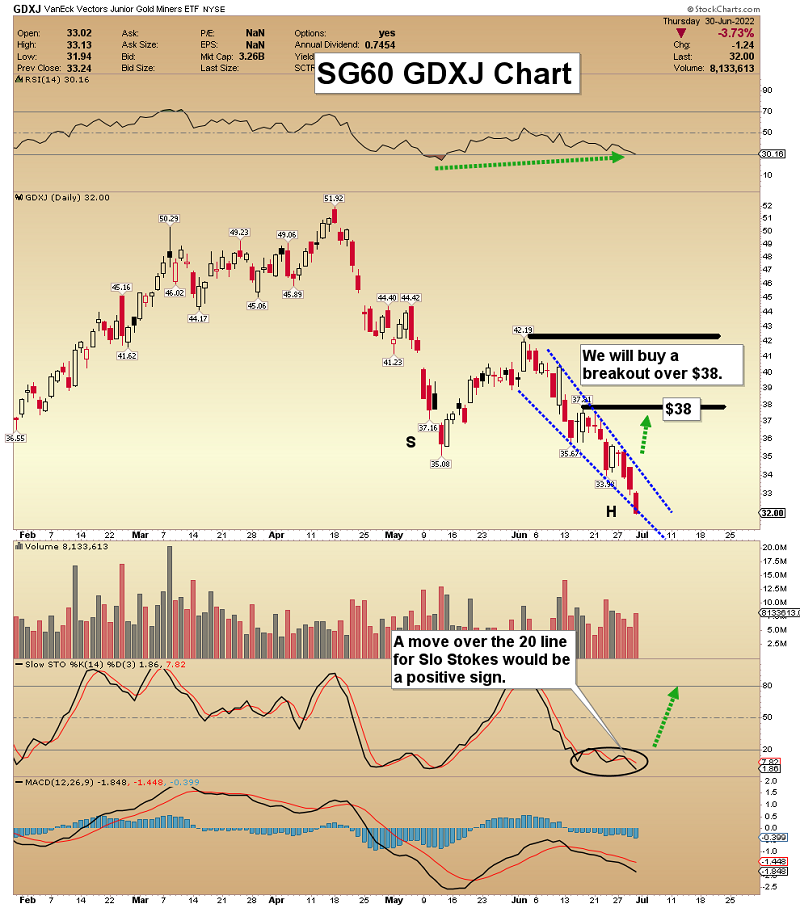
My SG60 service is ideal for investors who like some short-term action and core positions for intermediate gold/silver miners, growth stocks, oil stocks, commodity stocks, regional banks, and big-name cryptos... with live trade alerts by email. The SG60 subscription is just $229 per year, but I have a super special this week of $199 for 14 months to celebrate America's birthday weekend! If interested, please use this sign-up link or send me an email. Thank-you!
SGT Key Charts, Signals, & Video Analysis
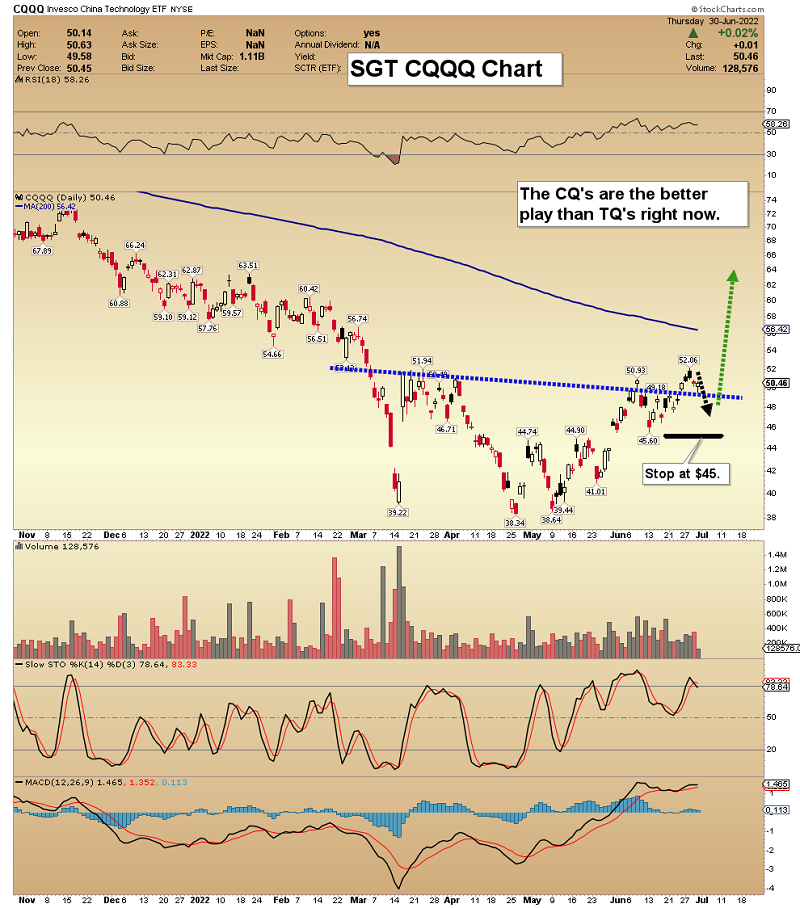
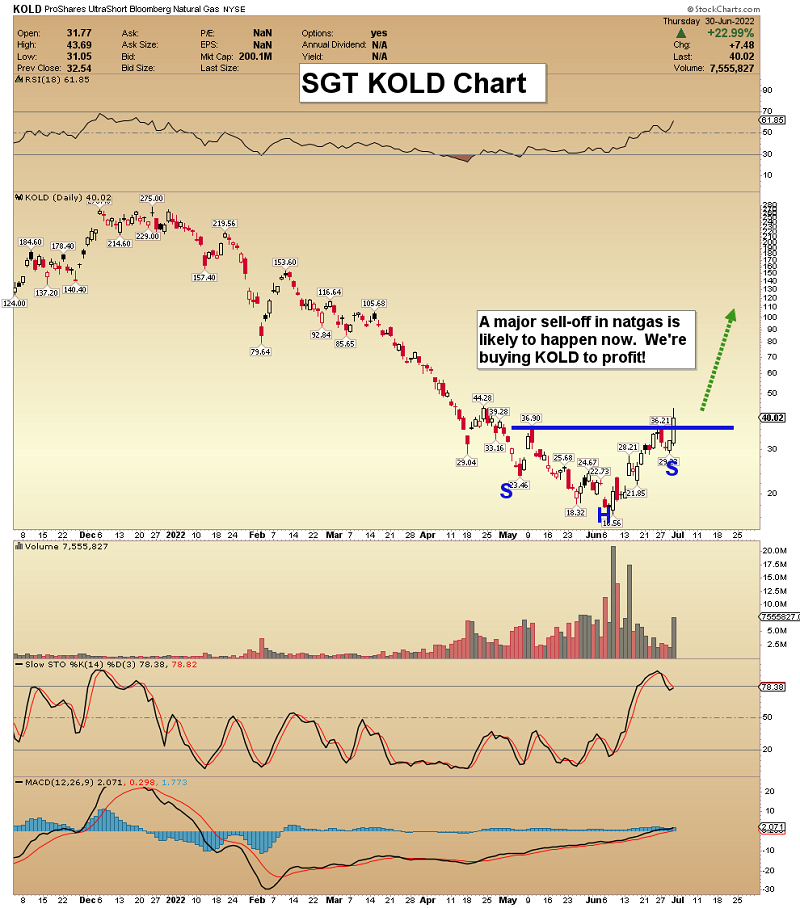
SGJ Key Charts, Signals, & Video Analysis
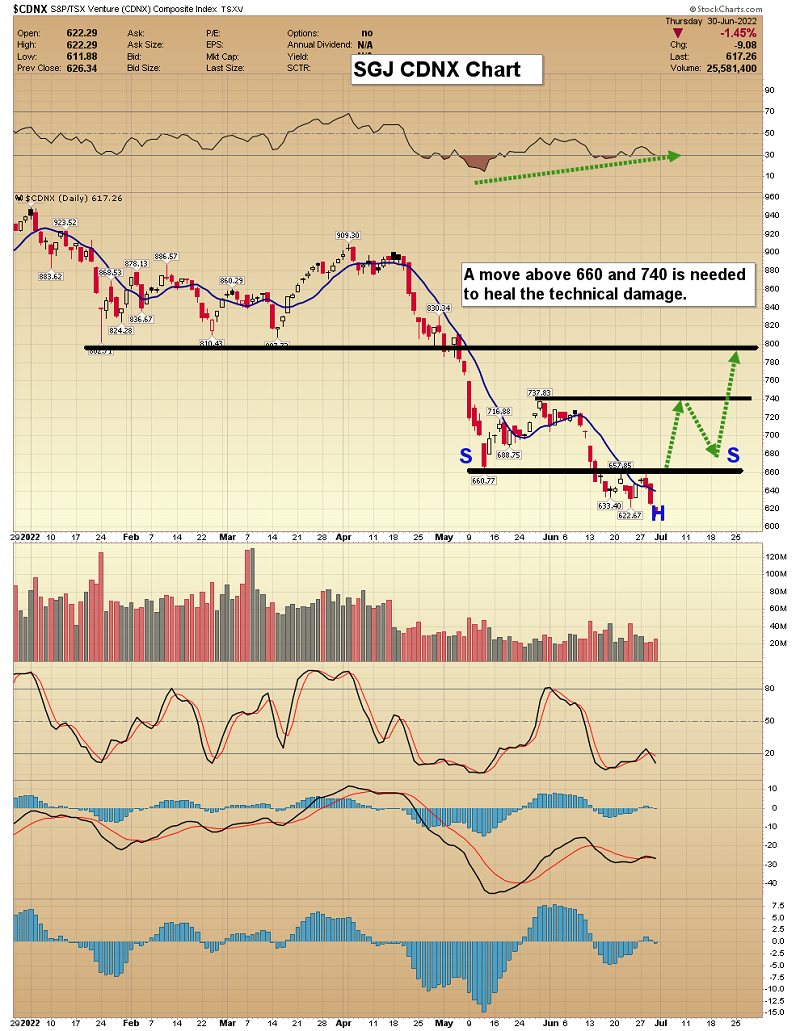
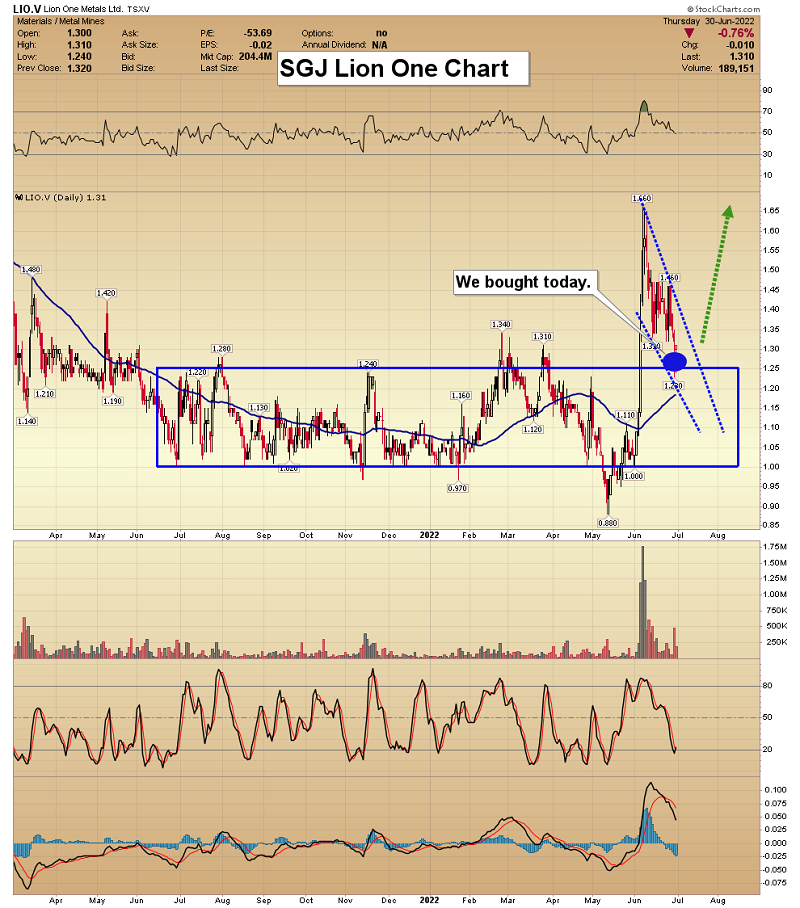
Read Full Story »»»
DiscoverGold
COT - Commitments of Traders in Metals Futures Market Reports
By: Software North | July 1, 2022
Gold
Silver
Read Full Story »»»
DiscoverGold
|
Followers
|
149
|
Posters
|
|
|
Posts (Today)
|
0
|
Posts (Total)
|
5670
|
|
Created
|
06/29/08
|
Type
|
Free
|
| Moderators DiscoverGold trunkmonk | |||

http://www.vaneck.com/index.cfm?cat=3192&tkr=GDX&LN=3-02
The Gold Miners ETF seeks to replicate as closely as possible, before fees and expenses, the price and yield performance of the NYSE Arca Gold Miners Index. The Index provides exposure to publicly traded companies worldwide involved primarily in the mining for gold, representing a diversified blend of small-, mid- and large-capitalization stocks. As such, the Fund is subject to the risks of investing in this sector.
| ||||||||||||||||||||||||||||||||||||||||||||||||||||||||||||||||||||||||||||||||||||||||||||||||||||||
| DAILY |
| WEEKLY |
| Volume | |
| Day Range: | |
| Bid Price | |
| Ask Price | |
| Last Trade Time: |


