 News
News  Market Data
  Discover
Support: 888-992-3836
Copyright © 2023 InvestorsHub Inc.


Register for free to join our community of investors and share your ideas. You will also get access to streaming quotes, interactive charts, trades, portfolio, live options flow and more tools.
$GDX - Recall I warned of the 'Dark Cloud Cover' Candle end of last week...
By: Sahara | October 31, 2024
• $GDX - Recall I warned of the 'Dark Cloud Cover' Candle end of last week.
Now been Bearishly Confirmed, and has taken the 50% Level of the Big Bullish Candle. If it fails at the first MA's it will aim for the Bear 'Wedge' Targets (Not displayed See Fibs)

Read Full Story »»»
 DiscoverGold
Bull of the Day: Agnico Eagle Mines (AEG)
By: Zacks Investment Research | October 30, 2024
Although it hasn’t received the airtime it deserves, gold prices have been rocketing higher this year. With more new record highs this week, gold has outperformed the S&P 500 by a significant margin year-to-date and since the start of 2023. Not surprisingly, gold miner stocks like Agnico Eagle Mines (AEG) have also performed well this year.
Agnico Eagle Mines has everything a gold investor could ask for, including a rock-solid balance sheet, strong stock price momentum, huge earnings growth forecasts and a reasonable valuation. Furthermore, the stock boasts a top Zacks Rank, significantly increasing the odds of a further near-term rally.

Image Source: TradingView
Powerful Earnings Revision Trend in AEG
As the price of gold rallies, gold mining stocks enjoy immediate expansion in their margins, Agnico Eagle Mines included. Today, AEG has a Zacks Rank #1 (Strong Buy) rating, reflected by significant revisions higher to its earnings estimates.
Analysts have nearly unanimously upgraded earnings forecasts over the last two months, with FY25 earnings estimates jumping by a hefty 23.4% over the last 60 days. FY24 earnings estimates have also been revised higher by 9.9% and are projected to climb 79.8% YoY to $4.01 per share. Over the next three to five years EPS are expected to grow at an impressive 28.2% annually.
It is also worth noting that the Mining – Gold Industry currently sits in the Top 4% (9 out of 251) of the Zacks Industry Rank, and that the Zacks Earnings ESP is projecting the next earnings period to be analysts estimates by 5.82%.

Image Source: Zacks Investment Research
AEG Stock Technical Setup
Rounding the compelling investment opportunity in Agnico Eagle Mines stock is a technical trading setup. Over the last week or so, the price action has been forming a bull flag from which investors can easily measure a trade.
If the stock can trade above the $88.75 level, it would signal a technical breakout. Alternatively, if the stock loses the $86 level of support, it may be worth waiting for another opportunity.

Image Source: TradingView
Should Investors Buy Agnico Eagle Mines Shares?
Agnico Eagle Mines is currently trading at a one year forward earnings multiple 0f 21.6x, which is below the broad market average and well below its 10-year median of 43x. Additionally, with earnings expected to grow 28.2% annually, AEM has an attractive PEG ratio of 0.77, indicating a discount based on the metric.
For investors seeking exposure to the gold market, Agnico Eagle Mines is a powerful way to express the trade. AEG has a reasonable valuation, top Zacks Rank and even pays a 1.8% dividend.
Read Full Story »»»
DiscoverGold
Gold CoT: Peek Into Future Through Futures, How Hedge Funds Are Positioned
By: Hedgopia | October 26, 2024
• Following futures positions of non-commercials are as of October 22, 2024.
Gold: Currently net long 296.2k, up 9.8k.

There is no stopping the yellow metal, rallying this week 0.9 percent to $2,755/ounce, tagging $2,773 on Wednesday. This was the third up week in a row – and sixth in last seven.
Gold has rallied strongly since June when it ticked $2,305. Since then, there have been several breakouts. Five weeks ago, after five sessions of sideways action at $2,610s, it broke out on September 20. This followed a breakout in the prior week at $2,540s-50s after several unsuccessful attempts since mid-August. Prior to this, after more than three months of sideways action, gold broke out at $2,440s-50s in August.
If one were to nitpick, the daily RSI has made lower highs even as gold went on to add $100 in the past month.
Read Full Story »»»
DiscoverGold
NY Gold Futures »» Weekly Summary Analysis
By: Marty Armstrong | October 26, 2024
NY Gold Futures closed today at 27546 and is trading up about 32% for the year from last year's settlement of 20718. At present, this market has been rising for 11 months going into October suggesting that this has been a bull market trend on the monthly time level which has been confirmed by electing all of our model's long-term Bullish Reversals from the key low. As we stand right now, this market has made a new high exceeding the previous month's high reaching thus far 27726 while it has not broken last month's low so far of 25027. Nevertheless, this market is still trading above last month's high of 27087.
ECONOMIC CONFIDENCE MODEL CORRELATION
Here in NY Gold Futures, we do find that this particular market has correlated with our Economic Confidence Model in the past. The Last turning point on the ECM cycle low to line up with this market was 2022 and 2015. The Last turning point on the ECM cycle high to line up with this market was 2020 and 2011 and 1996.
MARKET OVERVIEW
NEAR-TERM OUTLOOK
The NY Gold Futures has continued to make new historical highs over the course of the rally from 2015 moving into 2024. However, this last portion of the rally has taken place over 9 years from the last important low formed during 2015. We have elected four Bullish Reversals to date.
This market remains in a positive position on the weekly to yearly levels of our indicating models. Pay attention to the Monthly level for any serious change in long-term trend ahead.
Solely focusing on only the indicating ranges on the Daily level in the NY Gold Futures, this market remains moderately bullish currently with underlying support beginning at 27378 and overhead resistance forming above at 27633. The market is trading closer to the resistance level at this time.
On the weekly level, the last important high was established the week of October 21st at 27726, which was up 20 weeks from the low made back during the week of June 3rd. So far, this week is trading within last week's range of 27726 to 27221. Nevertheless, the market is still trading upward more toward resistance than support. A closing beneath last week's low would be a technical signal for a correction to retest support.
When we look deeply into the underlying tone of this immediate market, we see it is currently still in a semi neutral posture despite declining from the previous high at 27726 made 0 week ago. This market has made a new historical high this past week reaching 27726. Here the market is trading positive gravitating more toward resistance than support. We have technical support lying at 27474 which we are still currently trading above for now.
Right now, the market is above momentum on our weekly models hinting this is still bullish for now as well as trend, long-term trend, and cyclical strength. Looking at this from a wider perspective, this market has been trading up for the past 7 weeks overall.
INTERMEDIATE-TERM OUTLOOK
YEARLY MOMENTUM MODEL INDICATOR
Our Momentum Models are declining at this time with the previous high made 2020 while the last low formed on 2023. However, this market has rallied in price with the last cyclical high formed on 2023 and thus we have a divergence warning that this market is starting to run out of strength on the upside.
Interestingly, the NY Gold Futures has been in a bullish phase for the past 22 months since the low established back in November 2022.
Critical support still underlies this market at 23030 and a break of that level on a monthly closing basis would warn that a sustainable decline ahead becomes possible. Nevertheless, the market is trading above last month's high showing some strength.
DiscoverGold
$GDX - Wkly View of the 'Dark Cloud Cover' Candle...
By: Sahara | October 25, 2024
• $GDX - Wkly View of the 'Dark Cloud Cover' Candle...

Read Full Story »»»
DiscoverGold
Gold Stocks’ Secular Breakout
By: Adam Hamilton | October 25, 2024
The gold miners’ stocks just achieved a rare secular breakout. This huge technical milestone fueled by record gold levels reflects sector sentiment growing more bullish. That is pushing gold stocks closer to the crucial psychological tipping point where more-mainstream traders increasingly chase their strong gains. Multi-year highs generate broader interest, attracting more capital inflows accelerating gold-stock upside.
The GDX VanEck Gold Miners ETF has long been gold stocks’ leading sector benchmark and trading vehicle. This was the original pioneering gold-stock ETF, born way back in May 2006. GDX’s first-mover advantage has grown into an insurmountable lead, commanding net assets of $16.8b midweek. That nearly doubles the 13 next-largest gold-stock ETFs’ combined net assets! GDX is this sector’s juggernaut.
It just enjoyed a rather-remarkable nine consecutive trading days of rallying, blasting 13.7% higher in mid-October! That was fueled by a parallel big 5.3% gold surge, which the major gold stocks dominating GDX amplified by a good 2.6x. Historically GDX has usually leveraged material gold moves by 2x to 3x. While certainly an impressive win streak, it was only its last few days that proved important technical milestones.
Gold rapidly surged to extremely-overbought levels in late September, dramatically upping the odds for a rebalancing selloff. I analyzed gold’s high selloff risk in-depth in an early-October essay. That pullback indeed got to work, although it was retarded by soaring geopolitical risks after Iran lobbed hundreds of ballistic missiles into Israel! Still gold retreated a modest 2.4% over a couple weeks into early October.
That dragged GDX a proportional 6.8% lower, for larger 2.9x downside leverage. That selloff started from this sector ETF’s upleg-to-date peak of $41.64, leaving GDX well lower. But gold stocks were quick to claw back their losses, with GDX rallying back to $41.49 last Thursday the 17th. Both levels remained barely decisively above GDX’s last major peak of $40.87 in mid-April 2022, yet still in that resistance zone.
A decisive breakout is exceeding an old closing high by 1%+, which happened on September 24th when GDX closed over $41.28. But technical analysis is subjective, with most support and resistance lines on charts drawn by hand. So from a visual standpoint on a multi-year chart, gold stocks still looked to be near major upper resistance around GDX $41. They could easily still retreat, forming a double topping.
This gold-stock-technicals chart of recent years illuminates that $41 resistance zone. In order for that minor breakout mathematically to become major psychologically, GDX had to blast considerably higher into new chart territory. New highs had to look visually-striking, which finally happened a week ago on Friday the 18th. GDX soared a huge 4.0% higher that day, indisputably achieving a major secular breakout!

It was the best kind too, happening despite no real news. Gold did rally 1.1% to its third record high in a row of $2,721, but there was no Fed-dovish key economic data to drive that. Mounting geopolitical fears heading into a weekend likely played a role, as the world anxiously awaited Israel’s crippling retaliation against Iran for that ballistic-missile barrage. GDX’s big 4.0% up day amplified gold’s by a huge 3.7x.
Precious-metals sentiment lurched sizably to shifting bullish, thanks to gold’s defiant October rally and that big, round, psychologically-important $2,700 level being exceeded. Gold really should have sold off considerably this month. Leading into October, gold was not only extremely-overbought but speculators’ gold-futures longs had hit their 5th-highest levels on record! So massive mean-reversion selling was likely...
* * *
Read Full Story »»»
DiscoverGold
Gold has been putting in the performance of a decade and gold mining stocks are following through
By: SentimenTrader | October 24, 2024
• Gold has been putting in the performance of a decade and gold mining stocks are following through.
Virtually every miner is now trading above its 10-, 50-, and 200-day average. So many uptrends across so many of these stocks have been a good sign for the sector over the following month, but that was pretty much it, at least consistently.

Read Full Story »»»
DiscoverGold
3 Gold Stocks Surging on Bullish Sector Stance
By: Schaeffer's Investment Research | October 22, 2024
• Canaccord Genuity lifted its long-term price outlook for gold and silver
• All 3 stocks marked fresh highs last session
Canaccord Genuity praised commodities today, raising its long-term price outlook for gold and silver and lifting its price objective on several mining names, including Canada-listed stocks Kinross Gold Corp (NYSE:KGC) and Barrick Gold Corp (NYSE:GOLD) and U.S.-based Newmont Corporation (NYSE:NEM). Below, let's take a look at how these stocks are responding.
NEM is leading the bunch, last seen up 1.7% to trade at $58.54, after the firm lifted its price target to $66 from $59. Shares yesterday hit a two-year high of $58.71 after bouncing off a pullback to the 40-day moving average, and are now trading firmly above former resistance at $56. In the last 12 months, NEM added over 52%.
KGC notched a roughly 12-year high of $10.82 last session after rallying off a floor of support at the $9.20 level. The security is up 1.2% to trade at $10.67 at last glance, and now sports an impressive 99% year over year lead, with a 76.3% gain amassed just this year.
GOLD was last seen up 1.5% to trade at $21.17, fresh off its own two-year peak of $21.34 in the last session. The 60-day moving average helped fuel those gains, which contributed to the stock's 27.9% year-over-year lead.
Read Full Story »»»
DiscoverGold
BRIC'S by BRICS its happening starting 10.22.2024
$GDX - Hit the $42.50 Target on Friday. Yet needs to negate that Bear 'Wedge'...
By: Sahara | October 21, 2024
• $GDX - Hit the $42.50 Target on Friday.
Yet needs to negate that Bear 'Wedge'...

Read Full Story »»»
DiscoverGold
$GDX - The uptrend of out the March low reached the log measured move target of the September 2022-May 2023 uptrend...
By: CyclesFan | October 19, 2024
• $GDX - The uptrend of out the March low reached the log measured move target of the September 2022-May 2023 uptrend. Since the weekly candle is a big green candle it likely hasn't topped yet and will make a higher high next week. The next major resistance is the 2020 high(45.78)

Read Full Story »»»
DiscoverGold
NY Gold Futures »» Weekly Summary Analysis
By: Marty Armstrong | October 19, 2024
NY Gold Futures closed today at 27300 and is trading up about 31% for the year from last year's settlement of 20718. Currently, this market has been rising for 11 months going into October suggesting that this has been a bull market trend on the monthly time level which has been confirmed by electing all of our model's long-term Bullish Reversals from the key low. As we stand right now, this market has made a new high exceeding the previous month's high reaching thus far 27378 while it has not broken last month's low so far of 25027. Nevertheless, this market is still trading above last month's high of 27087.
ECONOMIC CONFIDENCE MODEL CORRELATION
Here in NY Gold Futures, we do find that this particular market has correlated with our Economic Confidence Model in the past. The Last turning point on the ECM cycle low to line up with this market was 2022 and 2015. The Last turning point on the ECM cycle high to line up with this market was 2020 and 2011 and 1996.
MARKET OVERVIEW
NEAR-TERM OUTLOOK
The NY Gold Futures has continued to make new historical highs over the course of the rally from 2015 moving into 2024. However, this last portion of the rally has taken place over 9 years from the last important low formed during 2015. Noticeably, we have elected four Bullish Reversals to date.
This market remains in a positive position on the weekly to yearly levels of our indicating models. Pay attention to the Monthly level for any serious change in long-term trend ahead.
Focusing on our perspective using the indicating ranges on the Daily level in the NY Gold Futures, this market remains in a bullish position at this time with the underlying support beginning at 26947.
On the weekly level, the last important high was established the week of October 14th at 27378, which was up 19 weeks from the low made back during the week of June 3rd. So far, this week is trading within last week's range of 27378 to 26544. Nevertheless, the market is still trading upward more toward resistance than support. A closing beneath last week's low would be a technical signal for a correction to retest support.
When we look deeply into the underlying tone of this immediate market, we see it is currently still in a semi neutral posture despite declining from the previous high at 27378 made 0 week ago. This market has made a new historical high this past week reaching 27378. Here the market is trading positive gravitating more toward resistance than support. We have technical support lying at 26596 which we are still currently trading above for now.
Right now, the market is above momentum on our weekly models hinting this is still bullish for now as well as trend, long-term trend, and cyclical strength. Looking at this from a wider perspective, this market has been trading up for the past 1 week overall.
INTERMEDIATE-TERM OUTLOOK
YEARLY MOMENTUM MODEL INDICATOR
Our Momentum Models are declining at this time with the previous high made 2020 while the last low formed on 2023. However, this market has rallied in price with the last cyclical high formed on 2023 and thus we have a divergence warning that this market is starting to run out of strength on the upside.
Interestingly, the NY Gold Futures has been in a bullish phase for the past 22 months since the low established back in November 2022.
Critical support still underlies this market at 23030 and a break of that level on a monthly closing basis would warn that a sustainable decline ahead becomes possible. Nevertheless, the market is trading above last month's high showing some strength.
DiscoverGold
3 of the best say gold going to 3k, from my experience with them, they are almost never wrong. yeah sure u got the nameless nobodies posting all over the place pretending to know anything other than the current trend in play, its gonna be HUGE. Praise God.
Gold CoT: Peek Into Future Through Futures, How Hedge Funds Are Positioned
By: Hedgopia | October 19, 2024
• Following futures positions of non-commercials are as of October 15, 2024.
Gold: Currently net long 286.4k, up 8.3k.

After three tentative weekly candles – shooting star, spinning top and dragonfly doji – gold yet again shone this week, up a solid two percent to $2,730/ounce, which set a fresh high.
The yellow metal has had a powerful rally since June when it tagged $2,305. In between, it enjoyed one after another breakout.
Four weeks ago, after five sessions of sideways action at $2,610s, gold broke out on September 20. This followed a breakout in the prior week at $2,540s-50s after several unsuccessful attempts since mid-August. Prior to this, after more than three months of sideways action, it broke out at $2,440s-50s in August.
This week’s breakout followed a defense of $2,610s last week.
Read Full Story »»»
DiscoverGold
Gold-Stock Tipping Point 2
By: Adam Hamilton | October 18, 2024
The gold miners’ stocks look to be getting even closer to a crucial psychological tipping point. After years of being mired in apathy, this small contrarian sector appears poised to finally return to popularity. When traders flock to gold stocks to chase their upside momentum, massive uplegs ensue where doublings-plus aren’t uncommon. And across entire bull markets, total gold-stock gains can exceed an order of magnitude.
Eleven weeks ago, I penned my original gold-stock-tipping-point essay. My thesis then was gold stocks were on the verge of being noticed by much-broader groups of speculators and investors. They would increasingly pile in to ride mounting sector gains, catapulting gold stocks way higher. Gold miners remain seriously undervalued relative to these record prevailing gold prices, they need to mean revert and normalize.
Much has happened in the several months since, making this case even stronger. The day that essay was published, gold and the leading GDX gold-stock ETF were trading at $2,436 and $36.48. Gold’s last nominal record close of $2,465 was seen several weeks earlier, while GDX’s upleg-to-date best then ran $39.28. It really felt like traders’ interest in gold and its miners’ stocks was growing, a very-bullish omen.
While feelings aren’t empirical, decades of experience hones them into valuable indicators. For a quarter-century now, I’ve been a financial-newsletter guy researching, writing about, and actively trading this gold-stock sector. This is my 1,144th weekly web essay since mid-2000, and I’ve written 291 monthly and 1,118 weekly paid-subscription newsletters in that long span! Active real-world gold-stock trading was a big part.
Both newsletters have recommended and realized 1,531 stock trades as of the end of Q3’24. All those including all losers have averaged excellent +16.0% annualized realized gains! That’s roughly double the long-term stock-market average. After spending the vast majority of my professional life deeply immersed in this realm, my experience and knowledge is world-class. Plenty of signs now point to improving psychology.
Chief among them is gold and GDX continuing to power higher on balance despite formidable challenges. Since that original essay, gold has achieved 14 new nominal record closes including midweek’s latest one at $2,673! That’s another big 9.8% rally despite gold recently facing high odds for a considerable selloff to rebalance sentiment and technicals. Strength contrary to probable weakness reveals shifting psychology.
In early October I wrote an entire essay analyzing gold’s high selloff risk. Two dominant factors fueled that, including gold blasting up to extreme overboughtness. That was driven by massive gold-futures buying by speculators, leaving their positioning way-overextended and their likely capital firepower for buying exhausted. Plenty of catalysts loomed that could spawn cascading gold-futures selling slamming gold.
Specs look to the US dollar’s fortunes to guide their wildly-leveraged and super-risky gold-futures trading. And the US Dollar Index in turn is often bullied around by major US economic-data releases. Depending on how they come in relative to economists’ forecasts, they can really move futures-implied expected Fed rate cuts. Those seemed impossibly-high in early August, at 116 basis points in 2024 then another 100bp in 2025!
That was almost nine quarter-point cuts over 16 months, pretty optimistic. While the FOMC did birth this latest cutting cycle with an outsized 50bp slashing in mid-September, those expected Fed rate cuts have indeed retreated on better-than-expected key economic data. Heavy gold-futures selling has often been spawned in recent years on upside surprises in US jobs, CPI inflation, PPI inflation, and retail sales.
All four latest reads proved Fed-hawkish and boosted the US dollar, which should’ve unleashed big gold-futures dumping! September’s nonfarm payrolls soared 254k, massively beating the +150k expected on top of +72k jobs in past-two-month revisions. All four of the September CPI’s key metrics came in 0.1% hotter than forecasts, and two of the four PPI ones printed 0.2% above consensus. These meant slower rate cuts.
Indeed by Wednesday expected Fed rate cuts in 2024 and 2025 had slumped to 45bp more and 99bp. As of midweek, the USDX had surged 3.2% in several weeks which is a big-and-sharp rally for it. Yet during that time with everything aligning out of favor for gold, it still managed to rally 0.4%! While gold did suffer a minor 2.4% pullback into early October, it rapidly rebounded to that latest record close Wednesday.
September retail sales were released Thursday morning before I started writing this essay, also proving a Fed-hawkish upside surprise. So this past month’s major economic data was certainly dollar-bullish and gold-bearish due to deteriorating expected Fed rate cuts. Yet gold powered higher anyway, likely on big buying from Chinese investors, central banks, and Indian brides’ families. Gold is really defying the odds.
Gold’s defiant march to more record highs is putting it on more traders’ radars. Financial-media coverage is becoming more-frequent and more-bullish, building awareness. Even American stock investors, who have mostly ignored gold’s monster 46.9% upleg over this past year, are increasingly nibbling in GLD and IAU gold-ETF shares. While small, their daily gold-bullion-holdings builds on capital inflows have been relentless.
So gold looks to be nearing its own psychological tipping point, where gains accelerate sparking a fear-of-missing-out rush to pile in. Seasonal tailwinds will soon turn favorable again too. Gold tends to suffer a seasonal pullback from late September to late October, before its biggest seasonal rally powers higher into late February. That has averaged 8.4% over 20 of the last 23 years, which were gold’s bull-market ones.
If gold’s early-October pullback low holds and this year’s winter rally merely proves average, gold would shoot over $2,825 in coming months! And as goes gold, so go its miners’ stocks. They ultimately act like leveraged plays on gold, with the majors dominating GDX usually amplifying their metal’s upside by 2x to 3x. Indeed GDX has rallied with gold recently, achieving another bull-market high of $41.64 in late September.
GDX has powered 60.7% higher over this past year, a good upleg. But it remains quite weak relative to gold, with mere 1.3x amplification. That’s way behind historical precedent. Gold’s last similar monster uplegs both peaked in 2020, averaging 41.4% gains. GDX averaged great 105.4% uplegs during those, doublings-plus at 2.5x leverage! GDX should already be up 95% to 140% in today’s monster gold upleg.
So gold stocks have lots more mean-reversion normalization rallying left to do even at today’s gold levels, let alone where this bull is heading. And GDX just has to inch a little higher to achieve a major technical breakout, which will hasten that crucial psychological tipping point arriving. Forging decisively above $42 ought to fuel increasing and enthusiastic financial-media gold-stock coverage, building greed-driven momentum.

When GDX hit $41.64 in late September, those were gold stocks’ best levels in 4.0 years. As I’m writing this draft midday Thursday, GDX is trading even higher at $41.86. The last time GDX closed over $42 was in mid-September 2020, six weeks after a powerful gold-stock upleg catapulted GDX 134.1% higher to $44.48. Exceed that, and this leading gold-stock benchmark will be at its best levels since January 2013!
Traders love chasing winners, and the financial media love to cover them. Decade-plus gold-stock highs less than 9% above midweek levels should be achieved soon, really boosting popular awareness of gold miners’ upside momentum. That dynamic can quickly become self-feeding, ultimately culminating in a popular speculative mania. It really feels like that process is accelerating, that sentiment tipping point is nearing...
* * *
Read Full Story »»»
DiscoverGold
$GDX - AS long as we hold the Shaded Up/Channel enhanced by 12/20/MA's, within the White-Channel it will aim for the 'Swing' & 'Fib' Targets...
By: Sahara | October 17, 2024
• $GDX - AS long as we hold the Shaded Up/Channel enhanced by 12/20/MA's, within the White-Channel it will aim for the 'Swing' & 'Fib' Targets.
Recall the Red 'Wedge' at the B/Out Line (Peach). Which needs negating...

Read Full Story »»»
DiscoverGold
Gold CoT: Peek Into Future Through Futures, How Hedge Funds Are Positioned
By: Hedgopia | October 12, 2024
• Following futures positions of non-commercials are as of October 8, 2024.
Gold: Currently net long 278.2k, down 21.8k.

Three weeks ago, in a shooting star week, gold printed $2,709 intraday before heading lower. It has had a powerful rally since June when it tagged $2,305. In between, the yellow metal enjoyed one after another breakout.
Three weeks ago, after five sessions of sideways action at $2,610s, gold broke out on September 20; this followed a breakout in the prior week at $2,540s-50s after several unsuccessful attempts since mid-August. Prior to this, after more than three months of sideways action, it broke out at $2,440s-50s in August.
This week, after coming under pressure in the first three sessions, bids showed up Thursday at $2,610s, with an intraday low of $2,619, ending the week up 0.3 percent to $2,676/ounce and forming a weekly dragonfly doji. Having defended the first layer of support, gold bugs deserve the benefit of the doubt in the sessions ahead.
Read Full Story »»»
DiscoverGold
NY Gold Futures »» Weekly Summary Analysis
By: Marty Armstrong | October 12, 2024
NY Gold Futures closed today at 26763 and is trading up about 29% for the year from last year's settlement of 20718. Factually, this market has been rising for 11 months going into October suggesting that this has been a bull market trend on the monthly time level which has been confirmed by electing all of our model's long-term Bullish Reversals from the key low.
ECONOMIC CONFIDENCE MODEL CORRELATION
Here in NY Gold Futures, we do find that this particular market has correlated with our Economic Confidence Model in the past. The Last turning point on the ECM cycle low to line up with this market was 2022 and 2015. The Last turning point on the ECM cycle high to line up with this market was 2020 and 2011 and 1996.
MARKET OVERVIEW
NEAR-TERM OUTLOOK
The NY Gold Futures has continued to make new historical highs over the course of the rally from 2015 moving into 2024. However, this last portion of the rally has taken place over 9 years from the last important low formed during 2015. Distinctly, we have elected four Bullish Reversals to date.
This market remains in a positive position on the weekly to yearly levels of our indicating models. Pay attention to the Monthly level for any serious change in long-term trend ahead.
Looking at the indicating ranges on the Daily level in the NY Gold Futures, this market remains moderately bullish currently with underlying support beginning at 26724 and overhead resistance forming above at 26894. The market is trading closer to the support level at this time.
On the weekly level, the last important high was established the week of September 23rd at 27087, which was up 16 weeks from the low made back during the week of June 3rd. We have seen the market drop sharply for the past week penetrating the previous week's low and yet it recovered to close above the previous week's close of 26678. We are still trading above the Weekly Momentum Indicators so we have not undermined critical support as of yet. When we look deeply into the underlying tone of this immediate market, we see it is currently still in a semi neutral posture despite declining from the previous high at 27087 made 2 weeks ago. Still, this market is within our trading envelope which spans between 23386 and 27582. Immediately, this decline from the last high established the week of September 23rd has been important Before, this recent rally exceeded the previous high of 25704 made back during the week of August 19th. That high was likewise part of a bullish trend making higher highs over the week of July 15th. This immediate decline has thus far held the previous low formed at 23042 made the week of June 3rd. Only a break of that low would signal a technical reversal of fortune and of course we must watch the Bearish Reversals.
Right now, the market is above momentum on our weekly models hinting this is still bullish for now as well as trend, long-term trend, and cyclical strength. Looking at this from a wider perspective, this market has been trading up for the past 5 weeks overall.
INTERMEDIATE-TERM OUTLOOK
YEARLY MOMENTUM MODEL INDICATOR
Our Momentum Models are declining at this time with the previous high made 2020 while the last low formed on 2023. However, this market has rallied in price with the last cyclical high formed on 2023 and thus we have a divergence warning that this market is starting to run out of strength on the upside.
Interestingly, the NY Gold Futures has been in a bullish phase for the past 22 months since the low established back in November 2022.
Critical support still underlies this market at 23030 and a break of that level on a monthly closing basis would warn that a sustainable decline ahead becomes possible. Immediately, the market is trading within last month's trading range in a neutral position.
DiscoverGold
Gold Bugs Index Testing Long-Term Breakout Level!
By: Chris Kimble | October 10, 2024

The precious metals rally appears to have reached an important juncture.
Yesterday I wrote about Silver and a potential inflection point. Today, we turn to the gold miners and the all-important Gold Bugs Index (HUI).
Above is a “monthly” chart of HUI. Here we can see that the Gold Bugs Index has reached an important confluence of resistance.
The rally has brought the Gold Bugs back to falling trend line resistance, lateral resistance, as well as the underside of the original rally trend line.
In short, this is a BIG area of resistance that will either bring a pause/pullback to the rally, or see a major breakout.
Should the Gold Bugs Index break out here…..VERY BULLISH!!!
Read Full Story »»»
DiscoverGold
Gold Miners’ Epic Quarter
By: Adam Hamilton | October 11, 2024
The gold miners are on the verge of reporting another best quarter ever. Q3’s earnings season ramping up soon will prove epic, fueled by dazzling record gold prices and slightly-lower mining costs. That ought to double sector unit profits, extending gold stocks’ long trend of massive earnings growth. Such fantastic results should increasingly catch fund investors’ attention, with their inflows driving this sector way higher.
Gold stocks remain out of favor, greatly lagging gold’s monster upleg over this past year. This has proven one of gold’s mightiest advances in many years, soaring 46.8% over 11.7 months! Historically larger gold miners dominating the leading GDX gold-stock ETF have seen their stock prices amplify gold uplegs by 2x to 3x. Yet instead of seeing normal 95%- to-140% upleg gains, GDX has merely rallied 60.7% at best!
That very-poor 1.3x upside leverage to gold has been a real kick in the teeth for contrarian speculators and investors. Gold stocks need to way outperform their metal to compensate for the big additional operational, geological, and geopolitical risks they heap on top of gold price trends. Yet so far that sure hasn’t happened in this upleg, leaving traders increasingly disappointed with this lucrative high-potential sector.
Two major factors contributed to this surprising anomaly. First gold-stock sentiment was crushed in mid-2022 and hasn’t recovered. Then the Fed’s most-violent rate-hike cycle ever catapulted the US Dollar Index up an incredible 16.7% in 6.0 months to an extreme 20.4-year secular peak! That spawned colossal gold-futures selling, slamming gold 20.9% lower in 6.6 months. GDX cratered a brutal 46.5% during that!
Second while gold blasted up 26.4% year-to-date, traders have been overwhelmingly distracted by the AI stock bubble. While gold achieved 35 nominal-record closing highs so far this year, the S&P 500 bested that with a whopping 44 of its own! Gold and gold stocks are alternative investments, thriving the most when general stock markets grind lower. Instead they’ve been surging, spinning off vast greed and euphoria.
But sooner or later all that will pass, and gold stocks will be bid way higher to reflect these lofty prevailing gold prices. The gold miners’ phenomenal fundamentals overwhelmingly support this bullish thesis. For 33 quarters in a row now, I’ve painstakingly analyzed the latest results reported by GDX’s 25-biggest component stocks. Right after each quarterly earnings season, I write essays explaining how they are performing.
Across individual gold miners, there are always plenty of distorted bottom-line earnings. These include big noncash gains and losses arising from unusual items ranging from acquisitions to impairment charges. But that noise can be distilled out with an excellent proxy for sector unit profits. It simply averages the GDX top 25’s all-in sustaining costs in any quarter, then subtracts them from its average gold price.
These implied per-ounce profits have been skyrocketing, leaving gold stocks deeply undervalued relative to their metal. A year ago in Q3’23, the GDX top 25 reported $622 in unit earnings which soared 94% YoY. Then in Q4’23, those grew again to $659 per ounce which shot up another 42% YoY. That trend persisted in Q1’24, with these major gold miners averaging earning $795 per ounce which powered up 35% YoY.
Then all that accelerated dramatically in the spectacular Q2’24, which I analyzed in depth in a mid-August essay. That quarter’s record average gold price of $2,337 combined with GDX-top-25 AISCs plunging 10.2% YoY to $1,239 catapulted unit earnings to a dazzling record $1,099! That blasted up another 84% YoY. So miners’ last four reported quarters have seen per-ounce profits soar 94%, 42%, 35%, and 84% YoY!
Such explosive profits growth has naturally slammed gold miners’ price-to-earnings ratios dramatically lower, into the teens and even single digits in some cases. With fantastically-bullish fundamentals like this, you’d think traders would be rushing into this high-potential sector. But gold stocks remain mired in apathy, lost in the shadow of this crazy AI stock bubble stealing all the limelight. Yet its days are numbered.
Eventually stock prices always mean revert to some reasonable multiple of underlying corporate earnings. Market-darling AI stocks can’t trade with 60x+ P/Es indefinitely, and good gold stocks can’t remain at sub-15x multiples. Sooner or later some catalyst will spark overdue capital flows to start normalizing all this. It could be the AI stock bubble finally bursting and decisively rolling over, it could prove gold surging even higher.
But maybe the gold miners will stack enough sensational earnings seasons to convince fund managers to return. Their relatively-big buying in this relatively-small sector will drive stock prices way higher, which will eventually fuel greed, euphoria, and maybe even a popular speculative mania. Gold stocks are about to report absolutely-epic Q3 results, their best ever achieved by far! That could prove this sector’s tipping point.
Q3’24’s average gold price soared an amazing 28.6% YoY to a new all-time record $2,477! This is utterly stunning considering just a year ago that highwater mark had been $1,978. Gold’s phenomenal prices last quarter were fueled by major buying from gold-futures speculators, central banks around the world, Chinese investors, and a huge surge in Indian gold imports. I could write entire essays discussing each.
But today realize Q3’s record gold levels have been set in stone, they can’t be revised lower like Biden Administration jobs reports. So the only variable driving sector unit profitability is the GDX top 25’s average all-in sustaining costs. Over the past four quarters they have been trending lower on balance, clocking in at $1,304, $1,317, $1,277, and $1,239 per ounce. That averages $1,284, a conservative baseline.
The majority of these elite major gold miners provide and update AISC guidance throughout the year. And many of them are forecasting higher production and thus lower mining costs in H2’24 compared to H1. Gold mining has massive fixed costs, which growing output spreads across more ounces reducing unit costs. A surprising number of major gold miners continued guiding to considerably-lower costs in Q3 and Q4.
The world’s largest gold miner and GDX’s biggest component by far with a huge 14.6% weighting is a great example. In Q1 and Q2, Newmont reported AISCs of $1,439 and $1,562 per ounce. That averaged a little over $1,500 in H1. Yet in late July NEM reaffirmed its full-year-2024 AISC guidance at just $1,400 per ounce. Unlike most of its peers, Newmont didn’t even give a range. And its 2024 output was H2-weighted.
Back in late February this super-major forecast 47% of this year’s production would come in H1, then 53% in H2. That alone is going to force AISCs lower. To hit that $1,400 AISC target for all of 2024, Q3’s and Q4’s would have to average just $1,300! That is sharply lower from Q1’s and Q2’s, and would make for a big improvement. We are talking about H2 AISCs plunging 13%+ from H1 levels, which would be amazing.
While I really doubt NEM will achieve such low Q3 and Q4 AISCs, they will definitely materially improve. And there are plenty of other GDX-top-25 majors with similar much-better-mining-cost forecasts for H2 compared to H1. Collectively these elite gold miners averaged $1,258 AISCs in H1’24. It seems pretty conservative to imagine them improving 2%ish in this soon-to-be-reported Q3, which would be near $1,230.
We won’t know what the actual average is until Q3 earnings season ends in mid-November, after which I’ll write another essay fully analyzing those collective results. But if GDX-top-25 AISCs come in around $1,230, subtracted from Q3’s phenomenal $2,477 average gold price that yields implied sector profits of $1,247 per ounce! That would crush Q2’24’s previous record of $1,099, and skyrocket over 100% YoY!
You’d sure think a doubling in gold miners’ already-massive profits would impress some fund managers, motivating them to add gold-stock positions. But even if GDX-top-25 Q3 AISCs come in way higher for some reason, profitability is still going to soar. Even if those average AISCs prove much worse up near $1,350, Q3’s unit earnings would still soar 81% YoY to a new record $1,127. Those profits will prove epic.
Crazily due to this AI stock bubble and funds dangerously concentrated in a handful of wildly-overcrowded AI plays, American stock investors’ overall allocations to gold are effectively zero. Entering October, the S&P 500 stocks collectively commanded a staggering $51,247b market capitalization. Yet the combined holdings of the world-dominant American GLD and IAU gold ETFs were merely worth $106b that same day.
That implies a trivial 0.2% gold allocation, despite gold’s record-shattering year! That should be 5% to 10%, since gold has always been an essential portfolio diversifier. Even if it grows to 1%, gold is heading way higher. And fund managers’ allocations to gold miners’ stocks are similarly-tiny. At some point gold miners’ earnings will grow so fat and rich that their stocks can no longer be ignored, and capital inflows will soar.
While the major gold stocks’ imminent Q3 results are going to be jaw-droppingly awesome, this sector does face a near-term speedbump. Gold stocks leverage gold, and it faces high selloff risks during coming weeks. My essay last week analyzed this in depth. Gold simply blasted too far too fast to extremely-overbought levels driven by heavy gold-futures buying, leaving speculators’ positioning extreme.
But despite gold growing really overextended, gold stocks are not since they have lagged their metal so much this year. This chart divides GDX by its own 200-day moving average, creating an overbought-and-oversold indicator I call the Relative GDX. This renders gold-stock moves in constant-percentage terms around a 200dma flattened to horizontal at 1.00x. Over time this rGDX indicator tends to form trading ranges.
The current one based on the last five years of data runs from extremely-oversold levels under 0.75x GDX’s 200dma to extremely-overbought ones over 1.30x. Unlike its metal, GDX still hasn’t yet reached the latter warning levels in this year-long upleg! At the major gold stocks’ latest interim high achieved in late September, the rGDX was merely running 1.249x! Gold stocks don’t need to fully amplify gold’s selloff.

Of course they will to some extent, as they are leveraged plays on the metal they mine. At worst since its latest interim high, gold has pulled back 2.4% as of midweek. GDX did fall 6.8% in that span, making for 2.9x downside leverage on the higher side of that usual 2x-to-3x range. But that ought to moderate since gold stocks remain really undervalued after seriously lagging gold’s powerful advance, as precedent shows.
Gold’s last healthy mid-upleg pullback ran from late May to early June, when it dropped 5.7% rebalancing sentiment. During that span gold bled off excessive greed, GDX only retreated 10.0% making for mere 1.8x downside leverage! Any coming gold-stock downside on another gold pullback should prove relatively-muted as well. The gold stocks never challenged extreme overboughtness, and popular greed never flared.
If gold pulling back forces a gold-stock selloff ahead of or into Q3 earnings, that should prove an excellent buying opportunity. Mid-upleg pullbacks offer the best buy-relatively-low opportunities within ongoing bull-market uplegs. We ratcheted up trailing stop losses on our newsletter gold-stock trades preparing for a retreat, and I’m researching fundamentally-superior mid-tiers and juniors to buy into as it runs its course...
* * *
Read Full Story »»»
DiscoverGold
Miners still following the ping pong pattern of gold, when a breakout is confirmed, you wont see the connection at the hip for months.
NY Gold Futures »» Weekly Summary Analysis
By: Marty Armstrong | October 5, 2024
NY Gold Futures closed today at 26678 and is trading up about 28% for the year from last year's settlement of 20718. Factually, this market has been rising for 11 months going into October suggesting that this has been a bull market trend on the monthly time level which has been confirmed by electing all of our model's long-term Bullish Reversals from the key low.
ECONOMIC CONFIDENCE MODEL CORRELATION
Here in NY Gold Futures, we do find that this particular market has correlated with our Economic Confidence Model in the past. The Last turning point on the ECM cycle low to line up with this market was 2022 and 2015. The Last turning point on the ECM cycle high to line up with this market was 2020 and 2011 and 1996.
MARKET OVERVIEW
NEAR-TERM OUTLOOK
The NY Gold Futures has continued to make new historical highs over the course of the rally from 2015 moving into 2024. However, this last portion of the rally has taken place over 9 years from the last important low formed during 2015. Distinctly, we have elected four Bullish Reversals to date.
This market remains in a positive position on the weekly to yearly levels of our indicating models. Pay attention to the Monthly level for any serious change in long-term trend ahead.
Solely focusing on only the indicating ranges on the Daily level in the NY Gold Futures, this market remains moderately bullish currently with underlying support beginning at 26653 and overhead resistance forming above at 26947. The market is trading closer to the support level at this time. An opening below this level in the next session will imply a decline is unfolding.
On the weekly level, the last important high was established the week of September 23rd at 27087, which was up 16 weeks from the low made back during the week of June 3rd. Afterwards, the market bounced for 16 weeks reaching a high during the week of September 23rd at 26386. Since that high, we have been generally trading down to sideways for the past week, which has been a reasonable move of 2.307% in a reactionary type decline. Nonetheless, the market still has not penetrated that previous low of 23042 as it has fallen back reaching only 26462 which still remains 14.84% above the former low.
When we look deeply into the underlying tone of this immediate market, we see it is currently still in a semi neutral posture despite declining from the previous high at 27087 made 1 week ago. Still, this market is within our trading envelope which spans between 23206 and 27368. The broader perspective, this current rally into the week of September 23rd has exceeded the previous high of 25704 made back during the week of August 19th. This immediate decline has thus far held the previous low formed at 23042 made the week of June 3rd. Only a break of that low would signal a technical reversal of fortune and of course we must watch the Bearish Reversals.
Right now, the market is above momentum on our weekly models hinting this is still bullish for now as well as trend, long-term trend, and cyclical strength. From a pointed viewpoint, this market has been trading down for the past week.
INTERMEDIATE-TERM OUTLOOK
YEARLY MOMENTUM MODEL INDICATOR
Our Momentum Models are declining at this time with the previous high made 2020 while the last low formed on 2023. However, this market has rallied in price with the last cyclical high formed on 2023 and thus we have a divergence warning that this market is starting to run out of strength on the upside.
Interestingly, the NY Gold Futures has been in a bullish phase for the past 22 months since the low established back in November 2022.
Critical support still underlies this market at 23030 and a break of that level on a monthly closing basis would warn that a sustainable decline ahead becomes possible. Immediately, the market is trading within last month's trading range in a neutral position.
DiscoverGold
In other words, in fact, they are 10x behind. https://kingworldnews.com/john-hathaway-the-stage-is-set-for-a-big-move-in-gold-and-gold-miners/
$GDX - Be aware of the 'H&S' Up at the Uppr-End of that Bear 'Wedge'...
By: Sahara | October 3, 2024
• $SPX seemingly range bound between 0.75 and 1.0 std dev. Waiting to see signs of direction.

Read Full Story »»»
DiscoverGold
$GDX #Miners - Interesting week with last weeks Ominous 'Gravestone' (Or 'Inv Hammer') Candle at the Uppr-BB, Uppr-Parallel & Blue-Buffer...
By: Sahara | September 30, 2024
• $GDX #Miners - Interesting week with last weeks Ominous 'Gravestone' (Or 'Inv Hammer') Candle at the Uppr-BB, Uppr-Parallel & Blue-Buffer...

Read Full Story »»»
DiscoverGold
NY Gold Futures »» Weekly Summary Analysis
By: Marty Armstrong | September 28, 2024
NY Gold Futures closed today at 26681 and is trading up about 28% for the year from last year's settlement of 20718. Caution is required for this market is starting to suggest it may now decline on the MONTHLY level. Currently, this market has been rising for 10 months going into September suggesting that this has been a bull market trend on the monthly time level which has been confirmed by electing all of our model's long-term Bullish Reversals from the key low. As we stand right now, this market has made a new high exceeding the previous month's high reaching thus far 27087 while it has not broken last month's low so far of 24038. Nevertheless, this market is still trading above last month's high of 25704.
ECONOMIC CONFIDENCE MODEL CORRELATION
Here in NY Gold Futures, we do find that this particular market has correlated with our Economic Confidence Model in the past. The Last turning point on the ECM cycle low to line up with this market was 2022 and 2015. The Last turning point on the ECM cycle high to line up with this market was 2020 and 2011 and 1996.
MARKET OVERVIEW
NEAR-TERM OUTLOOK
The NY Gold Futures has continued to make new historical highs over the course of the rally from 2015 moving into 2024. However, this last portion of the rally has taken place over 9 years from the last important low formed during 2015. Noticeably, we have elected four Bullish Reversals to date.
This market remains in a positive position on the weekly to yearly levels of our indicating models. Pay attention to the Monthly level for any serious change in long-term trend ahead.
From a perspective using the indicating ranges on the Daily level in the NY Gold Futures, this market remains moderately bullish currently with underlying support beginning at 26510 and overhead resistance forming above at 26894. The market is trading closer to the support level at this time.
On the weekly level, the last important high was established the week of September 23rd at 27087, which was up 16 weeks from the low made back during the week of June 3rd. So far, this week is trading within last week's range of 27087 to 26386. Nevertheless, the market is still trading downward more toward support than resistance. A closing beneath last week's low would be a technical signal for a correction to retest support.
When we look deeply into the underlying tone of this immediate market, we see it is currently still in a semi neutral posture despite declining from the previous high at 27087 made 0 week ago. This market has made a new historical high this past week reaching 27087. Here the market is trading weak gravitating more toward support than resistance. We have technical support lying at 26839 which we are currently trading below implying the market is very weak. This infers that this level will now be resistance. Our Major Channel Support lies at 25445 and a break of that level would be a bearish indication for this market.
Right now, the market is above momentum on our weekly models hinting this is still bullish for now as well as trend, long-term trend, and cyclical strength. Looking at this from a wider perspective, this market has been trading up for the past 3 weeks overall.
INTERMEDIATE-TERM OUTLOOK
YEARLY MOMENTUM MODEL INDICATOR
Our Momentum Models are declining at this time with the previous high made 2020 while the last low formed on 2023. However, this market has rallied in price with the last cyclical high formed on 2023 and thus we have a divergence warning that this market is starting to run out of strength on the upside.
Interestingly, the NY Gold Futures has been in a bullish phase for the past 21 months since the low established back in November 2022.
Critical support still underlies this market at 22840 and a break of that level on a monthly closing basis would warn that a sustainable decline ahead becomes possible. Nevertheless, the market is trading above last month's high showing some strength.
DiscoverGold
Normally what would be gold investor inflow went to BTC during and after several Halvings, many are stuck either financially or mentally. they know nothing else. The rest of the world, maybe hundreds of million out of the 6 plus Billion not in the west, since its now wealthier then ever before per person excluding the rich and infamous. The world gets it, the west is toast, more accurately post toastie, as in hits the goal post and never the net anymore. the west is fried, beyond all reasoning, stuck in markets and crypto, while the rest of the world will be a part of the transition to real money because fiat is absolutely BK. The dollar is doomed and the US along with central banks around the world, have already begun to transition back to real money. It will be the Great world wide recession or depression, into a new monetary systems based on real money, gold and silver. everything else that makes it will have to have the capability to transfer into real money or it will fade away. US wants civil war or WWIII because they cannot navigate out of the mess they created. like a VP who was dictator over the border, failed over 10 million time, then 40 days before election decides to pretend to secure the border. ITs too late, game over in every way. All crypto that becomes a derivative of gold has a chance, the rest will swell up with moron retail investors then implode with absolute impunity.
Analysts predict that inflows into gold exchange-traded funds, especially from Western investors, are likely to increase in the coming months, providing additional positive momentum to already record-high bullion prices.insert-text-here
Gold Stocks Forge Higher
By: Adam Hamilton | September 27, 2024
The gold miners’ stocks are forging higher, just achieving their best levels in four years. While advancing, their upside progress has certainly been labored. Given gold’s monster upleg and dazzling record highs, gold stocks should be much higher. And their record profits and epic earnings growth sure support way-better stock prices. The main impediment is traders’ apathetic sector sentiment, but that is starting to shift.
The leading GDX gold-stock index has surged 7.2% at best this month, closing at $41.41 Tuesday. That proved major gold stocks’ highest levels in 3.9 years. And if GDX can best the $44.48 it hit a few months earlier in August 2020, we’d be looking at 11.7-year secular highs! Since early October 2023, this GDX upleg has powered up 59.8%. That’s trouncing broader stock markets, with the S&P 500 up 34.5% in that span.
With great performance like that over this past year, you’d think gold stocks would be growing popular. But they really aren’t. Mainstream investors still aren’t the least-bit interested in chasing this sector’s strong upside momentum. They’re still enamored with the AI stock bubble, which continues to steal all the market limelight. And contrarian investors like me who follow gold stocks are pretty disappointed in them.
Gold stocks are ultimately leveraged plays on the metal they mine. The gold-mining business heaps big additional operational, geological, and geopolitical risks on top of gold price trends. So gold stocks really need to outperform gold to justify deploying capital in them. Historically the major-dominated GDX has generally leveraged material gold moves by 2x to 3x. That kind of amplification makes gold stocks worth owning.
Unfortunately they’ve way underperformed long decades of precedent over this past year. GDX’s 59.8% upleg sounds good, but gold itself has enjoyed a monster 46.3% upleg in that timeframe! That means the major gold stocks have only clocked in with 1.3x upside leverage to their metal. At that usual 2x to 3x, this GDX upleg should already be up 93% to 139% given gold’s massive gains! Gold stocks are way behind.
That doesn’t mean they won’t catch up with gold, which can happen fast. Compared to the vast pools of stock-market capital, this contrarian sector is vanishingly-small. So even tiny shifts in capital flows can catapult gold stocks far higher in short order. During gold’s last 40%+ upleg cresting in August 2020, that last time GDX was higher, GDX had rocketed up 134.1% in only 4.8 months! Gold stocks aren’t out of the race.
After actively trading this high-potential contrarian sector publicly for a quarter-century now, I’ve seen plenty of times where gold stocks were mostly ignored. Sooner or later investors always return, resulting in huge gains. Doublings in under a year aren’t uncommon, gold stocks can really multiply wealth when they are running! Another doubling or more is coming as gold stocks mean revert way higher to reflect gold.
That will be driven by a major bullish sentiment shift, resulting from gold’s massive gains and impressive parade of nominal record highs. The gold miners’ colossal earnings generated at these high gold prices fundamentally justify way-higher stock prices. Before we delve into all that, this chart puts GDX technical action in recent years into perspective. The gold stocks’ latest secular high is marginal, they are forging ahead.

Interestingly despite vexingly lagging gold this past year, gold-stock doublings are still a thing. Since this secular gold bull was born in late September 2022, GDX has powered up 89.3%. That compares to gold’s +64.0% at best in that span, making for modestly-better 1.4x upside leverage. Yet driven by gold-stock sentiment, sector performance can turn on a dime. GDX would only need a couple months to fully catch up.
The dominant driver of gold-stock psychology is how gold is faring. And that is awesome right now, achieving five new record closes in August followed by another seven so far in September! Closing way up near $2,662 Tuesday, such fantastic gold levels were almost unimaginable just one year ago. The longer and higher gold rallies, the more investors and speculators will want to chase it including with gold stocks.
New record highs in particular fuel virtuous circles of buying. The higher gold goes, the more the financial media covers it and the more bullish their coverage gets. That elevates gold and by extension its miners’ stocks onto more investors’ radars, including fund managers. The more buying they do, the more gold and gold-stock gains mount. That generates more bullish commentary attracting in widening circles of investors...
* * *
Read Full Story »»»
DiscoverGold
Gold CoT: Peek Into Future Through Futures, How Hedge Funds Are Positioned
By: Hedgopia | September 28, 2024
• Following futures positions of non-commercials are as of September 24, 2024.
Gold: Currently net long 315.4k, up 5.3k.

Gold rallied another 0.8 percent this week to $2,668/ounce but not before raising a caution flag. It touched $2,697 intraday Thursday before profit-taking began.
Last week, after five sessions of sideways action at $2,610s, gold broke out Friday; this followed a breakout in the prior week at $2,540s-50s after several unsuccessful attempts since mid-August. The metal has experienced a sustained rally from $2,305 this June, including an August breakout at $2,440s-50s after more than three months of sideways action.
This week’s shooting star candle probably is a warning that gold is ready for a breather. Immediate support lies at $2,610s, followed by $2,540s-50s and $2,440s-50s.
Read Full Story »»»
DiscoverGold
Breaking out, much much higher soon as some reset on Stoch and RSI. https://www.zerohedge.com/precious-metals/gold-priced-swiss-francs-finally-breaking-out
Goldman Commodity Traders: Gold Buying On Our Desk Has Been Relentless, And Silver Is Starting To Move Too
So, in light of the above, Goldman's commodity team reiterates its "long gold trading recommendation and our price target of $2,700/toz by early 2025" for three reasons:
My comment - They and others are losing control of the gold and silver paper market. Late to the party or CYA announcement to clients. Look here, don't look there.
We believe that the tripling in central bank purchases since mid-2022 on fears about US financial sanctions and US sovereign debt is structural and will continue, reported or unreported.
Fed rate cuts are poised to bring Western capital back into gold ETFs, a component largely absent of the sharp gold rally observed in the last two years. Since ETF holdings only increase gradually as the Fed cuts, this upside is not yet fully priced in.
Gold offers significant hedging value to portfolios against geopolitical shocks including tariffs, Fed subordination risk, debt fears, and recessionary risks. Our analysis suggests an additional upside of 15% in gold prices under a hypothetical rise in financial sanctions equal to the rise seen since 2021 and a similar upside if US CDS spreads widen by 1 standard deviation (13bps) amid rising debt concerns.
https://www.mintstategold.com/investor-education/cat/news/post/goldman-commodity-traders-gold-buying-on-our-desk-has-been-relentless-and-silver-is-starting-to-move-too/
The Last Stage of the Gold and Silver Breakout FINALLY Begins
$GDX #Miners - Tapped all my targets from that Bull Plot. Now has a Bear 'Wedge'...
By: Sahara | September 26, 2024
• $GDX #Miners - Tapped all my targets from that Bull Plot.
Now has a Bear 'Wedge'...

Read Full Story »»»
DiscoverGold
small cap miners will most likely way out perform GDX but i like to stick with something i know.
watch the sky, its now clear this it was 1979 over again.
$GOLD MINERS NEWS - $Gold now has a historical breakout vs US CPI. A very bullish chart for precious metals.
$Gold Has Also Broken Out vs CPI

The inflation-adjusted $gold price having a 44-year break out has absolutely massive implications going forward…
$15,000 GOLD Soon! Prepare for the BIGGEST $Gold & $Silver Rally in 50 Years - John Rubino
Money Sense

John is a veteran in the field, and has sound logic and discussions. not like most on the internet. Although i disagree with his price, is see gold....within 3 years, at 33k.
$15,000 GOLD Soon! Prepare for the BIGGEST Gold & Silver Rally in 50 Years - John Rubino
Money Sense
Central Bank Gold Buying Doubled in July
Mike Maharrey
September 3rd, 2024
·
https://www.moneymetals.com/news/2024/09/03/central-bank-gold-buying-doubled-in-july-003427
DD....Aris Mining Corporation (Aris Mining or the Company) (TSX:...
https://ih.advfn.com/stock-market/AMEX/aris-mining-ARMN/stock-news/94431244/aris-mining-publishes-its-2023-sustainability-repo
DD....Pelangio Exploration Inc. NEWS -
https://investorshub.advfn.com/boards/read_msg.aspx?message_id=175015670
DD....
Patagonia Gold Corp, formerly known as Hunt Mining Corp., is a Silver and Gold production company.
https://investorshub.advfn.com/boards/read_msg.aspx?message_id=175002209
https://investorshub.advfn.com/boards/read_msg.aspx?message_id=172090585
Gold CoT: Peek Into Future Through Futures, How Hedge Funds Are Positioned
By: Hedgopia | August 31, 2024
• Following futures positions of non-commercials are as of August 27, 2024.
Gold: Currently net long 294.4k, up 3.2k.

Going into this week, gold went sideways at $2,540s-50s for six sessions. This continued this week before suffering a 1.3-percent tumble on Friday, losing 0.7 percent for the week to $2,528/ounce. This preceded last week’s spinning top.
Earlier, the metal posted a fresh record of $2,570 on the 20th. Before that, it went sideways at $2,440s-50s for more than three months before breaking out early this month. It is probable the yellow metal is headed for a breakout retest. Non-commercials do not seem much worried about a breach; they are net long gold futures the most since March 2020.
Read Full Story »»»
DiscoverGold
NY Gold Futures »» Weekly Summary Analysis
By: Marty Armstrong | August 31, 2024
Next Monday is Labor Day, which is a holiday in the United States. NY Gold Futures closed today at 25276 and is trading up about 22% for the year from last year's settlement of 20718. Caution is required for this market is starting to suggest it may now decline on the MONTHLY level. Presently, this market has been rising for 10 months going into September suggesting that this has been a bull market trend on the monthly time level which has been confirmed by electing all of our model's long-term Bullish Reversals from the key low.
ECONOMIC CONFIDENCE MODEL CORRELATION
Here in NY Gold Futures, we do find that this particular market has correlated with our Economic Confidence Model in the past. The Last turning point on the ECM cycle low to line up with this market was 2022 and 2015. The Last turning point on the ECM cycle high to line up with this market was 2020 and 2011 and 1996.
MARKET OVERVIEW
NEAR-TERM OUTLOOK
The NY Gold Futures has continued to make new historical highs over the course of the rally from 2015 moving into 2024. However, this last portion of the rally has taken place over 9 years from the last important low formed during 2015. We have elected four Bullish Reversals to date.
This market remains in a positive position on the weekly to yearly levels of our indicating models. Pay attention to the Monthly level for any serious change in long-term trend ahead.
From a perspective using the indicating ranges on the Daily level in the NY Gold Futures, this market remains moderately bullish currently with underlying support beginning at 25198 and overhead resistance forming above at 25385. The market is trading closer to the support level at this time.
On the weekly level, the last important high was established the week of August 19th at 25704, which was up 11 weeks from the low made back during the week of June 3rd. Afterwards, the market bounced for 11 weeks reaching a high during the week of August 19th at 25064. Since that high, we have been generally trading down to sideways for the past week, which has been a reasonable move of 1.704% in a reactionary type decline. Nonetheless, the market still has not penetrated that previous low of 23042 as it has fallen back reaching only 25266 which still remains 9.651% above the former low.
When we look deeply into the underlying tone of this immediate market, we see it is currently still in a semi neutral posture despite declining from the previous high at 25704 made 1 week ago. Still, this market is within our trading envelope which spans between 21978 and 26480. The broader perspective, this current rally into the week of August 19th has exceeded the previous high of 24884 made back during the week of July 15th. This immediate decline has thus far held the previous low formed at 23042 made the week of June 3rd. Only a break of that low would signal a technical reversal of fortune and of course we must watch the Bearish Reversals.
Right now, the market is above momentum on our weekly models hinting this is still bullish for now as well as trend, long-term trend, and cyclical strength. Looking at this from a wider perspective, this market has been trading up for the past 6 weeks overall.
INTERMEDIATE-TERM OUTLOOK
YEARLY MOMENTUM MODEL INDICATOR
Our Momentum Models are declining at this time with the previous high made 2020 while the last low formed on 2023. However, this market has rallied in price with the last cyclical high formed on 2023 and thus we have a divergence warning that this market is starting to run out of strength on the upside.
Interestingly, the NY Gold Futures has been in a bullish phase for the past 21 months since the low established back in November 2022.
Critical support still underlies this market at 22840 and a break of that level on a monthly closing basis would warn that a sustainable decline ahead becomes possible. Immediately, the market is trading within last month's trading range in a neutral position.
DiscoverGold
$GDX #Miners - Here we see A 'Channel' - 'Coil' - 'Cup' & Handle' & a 'Gann Fan'...
By: Sahara | August 30, 2024
• $GDX #Miners - Here we see A 'Channel' - 'Coil' - 'Cup' & Handle' & a 'Gann Fan'...

Read Full Story »»»
DiscoverGold
https://wolfstreet.com/2024/08/29/buyers-strike-deepens-pending-home-sales-drop-to-record-low-despite-surging-supply-much-lower-mortgage-rates-that-already-priced-in-massive-rate-cuts/ Great for Gold and Silver, but we knew that long before the stats now didnt we?
2 Mining Stocks Cashing in on Gold's Shine
By: Schaeffer's Investment Research | August 29, 2024
• Interest rate expectations and encouraging economic data are keeping gold prices higher
• GOLD and NEM are both trading at or near multi-year highs
Gold prices are on the move again, solidifying gains after second-quarter gross domestic product (GDP) showed upwardly-revised growth. Combined with the near-certainty of an interest rate cut from the Federal Reserve at the central bank's meeting next month, the safe-haven asset has been flying high, up over 22% in 2024. Gold miners Barrick Gold Corp (NYSE:GOLD) and Newmont Corporation (NYSE:NEM) are enjoying the tailwinds as well.
Barrick Gold stock was last seen up 2.3% to trade at $20.31, just a chip-shot from its Aug. 20 two-year high of $20.88. The shares are up 14% year-to-date and have gained 22% this quarter alone.
Options seem to be affordably priced. The equity's Schaeffer's Volatility Index (SVI) of 29% ranks in the relatively low 18th percentile of its 12-month range, meaning options traders are pricing in low volatility expectations right now.
Newmont stock is 2.5% higher to trade at $53.13 at last check, and earlier hit a multi-year high of $53.30. The shares have carved out a channel of higher highs since briefly breaching $30 on Feb. 28, and are now up 30% in 2024.
While calls outpace puts on an absolute basis, Newmont's 10-day put/call volume ratio over at the International Securities Exchange (ISE), Cboe Options Exchange (CBOE), and NASDAQ OMX PHLX (PHLX) stands higher than 98% of annual readings. This means puts have been getting picked up at a quicker-than-usual clip lately. Given only a slim 1.6% of NEM's total available float is sold short, some of this activity could be due to shareholders protecting paper profits against any unexpected downside risk,

Read Full Story »»»
DiscoverGold
$GDX #Miners - That 'Pennant' gave way so I put a Parallel of the top line, below it for a Bull 'Flag'...
By: Sahara | August 29, 2024
• $GDX #Miners - That 'Pennant' gave way so I put a Parallel of the top line, below it for a Bull 'Flag'...
So far

Read Full Story »»»
DiscoverGold
Gold fell for the bogus GDP upward revision. It’s government jobs and rich buying stuff, not the rest of us, and still they fake the numbers. More evidence it all blows up because funny numbers don’t feed people, unhappy and angry people. 10s of millions barely making it while giggles and Gavin gives free food, phones, housing to illegals.
$GDX #Miners - 'Coil'?...
By: Sahara | August 27, 2024
• $GDX #Miners - 'Coil'?...

Read Full Story »»»
DiscoverGold
Gold CoT: Peek Into Future Through Futures, How Hedge Funds Are Positioned
By: Hedgopia | August 24, 2024
• Following futures positions of non-commercials are as of August 20, 2024.
Gold: Currently net long 291.3k, up 24k.

Gold trudged higher to yet another record in a spinning top week. The metal rose 0.3 percent to $2,546/ounce, with an intraday high of $2,570 on the 20th.
The yellow metal has gone sideways at $2,540s-50s the last six sessions. A possible breakout in the sessions ahead will open the door toward this week’s high, and that will decide which way gold goes near-term.
Earlier, the metal went sideways at $2,440s-50s for more than three months before breaking out early this month. Gold bugs should be fine as long as this breakout remains intact.
In the meantime, non-commercials are net long gold futures the most since March 2020.
Read Full Story »»»
DiscoverGold
Gold Mid-Tiers’ Q2’24 Fundamentals
By: Adam Hamilton | August 23, 2024
The mid-tier and junior gold miners in this sector’s sweet spot for upside potential just finished reporting truly-spectacular quarterly results. Fueled by dazzling record gold prices and lower mining costs, smaller gold miners’ unit earnings skyrocketed to their highest levels ever. Those incredibly-rich profits have left mid-tiers even more undervalued relative to prevailing gold prices, portending massive catch-up rallying.
The leading mid-tier-gold-stock benchmark is the GDXJ VanEck Junior Gold Miners ETF. With $5.5b in net assets mid-week, it remains the second-largest gold-stock ETF after its big brother GDX. That is dominated by far-larger major gold miners, though there is much overlap between these ETFs’ holdings. Still misleadingly named, GDXJ is overwhelmingly a mid-tier gold-stock ETF with juniors having little weighting.
Gold-stock tiers are defined by miners’ annual production rates in ounces of gold. Small juniors have little sub-300k outputs, medium mid-tiers run 300k to 1,000k, large majors yield over 1,000k, and huge super-majors operate at vast scales exceeding 2,000k. Translated into quarterly terms, these thresholds shake out under 75k, 75k to 250k, 250k+, and 500k+. Today only three of GDXJ’s 25 biggest holdings are true juniors!
Their Q2 outputs are highlighted in blue in the table below. Juniors not only mine less than 75k ounces per quarter, but their gold output generates over half their quarterly revenues. That excludes streaming and royalty companies that purchase future gold output for big upfront payments used to finance mine-builds, and primary silver miners producing byproduct gold. But mid-tiers often make better investments than juniors.
These gold miners dominating GDXJ offer a unique mix of sizable diversified production, excellent output-growth potential, and smaller market capitalizations ideal for outsized gains. Mid-tiers are less risky than juniors, while amplifying gold uplegs more than majors. So we’ve long specialized in the fundamentally-superior mid-tiers and juniors at Zeal, actively trading these smaller gold miners for a quarter-century now.
All 1,510 newsletter stock trades realized as of Q2’24 averaged +15.6% annualized gains, about double the long-term stock-market average! And that’s heading higher, after early August’s Japanic fear spike stopped out more trades with big realized gains. We’ve been refilling our newsletter trading books since, as gold-stock prices remain way too low relative to their phenomenal fundamentals at lofty prevailing gold levels.
GDXJ’s latest upleg has powered 59.2% higher at best over 9.4 months into mid-July. That’s still modest by historical precedent, and smaller gold miners’ gains really accelerate later in gold uplegs. The longer and higher gold climbs, the more bullish sentiment that fuels which attracts back traders to chase big gold-stock gains. Eventually a psychological tipping point is reached and that buying becomes self-feeding.
For 33 quarters in a row now, I’ve painstakingly analyzed the latest operational and financial results from GDXJ’s 25-largest component stocks. Mostly mid-tiers, they now account for 65.6% of this ETF’s total weighting. While digging through quarterlies is a ton of work, understanding smaller gold miners’ latest fundamentals really cuts through the obscuring sentiment fogs shrouding this sector. This research is essential.
This table summarizes the GDXJ top 25’s operational and financial highlights during Q2’24. These gold miners’ stock symbols aren’t all US listings, and are preceded by their rankings changes within GDXJ over this past year. The shuffling in their ETF weightings reflects shifting market caps, which reveal both outperformers and underperformers since Q2’23. Those symbols are followed by their recent GDXJ weightings.
Next comes these gold miners’ Q2’24 production in ounces, along with their year-over-year changes from the comparable Q2’23. Output is the lifeblood of this industry, with investors generally prizing production growth above everything else. After are the costs of wresting that gold from the bowels of the earth in per-ounce terms, both cash costs and all-in sustaining costs. The latter help illuminate miners’ profitability.
That’s followed by a bunch of hard accounting data reported to securities regulators, quarterly revenues, earnings, operating cash flows, and resulting cash treasuries. Blank data fields mean companies hadn’t disclosed that particular data as of the middle of this week. The annual changes aren’t included if they would be misleading, like comparing negative numbers or data shifting from positive to negative or vice-versa.
Weeks before Q2 earnings season even began, I predicted last quarter would prove gold miners’ most-profitable ever in a late-June essay on “Gold Miners’ Record Quarter”. But despite my high expectations, the smaller gold miners’ epic Q2 performances exceeded them! This still-mostly-unloved sector is firing on all cylinders. Yet the vast majority of traders remain unaware, leaving massive room to chase this bull.

The GDXJ top 25 experienced some major composition changes over the past year, with five smaller gold miners rocketing up into these elite ranks. All are mid-tier and junior producers, which usually have way-better fundamentals than streamers, royalty companies, and explorers. So GDXJ is becoming purer as traders bid better producers’ stocks much higher, increasing this ETF’s upside leverage to higher gold prices.
These GDXJ-top-25 stocks are mostly an expanded subset of the GDX-top-25 majors. I analyzed their new Q2 results in last week’s essay, which were also awesome yet still not as impressive as GDXJ’s. These GDXJ-top-25 stocks representing 65.6% of this ETF are also collectively weighted at 25.3% in GDX. GDXJ effectively lops off GDX’s nine largest holdings, which are mostly deadweight super-majors.
Those gigantic gold miners perpetually struggle to overcome depletion at the vast scales they operate. So their output generally shrinks, except for four quarters after expensive acquisitions. Their extensive stables of mines also tend to have higher costs, making for lower profitability. And because of far-larger market capitalizations, super-majors’ stocks are much harder to bid higher during major gold uplegs.
Production growth trumps everything else as the primary mission for gold miners. Higher outputs boost operating cash flows which help fund mine expansions, builds, and purchases, fueling virtuous circles of growth. Mining more gold also boosts profitability, lowering unit costs by spreading big fixed operational expenses across more ounces. The GDXJ top 25 eked out 0.4%-YoY output growth to 2,937k ounces in Q2.
While small, that extended mid-tiers’ production-growth streak to eight of the last nine quarters! That’s quite impressive, especially compared to the GDX majors’ overall output sliding lower for six quarters in a row now. The big composition changes in GDXJ’s upper ranks didn’t affect that comparison much. Also in the comparable Q2’23, South Africa’s Harmony Gold and China’s Zhaojin Mining hadn’t reported results yet...
* * *
Read Full Story »»»
DiscoverGold
Gold Miners' Performance vs. Gold -- Does It Say Sell Gold?
By: Carl Swenlin | August 22, 2024
In Monday's DecisionPoint Trading Room video, we were asked why we cover Gold Miners (GDX) as well as Gold (GLD). There are two reasons:
1. Some people prefer to own the commodity, Gold, and others prefer to own an operating company that benefits from the price of Gold, such as Gold Miners. For a profitable mining company, when Gold increases in value, most of the increase goes straight to the bottom line because cost of goods is already paid for.
2. Other people prefer Gold Miners because they may pay a dividend, and typically they out-perform Gold by a lot. That applies to movement in both directions. That is to say, Gold Miners will typically go up faster than Gold, but Miners also go down a lot faster than Gold.
This morning, I heard a money manager who asserted that people who own Gold should be selling it because, while Gold has been making all-time highs, Gold Miners need to advance another +50% to equal its 2011 all-time highs. The chart confirms that, but there is more to consider in this regard.
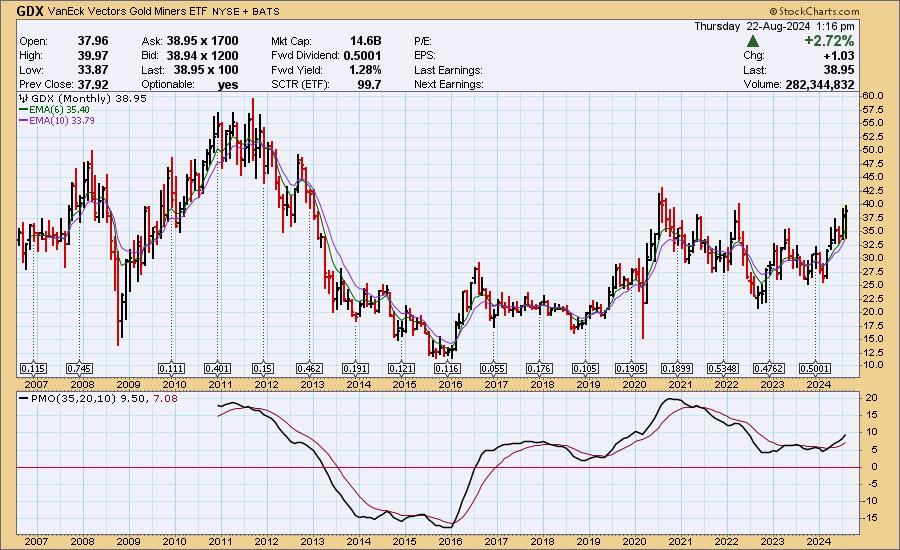
Here is a performance chart comparing the two from the 2011 top to the present, and we can see that GDX has underperformed GLD by about half.
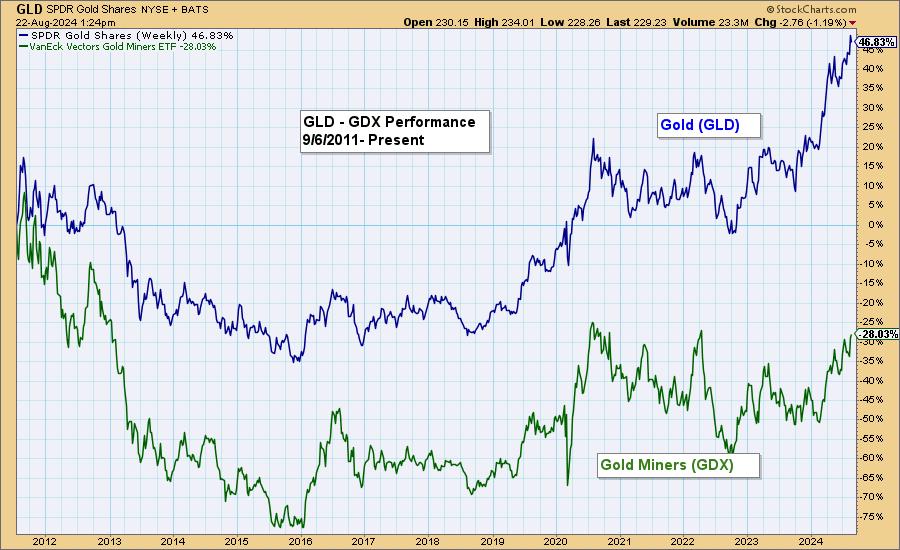
But let's look at just the decline from the 2011 top to the 2015 lows. We can see that GDX fell at an accelerated rate, driven by the negative sentiment associated with GLD's decline.
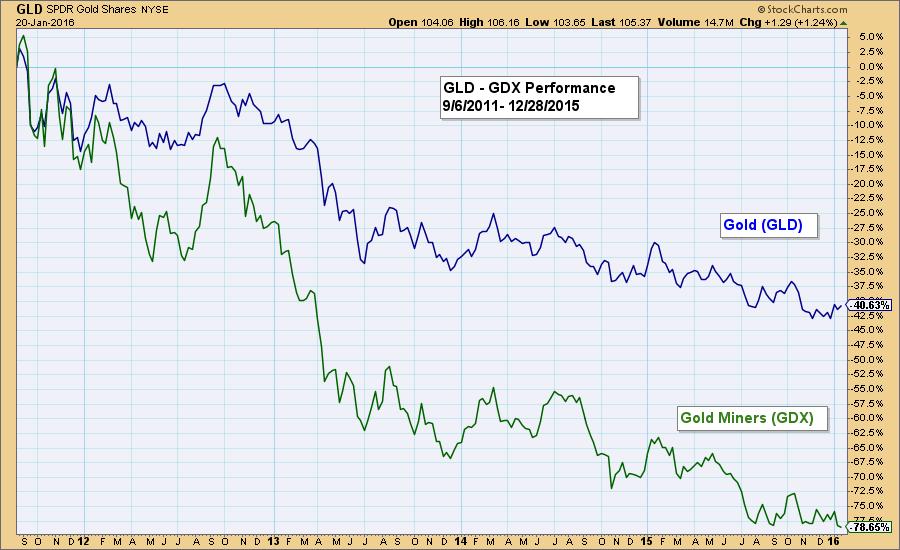
The chart showing the performance from the 2015 lows shows that GDX has out-performed GLD by a lot, as we would expect; however, GDX took a -45% hit in 20 because of the securities bear market. Also, GLD had a rather tedious two-year sideways episode in 2020 to 2022, which would have been uninspiring to potential Miners investors. Nevertheless, GDX is still out-performing GLD by a considerable amount.
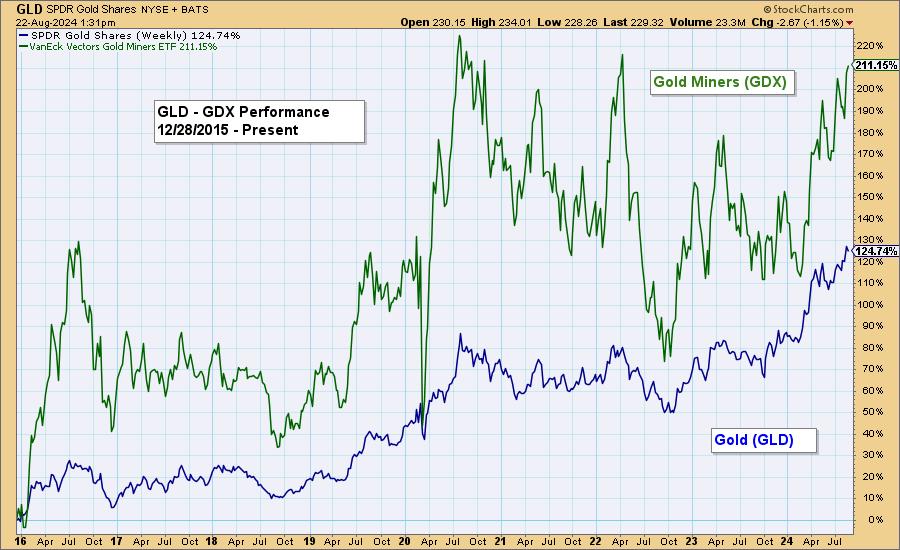
Conclusion: While the assertion that GDX underperformance since the 2011 all-time high justifies avoiding Gold, I think the premise does not consider all the evidence. Most important was the 2022 hit, which drove GDX down over -2.5 times more than GLD. That had less to do with Gold's prospects than it did with general bear market panic.
Read Full Story »»»
DiscoverGold
|
Followers
|
149
|
Posters
|
|
|
Posts (Today)
|
0
|
Posts (Total)
|
5683
|
|
Created
|
06/29/08
|
Type
|
Free
|
| Moderators DiscoverGold trunkmonk | |||

http://www.vaneck.com/index.cfm?cat=3192&tkr=GDX&LN=3-02
The Gold Miners ETF seeks to replicate as closely as possible, before fees and expenses, the price and yield performance of the NYSE Arca Gold Miners Index. The Index provides exposure to publicly traded companies worldwide involved primarily in the mining for gold, representing a diversified blend of small-, mid- and large-capitalization stocks. As such, the Fund is subject to the risks of investing in this sector.
| ||||||||||||||||||||||||||||||||||||||||||||||||||||||||||||||||||||||||||||||||||||||||||||||||||||||
| DAILY |
| WEEKLY |
| Volume | |
| Day Range: | |
| Bid Price | |
| Ask Price | |
| Last Trade Time: |


