


| Followers | 689 |
| Posts | 143761 |
| Boards Moderated | 35 |
| Alias Born | 03/10/2004 |
Saturday, July 09, 2022 11:13:50 AM
By: Jordan Roy-Byrne | July 9, 2022
Gold and Gold stocks have fallen to levels from which we should see excellent returns over the next 12 months and potentially spectacular over the long term. However, that does not mean a bottom and reversal are imminent.
Concerning the gold stocks, the indicators are extremely oversold and have reached levels similar to the 2020 and 2018 bottoms.
You will rarely hear a technician say this, but whether markets make an oversold bounce or the actual bottom depends on fundamentals. Concerning precious metals, Fed policy changes have been quite significant.
In late 2018, Gold and gold stocks rebounded and sustained gains around the time of the Fed’s last interest rate hike. The Gold breakout in 2019 occurred when the Fed cut interest rates for the first time in over a decade.
The Covid crash low occurred as the Fed cut rates to 0 and the market sensed massive fiscal stimulus and transfer payments. In 2008, the Fed cut rates to 0 a month before the October bottom.
I could go on but you get the point.
Gold and gold stocks are struggling because the market continues to anticipate rate hikes through the end of the year. When the market and economic outlook force the Fed to stop, Gold and gold stocks will rebound violently, if they remain extremely oversold as they are now.
Before we get to the breadth indicators, let us focus on price.
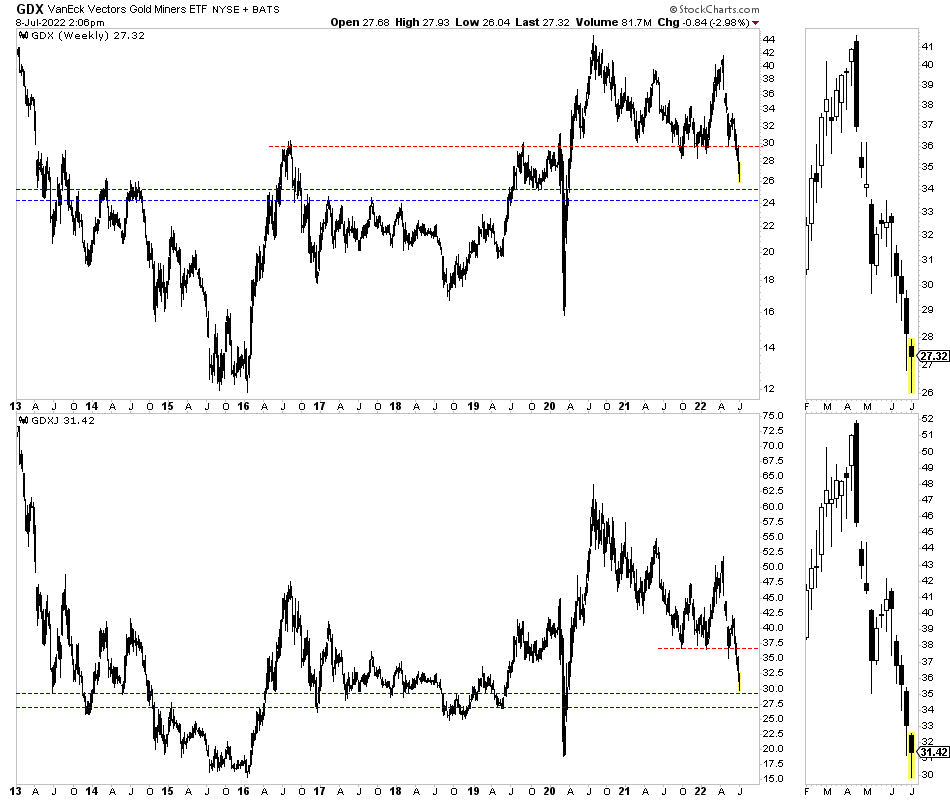
The weekly candle charts for GDX and GDXJ are below.
After a nasty 12 weeks of decline, the miners are sporting bullish hammers. They could rally for at least a few weeks.
The red lines show initial resistance targets, while the blue lines show strong support targets if this week’s lows did not mark the bottom.
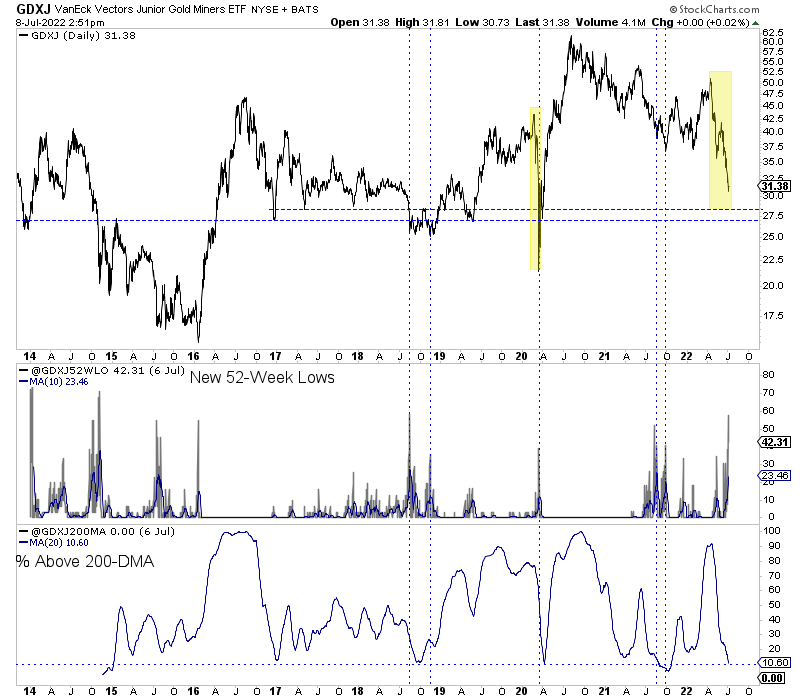
A few days ago, 58% of GDXJ stocks made a new 52-week low. That is tied with the highest single-day mark of the past seven years.
Also, the percentage of GDXJ stocks trading above the 200-day moving average (smoothed by a 20-day average) is at the second-lowest level of the past seven years.
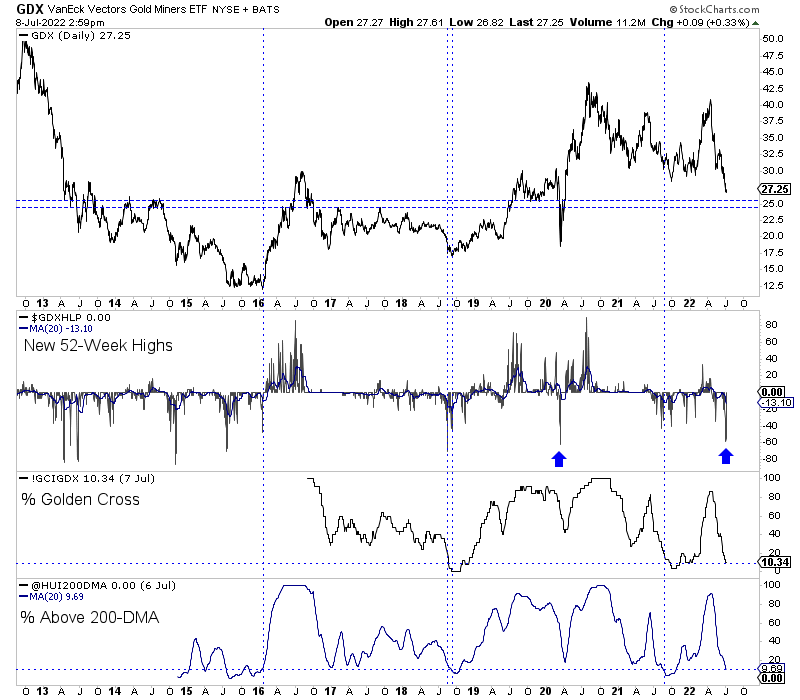
Also, 59% of GDX stocks made a new 52-week low a few days ago. That was in line with the August 2018 and March 2020 lows data.
Meanwhile, Gold has broken below support at $1780 and $1750.
It has key support at the 40-month moving average ($1720) and a confluence of support around the 2021 lows at $1675.
Technicals and sentiment indicators (which are not yet extreme) suggest Gold could easily fall and test those support levels. Perhaps that would coincide with a final selloff in the gold stocks.
The turning point for precious metals will align with or begin as the market senses a shift in Fed policy. Whether July or September is the last rate hike, I expect the turn to be in August or September.
Read Full Story »»»
 DiscoverGold
Information posted to this board is not meant to suggest any specific action, but to point out the technical signs that can help our readers make their own specific decisions. Caveat emptor!
• DiscoverGold
Recent GDX News
- YieldMax GDXY Name Change • GlobeNewswire Inc. • 01/25/2024 04:22:00 PM
Element79 Gold Corp Appoints Warren Levy to Board of Directors • ELMGF • Aug 28, 2024 9:51 AM
Integrated Ventures Announces Strategic Entry Into Health & Wellness Industry with Focus on GLP-1 Products • INTV • Aug 28, 2024 8:30 AM
ELEMENT79 ANNOUNCES UPLISTING TO OTCQB VENTURE MARKET • ELMGF • Aug 26, 2024 10:03 AM
North Bay Resources Announces Gold Assays up to 2.2 Ounces per Ton, Fran Gold Project, British Columbia • NBRI • Aug 26, 2024 10:00 AM
PickleJar Unveils Latest Venue Managed Services Innovations in Upcoming Webinar • PKLE • Aug 23, 2024 1:11 PM
Element79 Gold Corp Provides Update on Nevada Portfolio • ELMGF • Aug 23, 2024 8:00 AM

