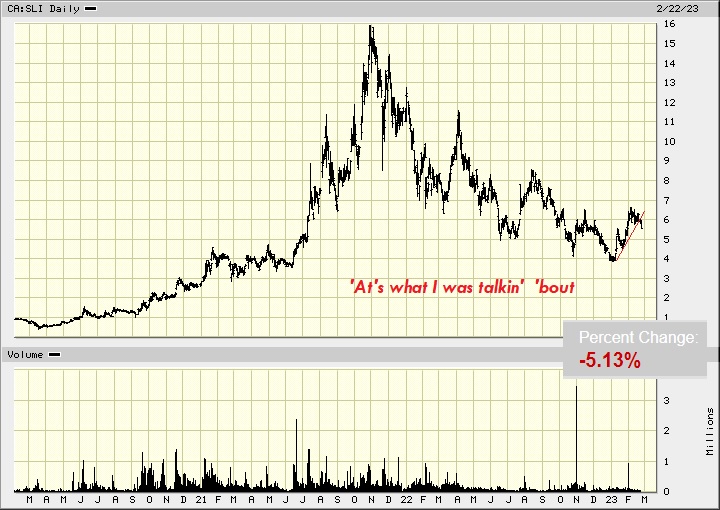
Well it looks like I was figuring it would go .10 cents lower but evidently I was wrong. That December 29th chart low WAS the tax-loss selling buy of perhaps I dunno - a decade. It's currently testing its' up 50% ! 2 month uptrend !tho ..... Is totally potentially vulerable now. That was just absurd. This January / February has been hard to buy into ANY EV metal plays for me. I get wrapped up watching Bitcoin for fun. It's overly entertaining.
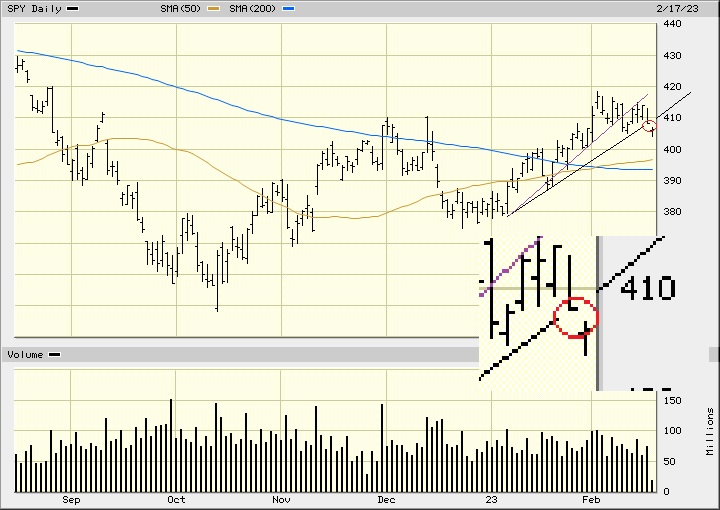
I've monitored the S&P doing this here (it's NOW at 399) ;
Between interest rate decisions, surprise holiday weekends, earnings volatility, etc., etc. it's......like - it's tempting to get someone else to do it
.
It's like monitoring all of this stuff is just nuts - iT'S LIKE DRIVING a submarine
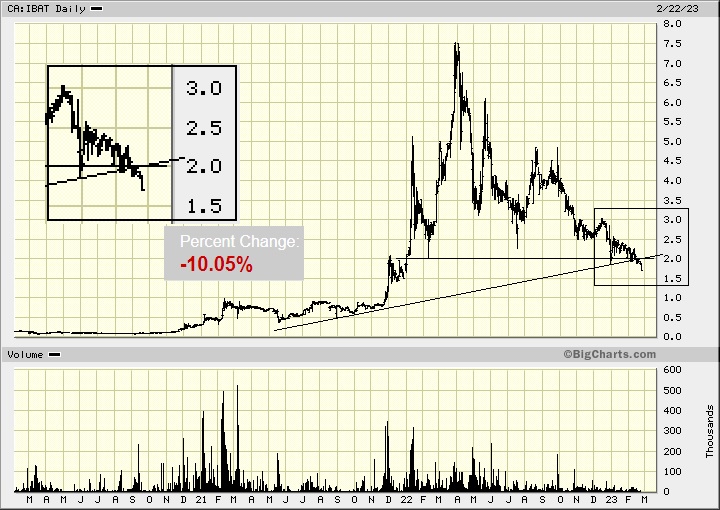
For eg. : So why is the IHub chart symbol all messed up here ?
Who wants to navigate that ?
Get it changed from London to of course its' Toronto listing.
 Market Data
  Markets