


Well it looks like I was figuring it would go .10 cents lower but evidently I was wrong.
That December 29th chart low WAS the tax-loss selling buy of perhaps I dunno - a decade.
It's currently testing its' up 50% ! 2 month uptrend !tho .....
Is totally potentially vulerable now. That was just absurd.
This January / February has been hard to buy into ANY EV metal plays for me.
I get wrapped up watching Bitcoin for fun. It's overly entertaining.
I've monitored the S&P doing this here (it's NOW at 399) ;
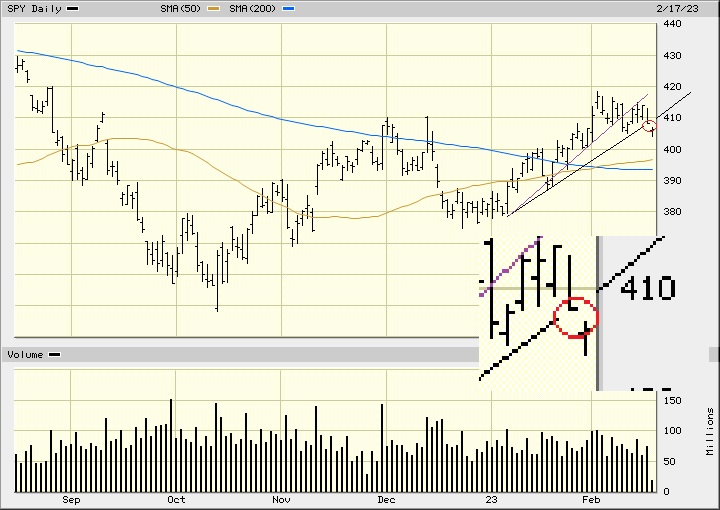
Between interest rate decisions, surprise holiday weekends, earnings volatility, etc., etc. it's......like -
it's tempting to get someone else to do it
.
It's like monitoring all of this stuff is just nuts - iT'S LIKE DRIVING a submarine
For eg. : So why is the IHub chart symbol all messed up here ?
Who wants to navigate that ?
Get it changed from London to of course its' Toronto listing.
.
Please Note : No mud-slinging, bad-mouthing, rudeness, disparagement, derision, defamation, slander, slurs, abuse or deep-seated bitter resentment, towards my use of price charts please.......Thank-you very much.
Recent SLI News
- Form 6-K - Report of foreign issuer [Rules 13a-16 and 15d-16] • Edgar (US Regulatory) • 04/22/2026 12:45:04 PM
- Standard Lithium Reaches Major Operational Milestones at Arkansas Demonstration Plant • GlobeNewswire Inc. • 04/22/2026 12:30:00 PM
- Form 6-K - Report of foreign issuer [Rules 13a-16 and 15d-16] • Edgar (US Regulatory) • 04/10/2026 09:12:59 PM
- Form 6-K - Report of foreign issuer [Rules 13a-16 and 15d-16] • Edgar (US Regulatory) • 03/30/2026 12:15:03 PM
- Form 40-F - Registration statement [Section 12] or Annual Report [Section 13(a), 15(d)] • Edgar (US Regulatory) • 03/30/2026 12:01:07 PM
- Standard Lithium Reports Fourth Quarter and Full Year 2025 Results • GlobeNewswire Inc. • 03/30/2026 12:00:00 PM
- Form 6-K - Report of foreign issuer [Rules 13a-16 and 15d-16] • Edgar (US Regulatory) • 03/16/2026 12:45:05 PM
- Standard Lithium Bolsters National Security Focus by Adding Expert Critical Minerals and Defense Advisors • GlobeNewswire Inc. • 03/16/2026 12:30:00 PM
- Form 6-K - Report of foreign issuer [Rules 13a-16 and 15d-16] • Edgar (US Regulatory) • 03/09/2026 10:00:08 AM
- Smackover Lithium Signs First Binding Customer Offtake Agreement for the South West Arkansas Project • GlobeNewswire Inc. • 03/09/2026 07:00:00 AM
- Gabelli Hosts 17th Annual Specialty Chemicals Symposium • GlobeNewswire Inc. • 02/24/2026 01:00:00 PM
- Form 6-K - Report of foreign issuer [Rules 13a-16 and 15d-16] • Edgar (US Regulatory) • 12/09/2025 01:15:04 PM
- Smackover Lithium Receives Indications of Interest for Over $1 Billion in Project Finance for the SWA Project • GlobeNewswire Inc. • 12/09/2025 01:00:00 PM
- Form 6-K - Report of foreign issuer [Rules 13a-16 and 15d-16] • Edgar (US Regulatory) • 11/18/2025 01:45:03 PM
- Standard Lithium to Participate in Multiple Upcoming Investor Conferences • GlobeNewswire Inc. • 11/18/2025 01:30:00 PM
- Form 6-K - Report of foreign issuer [Rules 13a-16 and 15d-16] • Edgar (US Regulatory) • 11/10/2025 01:15:06 PM
- Form 6-K - Report of foreign issuer [Rules 13a-16 and 15d-16] • Edgar (US Regulatory) • 11/10/2025 01:00:17 PM
- Standard Lithium Reports Third Quarter 2025 Results • GlobeNewswire Inc. • 11/10/2025 01:00:00 PM
- Form 6-K - Report of foreign issuer [Rules 13a-16 and 15d-16] • Edgar (US Regulatory) • 11/05/2025 01:45:03 PM
- Smackover Lithium Files Maiden Inferred Resource for Its Franklin Project in East Texas, Containing the Highest Reported Lithium-in-Brine Grades in North America • GlobeNewswire Inc. • 11/05/2025 01:30:00 PM
- Form 6-K - Report of foreign issuer [Rules 13a-16 and 15d-16] • Edgar (US Regulatory) • 10/30/2025 08:20:04 PM
- Smackover Lithium Receives Key Final Integration Approval from the Arkansas Oil and Gas Commission for South West Arkansas Project • GlobeNewswire Inc. • 10/30/2025 08:05:00 PM
- Form 6-K - Report of foreign issuer [Rules 13a-16 and 15d-16] • Edgar (US Regulatory) • 10/27/2025 12:33:31 PM
- The Strategic Rise of Phosphate in Clean Energy and Defense • AllPennyStocks.com • 10/27/2025 12:00:00 PM
- Standard Lithium Closes $130 Million Underwritten Public Offering • GlobeNewswire Inc. • 10/20/2025 02:31:58 PM


