 News
News  Market Data
  Discover
Support: 888-992-3836
Copyright © 2023 InvestorsHub Inc.


tradero
![]()
Register for free to join our community of investors and share your ideas. You will also get access to streaming quotes, interactive charts, trades, portfolio, live options flow and more tools.
Register for free to join our community of investors and share your ideas. You will also get access to streaming quotes, interactive charts, trades, portfolio, live options flow and more tools.
Thanks Golfho for your insight.
Yes, it is very interesting that our projections give quite similar results.
Anyway, a model is just a tool that can give us some rough estimates, it can never fit 100% reality. So your warning not to make an investment decision based on these predictions is very appropriate.
It actually made me laugh  .
.
Nevertheless it can give us some sort of reference point.
Cheers
Wook, I am afraid 114 seems a bit unrealistic
this is the chart that my model would give

As you can see 1st lookin (according to my model) would have taken place before year end...
Anyway, The later the better
Thx EX for the explanation.
About 500-530 might be a reasonable guess, but all we can do is guess.
We still don't know that number but we can assume 33% 582 which is 192.
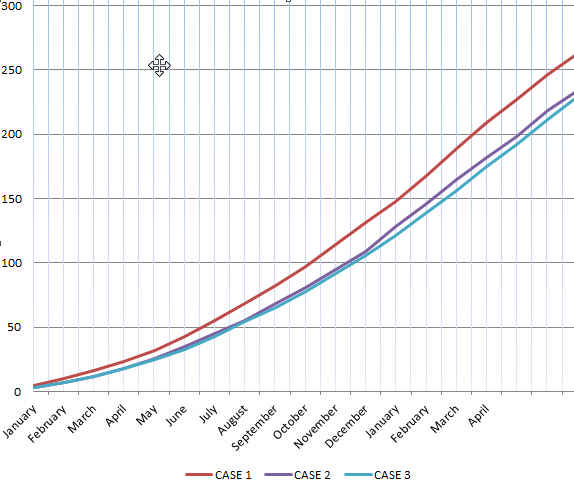
Conclusions from the Lookins Projections
(it follows #245613 )
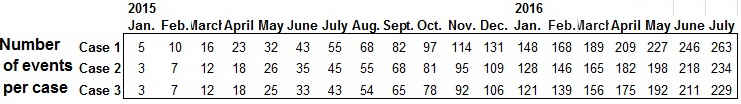
Zooming in the resulting chart from the eventing projections

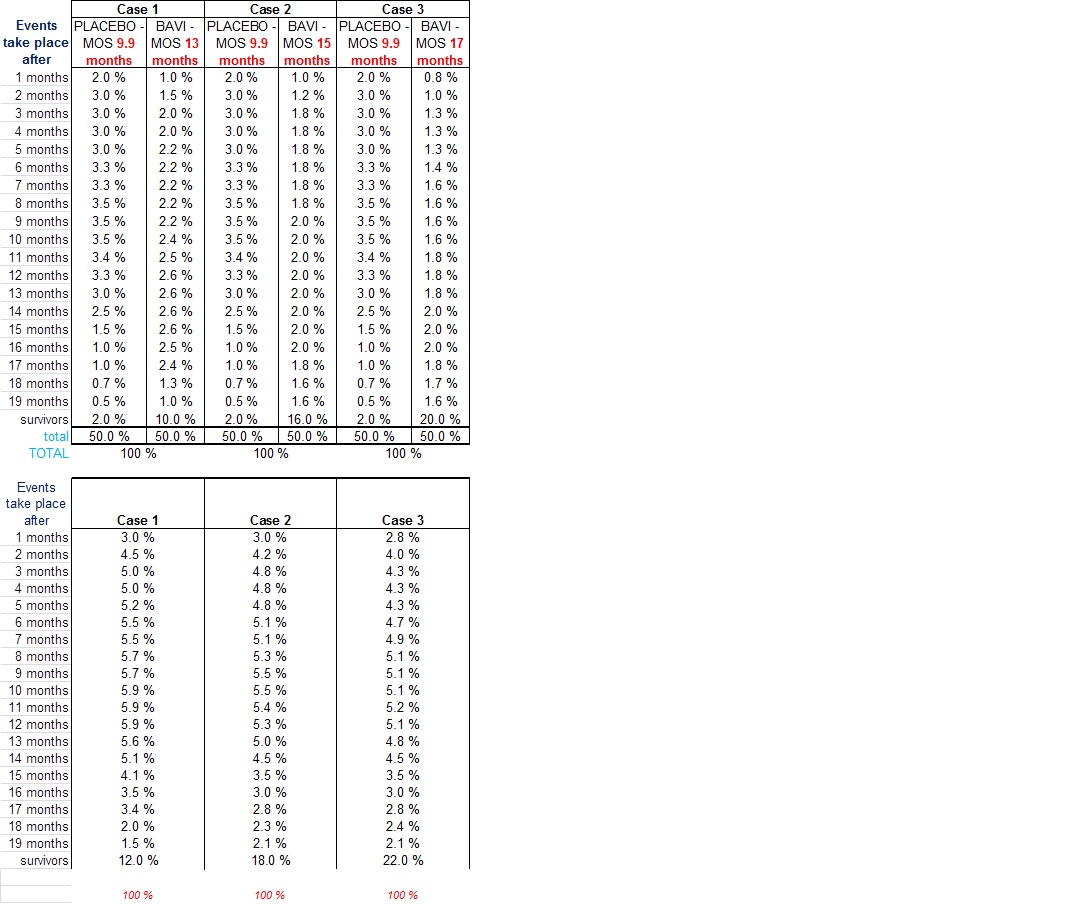
CASE1: BAVI 13 Months MOS. Placebo 9.9 MOS
CASE2: BAVI 15 Months MOS. Placebo 9.9 MOS
CASE3: BAVI 17 Months MOS. Placebo 9.9 MOS
Now, I am unclear on how many events will be needed for the 1st Lookin. I for one would appreciate some clear insight on this matter from any knowledgeable poster.
So I drew two possible cases:
a.166 events for 1st Lookin
b.200 events for 1st Lookin
From the chart, (a) February 1st (up to March 15th? if (b)) we could have the 1st Lookin if Bavi MOS is 13 months
From the chart, (a) March 1st (up to May 1st? if (b)) we could have the 1st Lookin if Bavi MOS is 15 months (*)
From the chart, (a) March 15th (up to first week of May if (b)) we could have the 1st Lookin if Bavi MOS is 17 months (*)
(*) IMPORTANT. As I said in my previous post “Given that in all cases the distribution only shows up to 20 months, For Cases 2 & 3… beyond 19 months all patients alive are considered as survivors when they might have evented at 21 months etc… So, curves for Cases 2 & 3 are a limit on the right side for the Lookins (should take place before that)”
1st LOOKIN PROJECTIONS (fine tuning)
(continues from #245612 )
I have tried to make some fine tuning to the previous models I made for the Lookins Projections.
For the MOS monthy distribution instead of using 2 months intervals… now 1 month intervals will be used. Also the eventing monthly distributions have been taken for a more reliable source such as the Herbst trial results. This trial seems to be the one that resembles Sunrise the most (MOS 9.9 for placebo) from the patient population point of view. This is the chart for the Overall Survival in that trial.
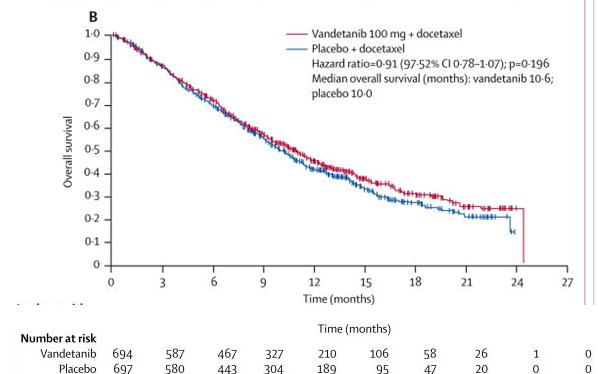
For the model, the monthly distribution for the Placebo Arm will be taken from this chart data (blue curve… 697, 580, 443, etc. data)… The curves (distribution curves) for the Bavi arm will follow that same shape but making sure that the MOS are respectively: 13, 15 and 17 months. The result is the following table.
Now we apply these “eventing” percentages to the table below which shows for a particular month (columns): the Number of patients who have been enrolled a “X” number of months (raws).
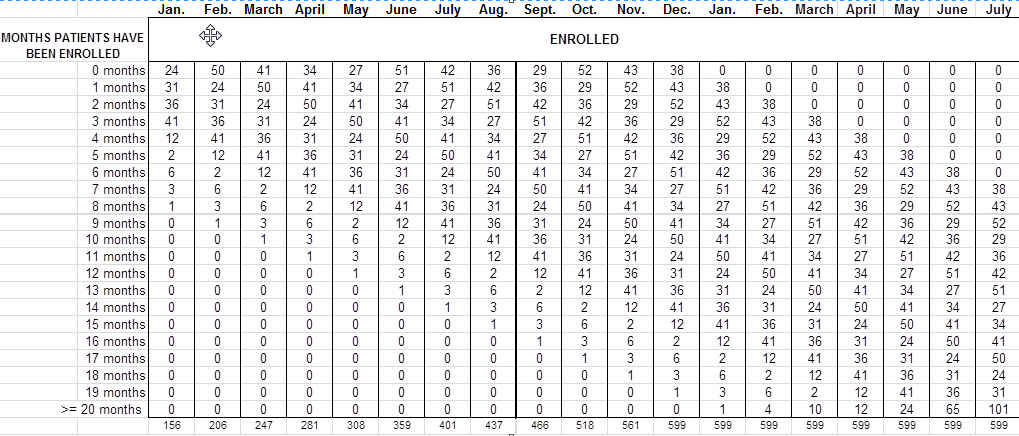
This way (according to the model) we will obtain the number of patients who have evented at a particular month
Given that in all cases the “eventing” distribution only shows up to 20 months, that means that specially for Cases 2 & 3… beyond 19 months all patients alive are considered as survivors when they might have evented at 21 months etc… So, curves for Cases 2 & 3 are a limit on the right side for the Lookins (should take place before that)
ENROLLMENT REFLECTIONS
There has been some controversy regarding what SK said about the 90% of enrollment and what that could mean.
We can gather some conclusions by applying some enrollment modelling.
This model is based on Golfho’s model that takes into account the moment when Centers joined Sunrise and then I made some variation of enrolling 1 patient after 16 or 17 weeks, alternatively every month.
And these are the results (patients enrolled):


The curve clearly fits the “hockeystick” type curve, and PPHM mentioned that this type of curve was potentially possible as stated by Shan and SK.
(On dec 10th 2013 exactly 2 years from the last CC) Joseph S. Shan - Vice President of Clinical & Regulatory Affairs
“Again if it is sort of event driven. So that's, like Steve mentioned earlier, a function of enrollment if the enrollment curve more of a hockey stick or more of a flatline…”
Now, the former reasoning only tells us that the above hypothesis may not be too far off and that actually there is quite a chance that the model resembles pretty well reality.
With this set of mind, please take a look at the number of patients that would be enrolled this month: 38 patients, which is around a 6% of the total and fits with the more than 90% of enrollment, as stated by SK.
CP, I have searched all the transcripts from PPHM CCs (plus 2013 ASM) and cant find Shan saying anything about enrollment being of a bell curve type.
On the contrary I think he considers the possibility of a hokeystick type enrollment
This is from Dec 10th 2013
George B. Zavoico - University of Virginia
And finally, with regard to the duration of enrollment you said too -- and I haven't looked at the clinicaltrials.gov, so forgive me if it's already in there. I imagine the overall survival look is about a year. So with a 2-year enrollment, if you meet that, then top line results in about 3 years then?
Joseph S. Shan - Vice President of Clinical & Regulatory Affairs
Again if it is sort of event driven. So that's, like Steve mentioned earlier, a function of enrollment if the enrollment curve more of a hockey stick or more of a flatline -- Straighter line slope, then that will determine when we think the number of events necessary will hit. But it's really hard to say right now when exactly it will reach the final number final of events and of course, the interim analyses are another factor.
====
and this another SK's comment
Steven W. King (9-9-2014)
Yes, I think we haven’t given a lot of additional details other than you know the fact that again that trial is also getting up to close to full steam as far as number of sites involved in the study and it most critical with of course once you get all the sites up running and that’s when you reach the maximum enrollment rates. So at this point, I mean we are simply saying that we are on track for the initial estimate less than two-year enrollment and can if we first start to deviates significantly when – other for that will let everyone know but at this point we feel comfortable that we are on track.
===
Do you remeber when Shan talked about the bell curve enrollment type?
A4R, when there is a "hockeystick" type enrollment such as PPHM said there would be, the number of enrolled patients during the final months should not be small ...
What I mean by that is that if enrollment is expected to happen by EOF, the number of patients enrolled in December could/should be relatively significant and therefore we need to wait for that time to elapse before being able to state that enrollment is complete
Yet, SK said it is going as planned and for me that is good news
Thank you RR for your insight EOM
But before I get to that I'd like to ask anyone if they have a transcript of the 2014 annual shareholders meeting.
Maybe you missed your late info... check it out 
Right Bio,
This is an old post of yours
http://investorshub.advfn.com/boards/read_msg.aspx?message_id=106681471
We should not forget either that a big part of the Centers opened to Sunrise are in Europe and linked to the Social Security of the country. I can assure you that VERY few would be able to afford the $100000 Opdivo treatment
Krakonos.... Yeahhh! You are right. I guess my eyesight failed me
Paul, let me try to explain the way the calculation has been done.
First the definition of median:
“denoting or relating to a value or quantity lying at the midpoint of a frequency distribution of observed values or quantities, such that there is an equal probability of falling above or below it”
An example. Suppose we have this series of numbers:
1, 3, 5, 6, 8, 9, 16, 18, 98 … The median is “9” , because it is the one that is in the middle.
Now, we are dealing with a whole series of figures representing the numbers of months that a set of patients have lived or survived since they started treatment. So, in the “Case 1” example that you mention and for the cell “7 months” we have (5 + 11) 16 % on its left and another (10 + 5 +1) 16% (what a coincidence) on its right… that means that the median is got to be in that group (7 months).
Hope it helps
Cheers
I guess it all depends where the limit for Docetaxel is. We would be talking of about 100 patients (a significant statistical number) for the Placebo arm.
I thought that 9 months was tops...
Well, unless the Placebo they are using is like some "illustrious" poster used to think of Bavi... or at least that was what he said...
Did I say "used"... maybe he still does LOL
cheers
Paul, I am not sure I understand your question
shouldn't the number of survivors after 11 months equal 50% of the patients? Your tables show fewer than half of the patients in the over the median break point.
This simulation precludes that enrollement is "on track and on target" right?
BioBS, as I said... With the enrollment curve that I used, a Placebo 7MOS vs a Bavi 9MOS scenario showed that 1st lookin would happen in 2015, so if what mgmt. stated is correct (1st lokin in 2016) this seems to be impossible. Much less a Placebo 7MOS vs a Bavi 8MOS
would it be possible to run a scenario and share the case where Placebo and BAVI show very little difference in MOS - for e.g. 7 v/s 8 months or 10 v/s 11 months


LOOKINs Projections.Part III:Results and Conclusions
(continues from posts #241019 and #241020)
As I said earlier we will base all calculations on the enrollment numbers explained in part I, which seem pretty reliable if enrollment completion happens this December.
These enrollment number have been split and distributed in different enrollment groups per month as shown on the table below. To make things clear it will only show from Jan. 2015 onwards.

We saw in Part II that a MOS of 7 months for Placebo and of 11 months for Bavi gave some results that said that 1st lookin should have already taken place. So this means that MOS should be higher than that. This is VERY good news for PPHM because MOS for Bavi should be higher than 11 months
So let’s see which MOS to test:
- For Placebo we can try a 9 months MOS (top of the range for placebo since historically it seems that it has NEVER been more than that). Using this 9 months number means playing conservative for the Bavi MOS, because we would be in the low range expectations for Bavi. An actual lower MOS for Placebo would give a higher MOS for Bavi.
- For Bavi we will start with a MOS of 15 months, then for 17 and finally for 19 months.
In all cases we will use “spreadout” distribution for MOS, since as we saw in Part II this yields to shorter dates for 1st lookin… and thus we would be advancing the date for the 1st lookin compared to if we would use a more “concentrated” approach.
So let’s see what happens with these cases

And these are the results:

The overall chart:

Case1 corresponds to BAVI 15 MOS
Case2 corresponds to BAVI 17 MOS
Case3 corresponds to BAVI 19 MOS
Let’s zoom in the chart:

So the results say that, with a Placebo of 9 months MOS… 1st Lookin might happen in:
? BAVI with 15 MOS around 1st half of January
? BAVI with 17 MOS around 1st half of February
? BAVI with 19 MOS around 2nd half of February
(Don’t forget that in Part II we saw that because of the lack of 100% accuracy in the MOS distribution tables there might be an error margin of 1 week if the real distribution is “spreadout” and of 3 weeks if it is “concentrated”.)
It is clear that the later the 1st Lookin happens the higher the MOS is… and the better for BAVI
This exercise has followed the rule that whatever takes place within a month has been considered to happen at the end of the month, i.e. “delaying” the action. In the same way we have considered that 1st Looki takes place after 200 events, when as some people indicated on the board… because of patient censoring this number should be somewhat lower. Again our approach is delaying the result than the actual one and all these “calculation” delays are favorable to a higher Bavi MOS.
Also we shouldn’t forget that there might be a time gap from actually reaching the Lookin and PPHM knowing this has happened and therefore PRing it.
Notes.
Of course, this is guesswork based on reasonable assumptions and with best of intentions. It is very likely that it may not get close to what really is going on, but nonetheless it can give us some orientation.
In regard to the MOS simulation tables, I have designed them using “my” common sense which may not be in close agreement with reality. So I would appreciate if somebody in the Board could share some insight on this respect in order to arrive to a more accurate result. Anyway, back in Part II we saw the range of this error margin.
I welcome comments, suggestions and possible corrections of the assumptions I have taken.
I am pretty confident in the Enrollment model IF enrollment ends in late December
If someone has some suggestion regarding the MOS distribution, please let me know them and now that the Excel tool is working… results come automatically
The excel file (Visual Basic included) is also available to whoever wants it.
LOOKINs Projection. Part II: the MOS model approach
We are taking for granted that doses – Placebo and Bavi - are given alternatively. So at any moment in time the distribution of the doses should be: 50% Placebo and 50% Bavi.
Let’s take a look at an example for this distribution of “eventings”

When designing these distribution tables, It is easy to organize the data in such a way that the Median of each situation corresponds to the specified label (mind you, I said Median, not mean or average).
The question is to what extent the variations of the distribution of these data (spread or concentrated) impacts the final result. To find out, let’s compare it to other different distributions …
First to another variation of the same “spreadout” kind

and finally to the extreme case of concentrated data.

The result of the comparison goes as follows:

We can see that at most (this corresponds to comparing it with the “concentrated “ distribution (specially at the low end) the difference is about 3 weeks. But the difference between the other two “spreadout” distributions is about 1 week, which can give us an idea of the error margin of the final calculations.
Though these distributions are guesswork I find this error margin acceptable, or in other words just to keep it in mind.
If we pay some attention to these results for this particular case of MOS (Placebo 7 months, Bavi 11 months), we see that 1st lookin should take place within 2015. Now, mngt expects 1st lookin to take place later than that. This may tell us that the health of patients, or rather that the performance of Bavi is much better. So the 7 MOS for the Placebo arm or the 11 MOS for the Bavi arm should be increased. These other MOS distributions for both Placebo and Bavi are analyzed In Part III.
All these results have been obtained using a tool I have developed with Visual Basic in an ExcelSpreadSheet. Once the MOS distribution cases are designed the results come out automatically.
For results and conclusion please see PartIII
LOOKINs Projections. Part I: Enrollment Model
Back in the summer I posted some projections for the Lookins in SUNRISE (see post # 227246), that now as things have been developing I would like to update and somewhat tune in as best as I can.
In order to make my message more understandable and easier to digest, I will break it down into 3 parts:
• The Enrollment Model I am using,
• the MOS model approach I have taken and
• results and conclusions.
THE ENROLLMENT MODEL:
As I did in the past, I will use Golfho’ work on the subject - his new Excel Sheet on this occasion. This time I will utilize his new approach based on weeks instead of months, that he kindly shared with me and that will hopefully render more accurate results.
The starting point is the recorded schedule for Opening Centers which goes as follows:

With this new “weekly” approach, we now have a finer enrollment “schedule” that allows us to fit its completion at the end of December (in my previous projection enrollment was supposed to finish beginning of November).
After some trial and error efforts… these were the assumptions that fit the best:
- Time since a Center signs in for SUNRISE till it has the FIRST patient enrolled (being treated) 19 / 18 weeks alternatively, one month 19 and next 18 and so on. The reason behind having at first a greater number of weeks is due to the amount of bureaucracy, training of medical staff for SUNRISE, paperwork, translation (when abroad), preparations in the Center to adjust to SUNRISE, etc. than later on won’t be needed.
- Once a Center has already had its first patient, the time lapse for another patient to be enrolled would be 16 / 17 alternating months as explained before.
These are the results for the Enrollment Projection. (anyone interested in seeing how these numbers came about I can send them the Excel file).
Number of patients enrolled per month (cumulative):


And this is the corresponding chart

The question is: How close is this curve to the real one?
Let’s take into account the following points:
1. The curve is definitely a “hockey stick” type, as Shawn had stated it would be
2. The starting and final points on this curve concurs with the real one (if enrollment ends in December as stated / expected by Mngmt).
3. This curve has been calculated taking into account the factual data for opening of Centers
So, all this leads me to believe that there shouldn’t be a major error if we take this enrollment data as the starting point of this exercise. Please go to Part II & III for more
Copper, thankkkkkkkk you! Much appreciated EOM
I suppose he was referring to the ASTRO presentation scheduled for October...
See slide 15 from the ASM... down left corner

I did not find any mention of the deal at the Astrazeneka's website...
Did anyone find any comment from AZ?
Unforunately this time I wont be able to travel the 6000 miles distance to Tustin, so I would be more than happy and thankful to gather as much info from the ASM as possible.
Thanks for your kind help
I dont understand that, but it is ok
I will try to connect a bit before 10:00 AM PT as they indicated
My alarm clock would have sounded long before that
8:oo AM EST?
View all »Events & Presentations
Oct 15, 2015 at 10:00 AM PT
Annual Meeting of Stockholders
Webcast Listen to webcast
Mickey sorry to hear that.
There have been lately quite a few articles on the press mentioning a new approach to fight cancer based on our own Immunological System. I have been following a small Pharma Company (Peregrine Pharmaceuticals, PPHM) and its amazing discovery on this field that I would like to share in the hope it can be useful to you. Sorry for my amateurish Medical explanations.
Late Dr. Thorpe (“the inventor”) found out that a lipid PS phosphatidylserine (PS), a highly immunosuppressive molecule normally located on the interior of cellular membranes… but, following stresses in the tumor environment, becomes exposed on tumor cells and cells that line tumor blood vessels, helping tumors to evade immune detection. Bavituximav (the drug developed to this effect) as a PS-targeting antibodies block this immunosuppressive signal, thereby enabling the immune system to better recognize and fight the tumor.
The rather outstanding preclinical data show that the combination of bavituximab (Bavi) and inhibitors of immune checkpoints reduce tumor-suppressive factors including myeloid-derived suppressor cells and confer increased tumor-specific immunity when compared to either treatment alone.
Bavi has a universal target, exposed PS, which is associated with many diseases. This is quite unlike the narrow targets available to the downstream immunotherapies. Those downstream I/Os like CTLA-4, PD-1, and PD-L1 targets are enriched by treatment (pre-treatment) with Bavi (as an upstream agent), allowing them much needed enhanced response rates. This occurs in the INNATE immune system.
Currently they are on a Phase III for lung cancer, etc. but all this info you can find on their website. http://www.peregrineinc.com/clinical-trials.html
Funny CB, all your reasonings are based on a SP of $1... None on a scientific ground.
Again, if you are so positive about your beliefs... (yes beliefs no facts, the only fact you have is SP $1)... then, given the absolute dedication you have to this board and also given that this is board is about making $... then I really hope you short like crazy this stock... This would be the sensible and coherent thing to do for you... right?
You see, my money is where my beliefs are...
Too bad you only found these negative points:
1) The pII after censoring was a very very small group. The statistical validity is low
2) Competition is heating up quickly, doxe is likely to not be soc at time of Sunrise unblinding
3) Enrollment is still only vaguely know (on track but no definition of ramp etc.)
4) Always risk of healthy control group
You are correct Jake,
i remember thorpe discussing chimeric vs fully human in one of his talks... fully human was not necessarily better in that (if i can recall) his explanation was the chimeric part may have been part of the immune response
that's good news... more institutional investors coming
Lemmy, at least in my post I admitted that what I said it was not a fact... The problem is that the criticism and doom and gloom of PPHM is not based on facts... It is based on what FUDers imagine the BoD will do, the supposed failure of Sunrise, etc. and YET it is presented as true as a Holy Scripture...
You also say "very deserved criticism..."... well I dont know, we should wait a little to really know what plan the BoD has. Dont you think? and not just guessing what they have in mind which BTW could not be more disasterous
I first thought not to reply to your post… Yet I am a bit sick and tired of this daily negative routine, so let me say a couple of things.
RE "If PIII- Sunrise is succesful I dont see the garbage anywhere"
Common problem - looking TOO far ahead. Consider what happens between now and then. Actually between months ago and then. Hasn't been pretty. Expect the trend to continue. Then consider how much dilution there will be to feed this monster cash burn and what that does to the share price. The dilution into oblivion scenario is alive and well as ever. We see the evidence of that every day as we look at the share price, the trend, and proposal # 3.
Thanks for your contributions to the board...
If PIII- Sunrise is succesful I dont see the garbage anywhere... Do you?
You mean you know it is going to fail?
On the other hand I dont understand one thing... I dislike garbage, therefore I stay as far away from it as I can...
Who likes to be a masochist?
LOL
Sorry SWG, but it is not so...
routine" vote ( ...to enable brokers to vote yes for shareholders who do not submit instructions).
and they were talking of this very exact time when the mice were re-injected with the cancer and they were discovered to be immune this 2nd time around.
About the Poisson Pill:
1. I suppose putting in place a PP is a decission that the Board can take at any time. Or is there a need for shareholder approval?
2. If that is not the case then there is still plenty of time for the Board to do it. The why the concern?

