


Tuesday, December 15, 2015 6:31:05 AM
1st LOOKIN PROJECTIONS (fine tuning)
(continues from #245612 )
I have tried to make some fine tuning to the previous models I made for the Lookins Projections.
For the MOS monthy distribution instead of using 2 months intervals… now 1 month intervals will be used. Also the eventing monthly distributions have been taken for a more reliable source such as the Herbst trial results. This trial seems to be the one that resembles Sunrise the most (MOS 9.9 for placebo) from the patient population point of view. This is the chart for the Overall Survival in that trial.
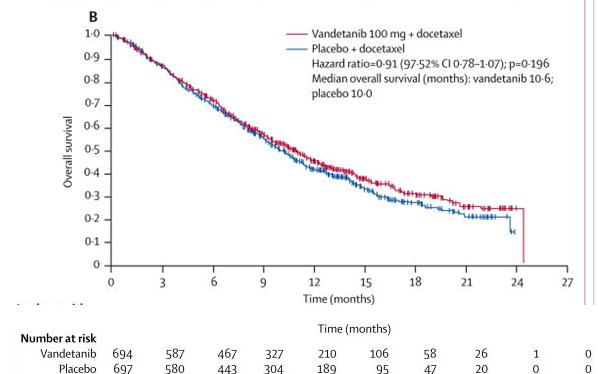
For the model, the monthly distribution for the Placebo Arm will be taken from this chart data (blue curve… 697, 580, 443, etc. data)… The curves (distribution curves) for the Bavi arm will follow that same shape but making sure that the MOS are respectively: 13, 15 and 17 months. The result is the following table.
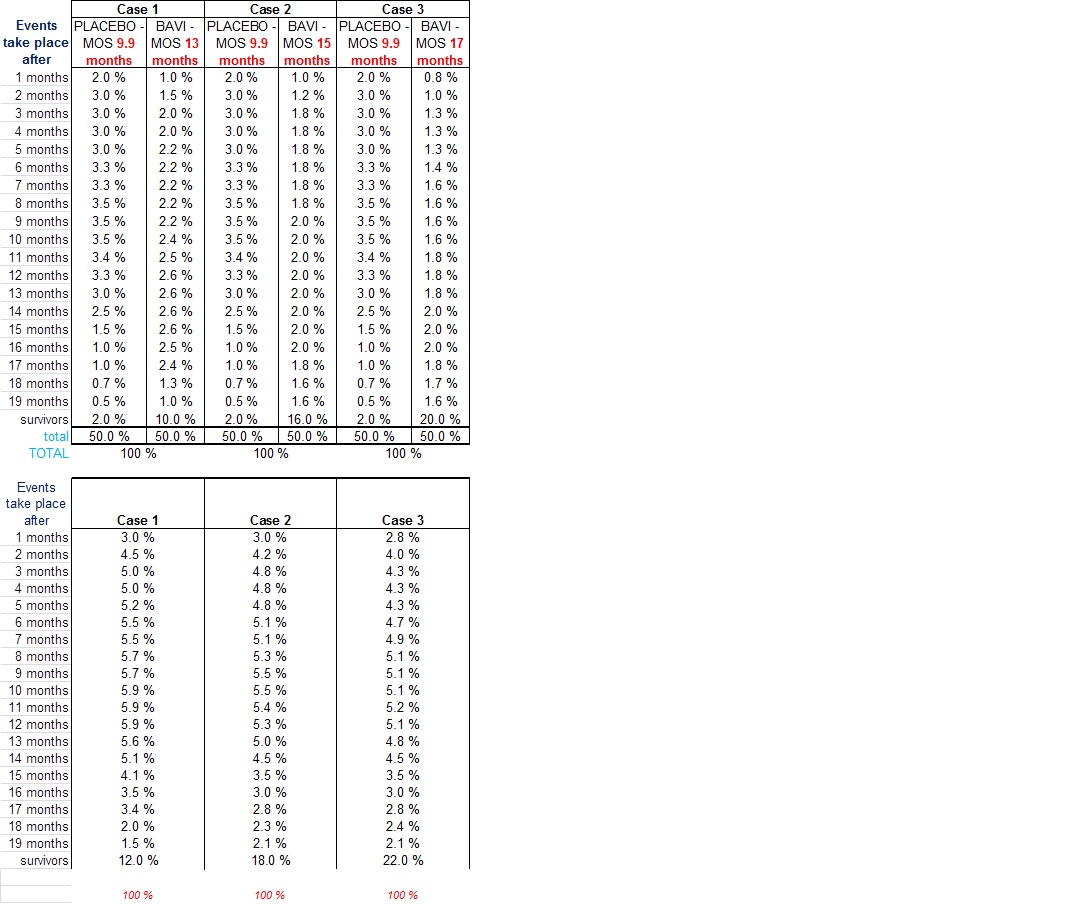
Now we apply these “eventing” percentages to the table below which shows for a particular month (columns): the Number of patients who have been enrolled a “X” number of months (raws).
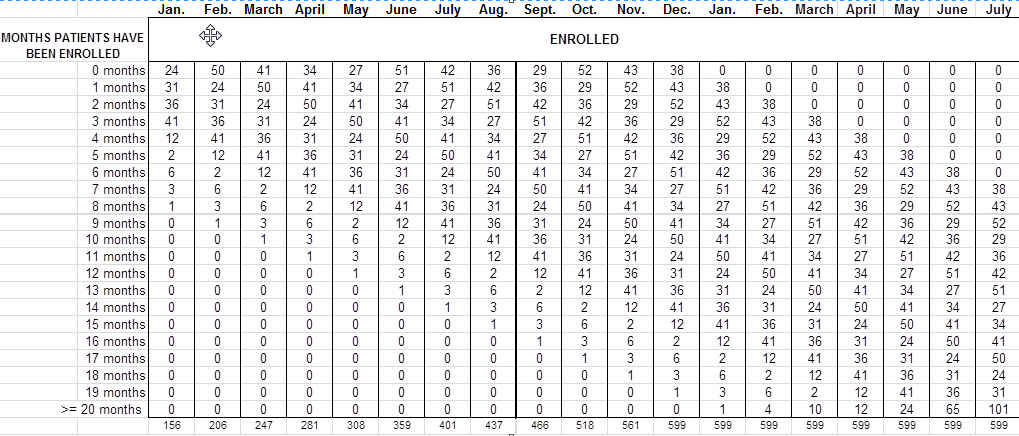
This way (according to the model) we will obtain the number of patients who have evented at a particular month
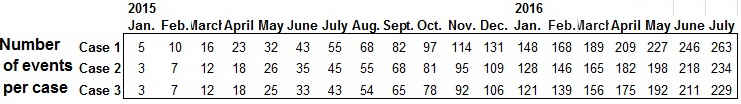
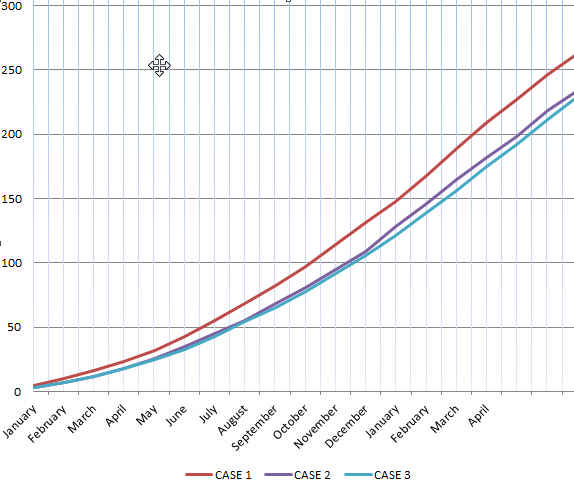
Given that in all cases the “eventing” distribution only shows up to 20 months, that means that specially for Cases 2 & 3… beyond 19 months all patients alive are considered as survivors when they might have evented at 21 months etc… So, curves for Cases 2 & 3 are a limit on the right side for the Lookins (should take place before that)


