 News
News  Market Data
  Discover
Support: 888-992-3836
Copyright © 2023 InvestorsHub Inc.


Register for free to join our community of investors and share your ideas. You will also get access to streaming quotes, interactive charts, trades, portfolio, live options flow and more tools.
$SPX - From 4600 Correction Now pushing on to the 5150 5250 Targets...
By: Sahara | February 22, 2024
• $SPX - From 4600 Correction.
I showed this last August having the Green Targets which were all hit after B/Tapping the B/Out Channel Line.
Now pushing on to the 5150 5250 Targets...

Read Full Story »»»
 DiscoverGold
Money managers Reduced their exposure to the US Equity markets since last week...
DiscoverGold
NAAIM Exposure Index
February 22, 2024 
The NAAIM Number
74.70
Last Quarter Average
67.81
»»» Read More…
The AAII Investor Sentiment
By: AAII | February 22, 2024
Bullish 44.3%
Neutral 29.5%
Bearish 26.2%
• Historical 1-Year High
Bullish: 52.9%
Neutral: 39.5%
Bearish: 50.3%
Read Full Story »»»
DiscoverGold
Tech flow has been absurd today. Look at all of these $SMCI, $AMZN & $META calls just from the past hour
By: Cheddar Flow | February 22, 2024
• Tech flow has been absurd today
Look at all of these $SMCI, $AMZN & $META calls just from the past hour

Read Full Story »»»
DiscoverGold
Breaking Down These S&P 500 'Overbought' Indicators
By: Schaeffer's Investment Research | February 22, 2024
• It's unlikely the SPX will drop 2% in a single day anytime soon
• The benchmark is well above its 200-day moving average
In the past week, I encountered a couple of intriguing facts, both related to the strong performance of the S&P 500 Index (SPX), which currently sits near all-time highs. The index is high above its 200-day moving average, and it's been roughly one year since it experienced a 2% decline in a single day. In this article, I will dive into these facts to explore their historical significance.
SHARP MOVES ABOVE THE 200-DAY TRENDLINE
The SPX has fallen significantly in the past after it got 13% above its 200-day moving average. And while it hasn’t yet quite reached 13%, it did get to 12% recently. The table below shows how the SPX has performed after moving 12% above the 200-day moving average for the first time in at least six months.
There have been no fewer than 27 instances since 1950, typically leading to initial losses. Over the next two weeks, the SPX averaged a loss of 0.5%, with 43% of the returns positive. By contrast, the SPX typically gained 0.35% over two-week periods, with 59% of the returns positive. However, extending the timeframe yielded better results.
Six months after these signals, the index gained on average about 7%, with 93% of the returns positive. This beats the typical return of 4.43%, with 70% of the returns positive. Notably, these signals were followed by lower than usual volatility, with average positive returns slightly below average (7.83% vs. 9.73%).
The average negative return exhibited a significant decrease in downside, with losses averaging 3.55% in the next six months, compared to the typical average negative return of -8%. On the bright side, this officially signaled two weeks ago, during which the S&P 500 lost 0.3%, so we’re past the worst performing timeframe. Hopefully, it’s smooth sailing going forward which has tended to be the case in the past.

NO 2% LOSSES IN SIGHT?
It’s also been one year since the SPX suffered a 2% daily loss, which seemed rare. The first table below shows there have been 15 prior instances when the SPX has gone one year (252 trading days) without a 2% drop.
Comparing the returns in that first table to typical index returns, nothing stands out, with both looking relatively similar. One thing I noticed is that when the index went one year without a 2% drop, on average, it has gone another 257 trading days before seeing it again. Based on this, we could go another year before the SPX drops 2% in a single day.

Read Full Story »»»
DiscoverGold
The 10 Top/Bottom NASDAQ 100 Index percent net change performers
By: Thom Hartle | February 22, 2024
• Today (8:34 CST), the 10 top/bottom percent net change performers in the NASDAQ 100 Index.

Read Full Story »»»
DiscoverGold
AI-generated Buy and Sell Daily Signals
By: Hedgeye | February 22, 2024
• This is free access to our brand-new AI-generated buy and sell signals.

Read Full Story »»»
DiscoverGold
The $SPY Casino Has Opened And a couple traders are feeling lucky today
By: Cheddar Flow | February 21, 2024
• The $SPY Casino Has Opened
And a couple traders are feeling lucky today

Read Full Story »»»
DiscoverGold
$SPX - Daily View Update
By: Sahara | February 21, 2024
• $SPX - Daily View Update.
Loitering at the 'Broadening' Plots Uppr-Band, and still within its Bear 'Wedge' (just).
I anticipate an Overthrow to tap the 'Swing' Target, but the current formation at that band has a 'Diamond' look to it...

Read Full Story »»»
DiscoverGold
$NDX - Daily View Update. Slipped the Red Bear 'Wedge'.
By: Sahara | February 21, 2024
• $NDX - Daily View Update.
Slipped the Red Bear 'Wedge'.
Yet note in the zoom thumbnail a 'Hammer' Candle at the Blue 20/DMA needs negating...

Read Full Story »»»
DiscoverGold
The 10 Top/Bottom S&P 500 Index percent net change performers
By: Thom Hartle | February 21, 2024
• Today (8:33 CST), the 10 top/bottom percent net change performers in the S&P 500 Index.

Read Full Story »»»
DiscoverGold
The 10 Top/Bottom NASDAQ 100 Index percent net change performers
By: Thom Hartle | February 21, 2024
• Today (8:33 CST), the 10 top/bottom percent net change performers in the NASDAQ 100 Index.

Read Full Story »»»
DiscoverGold
AI-generated Buy and Sell Daily Signals
By: Hedgeye | February 21, 2024
• This is free access to our brand-new AI-generated buy and sell signals.

Read Full Story »»»
DiscoverGold
Very Unusual SPY call order in the mix with a 520 strike and $1.8M in premium too
By: Cheddar Flow | February 20, 2024
• Bulls attempting to stop the drop again today
Very Unusual $SPY call order in the mix with a 520 strike and $1.8M in premium too

Read Full Story »»»
DiscoverGold
QQQ $9 Million Aggressive OTM Puts
By: Cheddar Flow | February 20, 2024
• $QQQ $9M Aggressive OTM Puts
These have a lot of premium, are above the ask, and highly unusual

Read Full Story »»»
DiscoverGold
Sentiment: The Market Greed/Fear Index is currently at 82.94, which indicates an extreme level of greed in the market. History shows that such excessive greed often foreshadows a market correction
By: Isabelnet | February 20, 2024
• Sentiment
The Market Greed/Fear Index is currently at 82.94, which indicates an extreme level of greed in the market. History shows that such excessive greed often foreshadows a market correction.

Read Full Story »»»
DiscoverGold
‘Risk-On’ Rally In S&P 500, Or Nasdaq 100, Without Willingness To Take On Leverage Probably Unsustainable
By: Hedgopia | February 20, 2024
January saw margin debt only inch up, even as the S&P 500 rallied 1.6 percent. This divergence, should it continue in the months ahead, could end up helping equity bears more than the bulls.

The S&P 500 opened 2024 with a 1.6-percent rally in January, raising optimism that the ‘as goes January, so goes the year’ maxim comes true this year (more on this here). Leverage did not play much of a role in January.
FINRA margin debt barely grew last month, up 0.2 percent – or $1.2 billion – to $702 billion. The large cap index bottomed last October at 4104, ending January at 4846 and adding another 3.3 percent February-to-date, closing last week at 5006.
From last October, margin debt is up $66.7 billion – and $95.3 billion from the December 2022 low of $606.7 billion. US stocks put in a major bottom in October 2022, with the S&P 500 bottoming at 3492. Earlier, margin debt peaked at $935.9 billion in October 2021. The index has already rallied to a fresh high, yet margin debt remains substantially below its prior high.
Equity bulls must hope the January divergence between margin debt and the S&P 500 does not persist in the months to come. The two do have a tight relationship (Chart 1).

The prevailing lack of willingness to take on leverage – or risk – is also evident in the way the Russell 2000 is behaving.
By nature, small-caps have a larger exposure to the domestic economy than their large-cap cousins. Investors thus tend to gravitate toward small-caps when they perceive the US economy has brighter days ahead.
The Russell 2000 peaked in November 2021 at 2459, subsequently bottoming at 1641 in June 2022, followed by a drop to 1642 in October that year. Those lows were once again tested last October when the small cap index tagged 1634. A two-month rally from that low peaked at 2072 on December 27th. Last week, the December high was kind of tested, with the index touching 2063 intraday Thursday and then retreating to end the week up 1.1 percent to 2033.
The index is struggling at – or just below – 2100, which is the measured-move price target following a December 13th range breakout at 1900. Since January 2022, the Russell 2000 had been going back and forth between that level and 1700.
As things stand, given investor apathy toward risk-on through ownership of small-caps, it is hard to imagine a sustained breakout at 1900.

Evidently, investors are hiding in large-caps.
Chart 3 tallies a quarter-over-quarter percentage change in the S&P 500 market cap versus a combined FINRA margin debt and S&P 500 buybacks.
In the December quarter, for instance, the S&P 500 market cap expanded by $4 trillion, even as margin debt grew by $19.9 billion; buybacks at $185.62 are assumed to have been unchanged from the September quarter, as December-quarter numbers are not out just yet.
For the last several quarters, buybacks plus margin debt have grown in the $200-billion range each quarter – give or take – but the S&P 500 market cap has progressively grown more and more.
This, if anything, smacks of an unsustainable pace. Equity bulls need to be willing to take on leverage if they want even higher prices.

The lack of willingness to take on leverage is not only limited to margin debt. Elsewhere, US banks’ commercial and industrial loans are showing the same pattern.
In January, these loans came in at a seasonally adjusted $2.77 trillion. Most recently, they peaked at $2.81 trillion in January last year, with an all-time high of $3.03 trillion having been recorded in May 2020.
Historically, using a 12-month rolling average, in both 2000 and 2008, margin debt led C&I loans by about a year. The relationship was messed up leading up to, during and even after the Covid-19, but seems to be once again reestablishing itself, with the red line in Chart 4 sideways to slightly down.
The only saving grace in this is that – at least going by how things evolved in 2000-2001 and 2008-2009 – by the time the 12-month rolling average of C&I loans peaked, the economy would have already been through most of the weakness prevailing then, which also suggests the green bars would soon begin to rise. Indeed, the bars on the right side of the chart do seem to be getting taller, which is what the equity bulls need. They need risk-on in the true sense of the word to come back. Right now, margin-debt behavior does not reflect risk-on.
Read Full Story »»»
DiscoverGold
AI-generated Buy and Sell Daily Signals
By: Hedgeye | February 20, 2024
• This is free access to our brand-new AI-generated buy and sell signals.

Read Full Story »»»
DiscoverGold
50 day SMA of RSI(14) on the daily for $SPX is knocking on the door of 70
By: Steve Deppe | February 9, 2024
• 50 day SMA of RSI(14) on the daily for $SPX is knocking on the door of 70.
This hasn't happened often the last decade plus and prices don't move linearly forever guys. #SPX

Read Full Story »»»
DiscoverGold
The equity market endures, regardless of who is in office
By: Raymond James Financial | February 16, 2024
Key Takeaways
• Perception versus reality remains a challenge for Biden
• Fed policymakers are not influenced by politics
• The equity market endures regardless of who is in office
Ready for the long holiday weekend? The origins of Presidents Day can be traced back to the early 1800s when the nation gathered to celebrate one of the most important figures in American history, George Washington. While Washington’s birthday is now commonly referred to as Presidents Day, there was never a proclamation to officially change the name of this federal holiday. Today, the nation celebrates all presidents, past and present - regardless of how revered they are/were by the nation. And speaking about revered presidents, over 70% of voters would prefer there not be a 2020 redux in 2024 - which is surprising as a rematch appears to be in the offing. While we are still in the early stages leading up to the 2024 election, here’s what we are keeping an eye on:
• Will the economy’s resilience last? | The state of the economy is among the top issues for voters heading to the polls. And contrary to what many perceive, this economy is one for the record books. Looking back through history, there has not been another period where GDP growth was above 3% for two consecutive quarters, the unemployment rate was below 4.0% and inflation, as measured on a six-month annualized basis, was running at the Federal Reserve (Fed)’s 2.0% target. The stock market is also up over 20% in the last year. Truly impressive! The problem for Biden: voters are not feeling it. In fact, a recent poll from RealClear Politics states that over 65% of the country believes the economy is on the ‘wrong’ track, with 50% of voters believing the economy is in a recession - or worse. Voter perception versus reality is a challenge Biden will need to overcome - especially if economic growth actually slows in the months ahead. History shows that if a recession unfolds in the two years leading up to the election, the incumbent does not get reelected and vice versa. The good news for the economy: it doesn’t matter which party wins the presidency; the economy, overall, has historically performed similarly regardless of the party in power.
• The fed during election years | This year is a pivotal year for the Fed as it contemplates when to cut interest rates (we’re still penciling in June). Which begs the question: will the Fed’s decisions be influenced by the political calendar? Absolutely not. However, this does not prevent politicians from using the Fed as a political pawn in the upcoming year. Fed rate cuts so close to an election that stimulate the economy will be applauded by Democrats as Republicans question the timing while, conversely, Democrats will fret over few or no rate cuts as Republicans highlight economic weakness. Fortunately, the Fed is an independent entity where policymakers routinely ignore politics when making their rate decisions. In fact, their historical record shows just that. The Fed has either hiked or cut rates 85% of the time in election years dating back to 1972. And more applicable to the scenario that is unfolding this year, the Fed has cut rates 62% of the time in election years. Therefore, it does not matter if it is an election year or not, the Fed’s reaction function is based on its dual mandate - inflation stability and full employment.
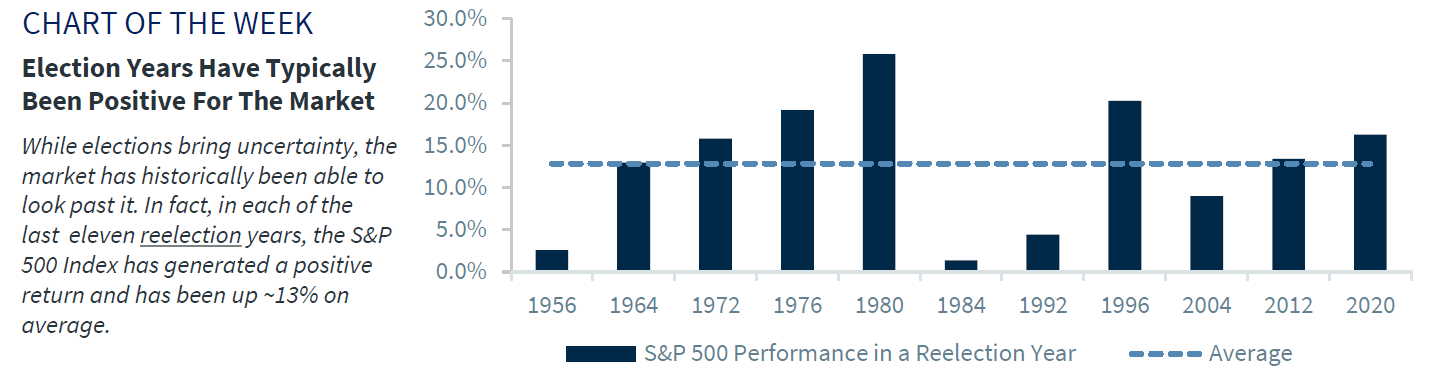
• Election year impact on the equity market | An election year - particularly a reelection year - has been positive for the equity market. In fact, the S&P 500 was up ~13%, on average, and was positive in each of the last 11 reelection years. But while the market, on average, has been positive, election years bring increased volatility. During election years, the market experiences a max drawdown of ~15% (vs. 13% in a normal year) and four 5% pullbacks (vs. three) on average dating back to 1980. This year, we are already seeing election-related impacts starting to play out in some pockets of the market. For example, while the S&P 500 is up ~5% year-to-date, EV/solar names (Trump may roll back portions of the IRA/CHIPs acts), Mexico (the USMCA is up for review in 2026) and China (Trump’s call for 60% tariffs on Chinese imports) are in negative territory. Similarly, there has been some underperformance of oil and gas companies after Biden announced a temporary pause on LNG projects. Going forward, pay close attention to S&P 500 performance in the three months leading up to the election, as the equity market has a track record of predicting who wins the election - correctly calling 20 of the last 24 elections. Historically, if the market’s performance is positive three months leading into the election, the incumbent party wins. On the contrary, if it is down, the incumbent loses.
• Bottom line | History suggests that investors should not re-position their portfolios simply based on the fact it is an election year. While election years bring uncertainty, in the long term, fundamentals, such as economic and earnings growth, monetary policy, interest rates and inflation, have a more meaningful impact on future returns than which party is in power in Washington. Examining the markets since 1937, the S&P 500 has experienced 21 negative years - 11 coming under a Republican president and 10 occurring under a Democrat president. Similarly, when looking at GDP growth, 7 negative years have occurred under both a Republican and Democrat president. The point is, the market and the economy have historically gone up regardless of which party is in power, so we would suggest not making knee-jerk decisions based off the winner of the election.
Read Full Story »»»
DiscoverGold
10 Most Overbought Stocks in the S&P 500 - $LLY $GE and $UBER making the list
By: Barchart | February 17, 2024
• 10 Most Overbought Stocks in the S&P 500 - $LLY $GE and $UBER making the list.

Read Full Story »»»
DiscoverGold
CoT: Peek Into Future Through Futures, How Hedge Funds Are Positioned
By: Hedgopia | February 17, 2024
• Following futures positions of non-commercials are as of February 13, 2024.
E-mini S&P 500: Currently net short 215.8k, down 17.2k.

Post-CPI, equity bears had an opportunity this week to wrest control of short-term momentum, but the bulls would not let them (more on this here). The week began with Monday’s shooting-star reversal in which the S&P 500 ticked 5048 and retreated. This was followed by Tuesday’s gap-down, dropping as low as 4920 – just above the 20-day at the time – and the weakness was bought. By Thursday, the gap was filled, with Friday tagging 5039 but reversing lower to end the week down 0.4 percent to 5006.
This was the first down week in six – and the second in 16. This is an opening for the bears. The large cap index has remained overbought for a while now, but a genuine unwinding of these conditions is yet to begin. Shorter-term averages are still rising, which the bulls will try to defend for sure. Their mettle will be genuinely tested when they will be defending breakout retest at 4810s. On January 19th, the S&P 500 pushed through the January 2022 high of 4819.
Nasdaq (mini): Currently net long 32.1k, down 812.

Like the S&P 500, the Nasdaq 100 this week printed a new all-time high but only to then reverse to end the week lower. The tech-heavy index tagged 18041 intraday Monday but finished the week down 1.5 percent to 17686. This was the first down week in six – and the second in 16.
Monday’s intraday reversal also came at the daily upper Bollinger band; the lower bound lies at 17185, with the 50-day just underneath at 17007. This is the risk tech bulls face for now.
Russell 2000 mini-index: Currently net short 24.5k, up 4.5k.

The Russell 2000 did indeed rally toward the December 27th high of 2072 but small-cap bulls were unable to cling on to it. On Thursday, the index touched 2063 intraday; by Friday’s close, it reached 2033, up 1.1 percent for the week.
Earlier on December 13th, the small cap index broke out of a 200-point range between 1900 and 1700, which had been in place since January last year. A measured-move target of the breakout would translate to 2100.
It is possible the Russell 2000 once again goes after 2060s-2070s in the sessions ahead – even 2100 in the best of circumstances – but rallying past the resistance will prove difficult. If anything, 4Q earnings are coming in weaker than expected (more on this here).
US Dollar Index: Currently net long 2k, up 463.

The US dollar index was merely up 0.2 percent this week, but this was enough for a seventh consecutive up week. It bottomed at 100.32 on December 28th.
Earlier, the index peaked on October 3rd at 107.05 and began to really come under pressure early November. Post-Fed pivot on December 13th, it sliced through horizontal support at 103-104. It has made a return trip to that level.
This week, the index closed at 104.18. Odds favor it weakens in the weeks ahead. The most recent weekly candles – a spinning top this week and a shooting star last week – suggest sellers are beginning to come out of the woodwork.
VIX: Currently net short 51k, up 2k.

The weekly RSI closed this week at 49.16. For a while now, momentum has struggled to rally past the median. Even if that happens, there is immense resistance at the low-60s.
That said, volatility bulls are looking at a decent opportunity to rally here.
Coming into this week, VIX has had a streak of higher lows since December 12th when it tagged 11.81 intraday. This week, in the wake of Tuesday’s CPI, the volatility index surged to 17.94 intraday but only to then leave behind a long upper wick to close the session at 15.85. By the end of the week, it closed at 14.24.
The weekly in particular looks ready to firm up, with a bullish MACD crossover this week.
Read Full Story »»»
DiscoverGold
A Very Accurate Sentiment Reading That Is Flashing A RED Light For Bulls
By: Tom Bowley | February 18, 2024
While many analysts follow sentiment signals that involve feelings about market direction, I prefer one that follows the MONEY. I want to know what retail traders are doing with their money with respect to options. Extreme readings provide eerily accurate reversals in trend, which are obviously very important to any trader. I like to call the 5-day SMA of the equity-only put-call ratio ($CPCE) my "speed boat" sentiment indicator as it's excellent at predicting SHORT-TERM reversals. I track the CPCE using the User-Defined Index (UDI) tool here at StockCharts.com. Over the past two years, there have been occasions (mostly during Q4 on Wednesdays) when hedge funds have bought a MASSIVE number of equity puts on many of the largest cap companies in the world, like Apple (AAPL), Microsoft (MSFT), Amazon.com (AMZN), Alphabet (GOOGL), NVIDIA (NVDA), Meta Platforms (META), Tesla (TSLA), etc. These equity puts need to be adjusted OUT of the ratio, because they do not reflect on the retail option trader. Here's my adjusted 5-day SMA of the CPCE over the past couple years:
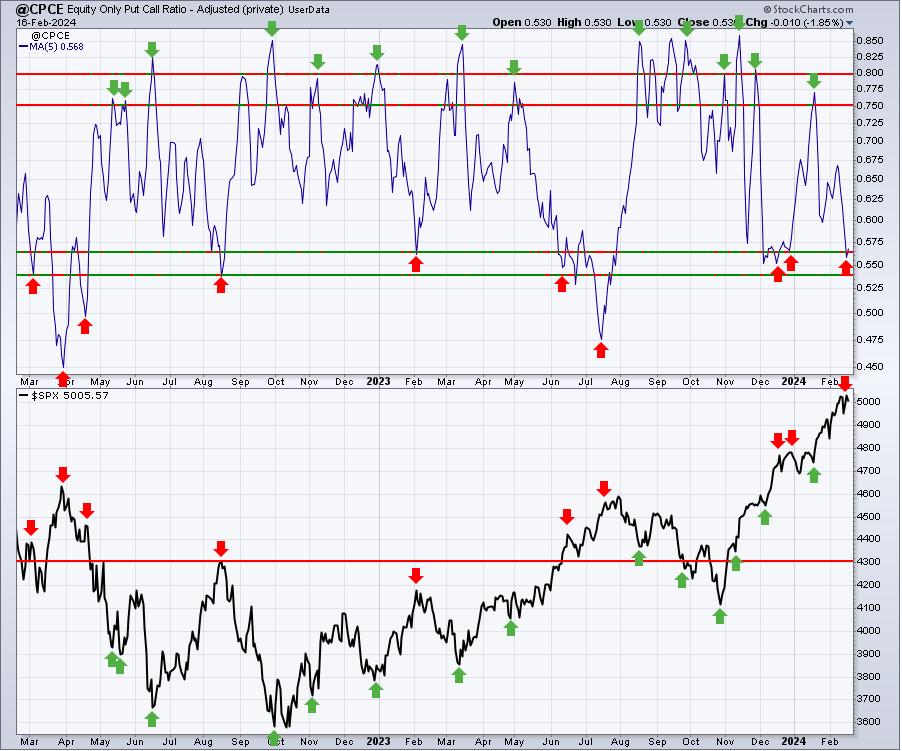
The CPCE measures the amount of bullishness (low CPCE readings) and bearishness (high CPCE readings) in the options world. Extended periods of bullishness and bearishness are marked in the chart with red arrows and green arrows, respectively, as the 5-day moving average of the CPCE moves toward one extreme or the other. Any time that we see the 5-day CPCE reach the .55-.57 range to the downside (or lower), we can look for a possible short-term market top. Note that subsequent market declines may be quite brief, and sometimes very mild. The takeaway here is to realize that low readings, like the one we have right now, provide us a warning that the RISK of a market decline has increased substantially. Managing risk is a top priority for successful traders.
Read Full Story »»»
DiscoverGold
S&P 500 Index (SPX) »» Weekly Summary Analysis
By: Marty Armstrong | February 17, 2024
S&P 500 Cash Index closed today at 500557 and is trading up about 4.94% for the year from last year's settlement of 476983. Caution is required for this market is starting to suggest it may now decline on the MONTHLY level. Up to this moment in time, this market has been rising for 3 months going into February reflecting that this has been only still, a bullish reactionary trend. As we stand right now, this market has made a new high exceeding the previous month's high reaching thus far 504839 while it is still trading above last month's high of 493109.
ECONOMIC CONFIDENCE MODEL CORRELATION
Here in S&P 500 Cash Index, we do find that this particular market has correlated with our Economic Confidence Model in the past. The Last turning point on the ECM cycle low to line up with this market was 2009 and 2002. The Last turning point on the ECM cycle high to line up with this market was 2022 and 2007 and 2000.
MARKET OVERVIEW
NEAR-TERM OUTLOOK
The S&P 500 Cash Index has continued to make new historical highs over the course of the rally from 1974 moving into 2024. Distinctly, we have elected two Bullish Reversals to date.
This market remains in a positive position on the weekly to yearly levels of our indicating models. Pay attention to the Monthly level for any serious change in long-term trend ahead.
Solely focusing on only the indicating ranges on the Daily level in the S&P 500 Cash Index, this market remains moderately bullish currently with underlying support beginning at 495777 and overhead resistance forming above at 501683. The market is trading closer to the resistance level at this time.
On the weekly level, the last important high was established the week of February 12th at 504839, which was up 16 weeks from the low made back during the week of October 23rd. So far, this week is trading within last week's range of 504839 to 492031. Nevertheless, the market is still trading upward more toward resistance than support. A closing beneath last week's low would be a technical signal for a correction to retest support.
When we look deeply into the underlying tone of this immediate market, we see it is currently still in a semi neutral posture despite declining from the previous high at 504839 made 0 week ago. This market has made a new historical high this past week reaching 504839. Here the market is trading positive gravitating more toward resistance than support. We have technical support lying at 494573 which we are still currently trading above for now.
Right now, the market is above momentum on our weekly models hinting this is still bullish for now as well as trend, long-term trend. Looking at this from a wider perspective, this market has been trading up for the past 6 weeks overall.
INTERMEDIATE-TERM OUTLOOK
YEARLY MOMENTUM MODEL INDICATOR
Our Momentum Models are rising at this time with the previous low made 2022 while the last high formed on 2023. However, this market has rallied in price with the last cyclical high formed on 2022 warning that this market remains strong at this time on a correlation perspective as it has moved higher with the Momentum Model.
Interestingly, the S&P 500 Cash Index has been in a bullish phase for the past 10 months since the low established back in March 2023.
Critical support still underlies this market at 423850 and a break of that level on a monthly closing basis would warn that a sustainable decline ahead becomes possible. Nevertheless, the market is trading above last month's high showing some strength.
DiscoverGold
Nasdaq Composite Index (COMP) »» Weekly Summary Analysis
By: Marty Armstrong | February 17, 2024
NASDAQ Composite Index Cash closed today at 1577565 and is trading up about 5.09% for the year from last year's settlement of 1501135. Caution is required for this market is starting to suggest it may now decline on the MONTHLY level. Factually, this market has been rising for 3 months going into February reflecting that this has been only still, a bullish reactionary trend. As we stand right now, this market has made a new high exceeding the previous month's high reaching thus far 1608007 while it is still trading above last month's high of 1563058.
ECONOMIC CONFIDENCE MODEL CORRELATION
Here in NASDAQ Composite Index Cash, we do find that this particular market has correlated with our Economic Confidence Model in the past. The Last turning point on the ECM cycle low to line up with this market was 2022 and 2009 and 2002. The Last turning point on the ECM cycle high to line up with this market was 2007 and 2000.
MARKET OVERVIEW
NEAR-TERM OUTLOOK
The historical perspective in the NASDAQ Composite Index Cash included a rally from 2009 moving into a major high for 2021, the market has been in a bearish trend since the high moving into the low in 2022 for a declining trend during that year. The last Yearly Reversal to be elected was a Bullish at the close of 2022.
This market remains in a positive position on the weekly to yearly levels of our indicating models. Pay attention to the Monthly level for any serious change in long-term trend ahead.
From a perspective using the indicating ranges on the Daily level in the NASDAQ Composite Index Cash, this market remains moderately bullish currently with underlying support beginning at 1565275 and overhead resistance forming above at 1591787. The market is trading closer to the support level at this time.
On the weekly level, the last important high was established the week of February 12th at 1608007, which was up 16 weeks from the low made back during the week of October 23rd. So far, this week is trading within last week's range of 1608007 to 1555144. Nevertheless, the market is still trading downward more toward support than resistance. A closing beneath last week's low would be a technical signal for a correction to retest support.
When we look deeply into the underlying tone of this immediate market, we see it is currently still in a semi neutral posture despite declining from the previous high at 1608007 made 0 week ago. The broader perspective, this current rally into the week of February 12th reaching 1608007 has exceeded the previous high of 1515007 made back during the week of December 25th.
Right now, the market is above momentum on our weekly models hinting this is still bullish for now as well as trend, long-term trend. Looking at this from a wider perspective, this market has been trading up for the past 6 weeks overall.
INTERMEDIATE-TERM OUTLOOK
YEARLY MOMENTUM MODEL INDICATOR
Our Momentum Models are rising at this time with the previous low made 2022 while the last high formed on 2023. However, this market has rallied in price with the last cyclical high formed on 2021 warning that this market remains strong at this time on a correlation perspective as it has moved higher with the Momentum Model.
Interestingly, the NASDAQ Composite Index Cash has been in a bullish phase for the past 10 months since the low established back in March 2023.
The market is trading some 0.92% percent above the last high 1563058 from which we did originally obtain one sell signal from that event established during January. Long-Term critical support still underlies this market at 1316160 and only a break of that level on a monthly closing basis would warn of a break of the current uptrend. At this time, the market is holding and is trading above last month's high as well.
DiscoverGold
BUY Signals Continue to Diminish
By: Carl Swenlin | February 16, 2024
A Golden Cross BUY Signal is generated when the 50-day EMA of a price index crosses up through its 200-day EMA. DecisionPoint's Golden Cross Index (GCI) shows the percentage of stocks in a price index that have a Golden Cross BUY Signal, and is an expression of long-term strength.
A Silver Cross BUY Signal is generated when the 20-day EMA of a price index crosses up through its 50-day EMA. DecisionPoint's Silver Cross Index (SCI) shows the percentage of stocks in a price index have a Silver Cross BUY Signal, and is an expression of intermediate-term strength.
Let's focus on the Silver Cross Index on the chart below. We can see that it has moved down from a high of about 90 percent in January to 72 percent, which creates a negative divergence against the rising price index (SPY). In order to lose a Silver Cross BUY, price must move below the 20-day EMA and 50-day EMA. Referring to the chart panels showing % Stocks > 20EMA and 50EMA, 62% of stocks are currently below both of those EMAs, meaning the SCI can drop another 10 percent. As the SCI continues to deteriorate, that will put downward pressure on the S&P 500.
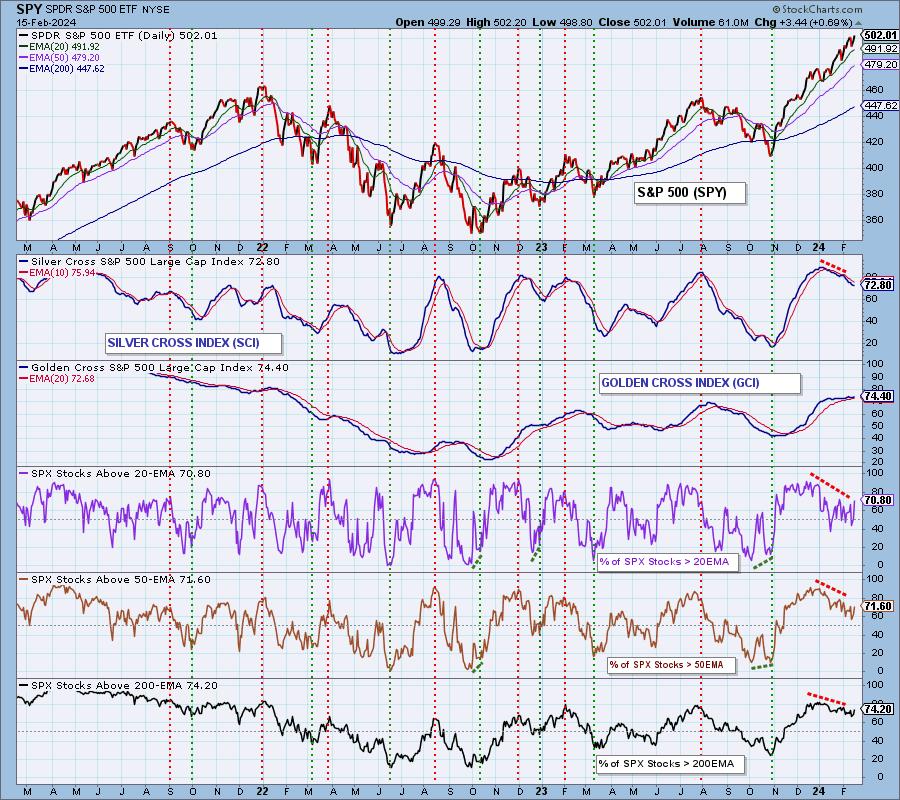
The long-term picture on the Golden Cross Index is not so pressing. The GCI is currently at 73%, and the % Stocks > 200EMA is at 69%, which is not a serious amount of potential deterioration.
Conclusion: The rally is being undermined by continued deterioration in the percentage of stocks with Silver Cross BUY Signals. The fact that prices continue to rise demonstrates the increasing influence of larger-cap stocks, so it is not guaranteed that prices will ultimately break downward. Nevertheless, it is not a healthy condition, and increased caution is needed.
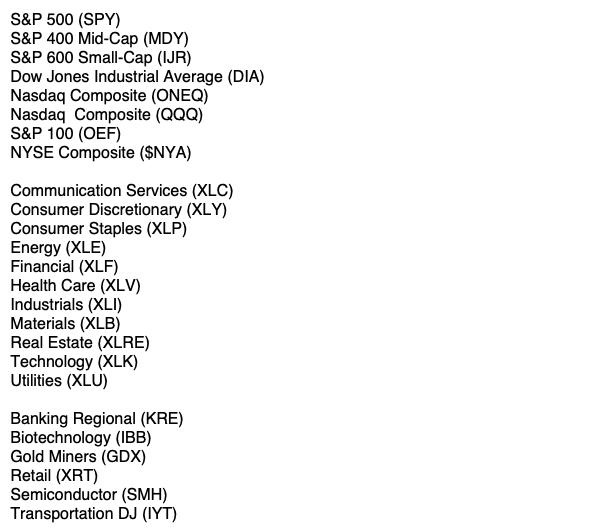
These are the market, sector, and industry group indexes for which we have individual Silver Cross and Golden Cross Indexes.
Read Full Story »»»
DiscoverGold
Taxes Will Bite the Stock Market
By: Tom McClellan | February 14, 2024
If you want to know what future federal tax collections are going to look like, just look at what the stock market has done over the past 12 months. I figure that the Congressional Budget Office does not know about this trick. This week's chart shows the SP500, shifted forward by a year. The lower line represents the 12-month trailing total of federal tax receipts. I use the 1-year time offset to help illustrate how tax collections lag whatever the stock market does a year earlier.
This relationship is meaningful because it says that federal tax collections should start rising rapidly, a rise which should last for at least the next 12 months, since the SP500 has just made new all-time highs. If the stock market turns down, then the Treasury Department can start looking forward to lower tax receipts. Total tax collections in raw dollar terms bottomed in October 2023, exactly 12 months after the stock market’s October 2022 bottom. Now that the SP500 has moved to a new all-time high, it is fair to expect that taxes are also going to rebound quickly, as the April tax filings come in, and as those readjusted quarterly estimated payments start happening at higher levels.
But there is a little bit of circular logic and feedback in this relationship, because the level of tax collections also affects how the stock market does. This is an topic that is going to come up for the stock market very soon.
When Americans file their income tax returns this coming April, most investors will have taxes due on their 2023 capital gains, and that is going to mean higher quarterly estimated payments throughout 2023. This is because the calculation of those quarterly estimated tax payments varies based on how much a taxpayer was under-withheld for the prior year. So a taxpayer who had capital losses during the bear market of 2022 might have had very low quarterly estimated payments to make during 2023. And now that taxpayer is likely going to be reporting a gain for 2023, which will drive up the quarterly estimated payments in 2024.
Paying more in taxes means that the extra money people have had is not going to be around any more to help lift the stock market, and instead Uncle Sam (and Janet Yellen) will have it.
That’s good for the nation’s accumulating debt, but not for the path of the stock market. This next chart shows that total federal tax collections still remain very low at just 16.1% of GDP, and that is stimulative. But when those additional taxes get collected starting in April, this is likely to go up and be less of a stimulative force.
We are currently seeing a very low rate of tax collections measured as a percentage of GDP. Getting taxes down to 16% of GDP has always been very stimulative. But getting taxes up to 18% of GDP has brought an economic recession every time that it has happened, including in 2022 which did see two consecutive quarters of falling GDP (for those who like that definition of a recession). If taxes go up a bunch like the SP500 says they will in the top chart, that can be okay for this ratio as long as GDP goes up by a corresponding amount. Taxes and GDP going up or down together keeps the ratio constant.
But if GDP slows, as Fed Chairman Jerome Powell says he believes it will, and if the tax collections go up as the SP500 says they will, then we have a condition where this ratio changes quickly to a very adverse one for stock prices.
You may notice that in the late 1990s, taxes got up well above 18%, and the SP500 kept on going higher. That is an important observation, and it shows that the effect of high tax collections on the stock market can take a while to be felt. But 1998 was unusual in that the NYSE's Advance-Decline Line peaked in April 1998, well ahead of the SP500 and other indices, as a majority of stocks started doing poorly under the higher tax load. The big-cap indices kept doing okay because what liquidity there was available to invest was getting channeled into the fashionable new Internet stocks. Eventually the high taxation did what it always does, and it brought down both the stock market and the economy during the recession of 2001-02.
If 2024 brings a combination of rapidly rising tax collections and a slowing economy, then this tax receipts to GDP ratio could quickly jump up close to that 18% threshold, making things much more difficult for the stock market.
Tom McClellan
Editor, The McClellan Market Report
Read Full Story »»»
DiscoverGold
$SPX bidders are here to save the day... Again
By: Cheddar Flow | February 16, 2024
• $SPX bidders are here to save the day... Again.

Read Full Story »»»
DiscoverGold
The 10 Top/Bottom S&P 500 Index percent net change performers
By: Thom Hartle | February 16, 2024
• Today (8:34 CST), the 10 top/bottom percent net change performers in the S&P 500 Index.

Read Full Story »»»
DiscoverGold
Valuations: While a high CAPE ratio can persist for extended periods without triggering a market correction, historical data suggests that such periods of elevated valuations are typically followed by lower stock market returns
By: Isabelnet | February 16, 2024
• Valuations
While a high CAPE ratio can persist for extended periods without triggering a market correction, historical data suggests that such periods of elevated valuations are typically followed by lower stock market returns.

Read Full Story »»»
DiscoverGold
DJIA Up 11 of Last 13 Days Before Presidents’ Day Weekend
By: Almanac Trader | February 16, 2024

Trading before Presidents’ Day Weekend used to be miserable. However, there has been an improvement over the last 13 years. The longer-term track record of the market’s performance ahead of Presidents’ Day weekend from 1990 through 2010, shows DJIA, S&P 500 and NASDAQ suffered numerous and sizable declines especially on Friday. However, more recently, since 2011, the Friday before Presidents’ Day has been improving (shaded in light grey in table below). DJIA on Friday has the best record over the last 13 years, up eleven times with an average gain of 0.43%. S&P 500 has been nearly as strong, up ten times, but with a slightly softer average gain of 0.32%. NASDAQ trails both in average performance and frequency of gains with eight advances in the last thirteen years.
Read Full Story »»»
DiscoverGold
Credit Spreads Contracting - A POSITIVE
By: Nautilus Research | February 16, 2024
• Credit Spreads Contracting.

Read Full Story »»»
DiscoverGold
AI-generated Buy and Sell Daily Signals
By: Hedgeye | February 16, 2024
• This is free access to our brand-new AI-generated buy and sell signals.

Read Full Story »»»
DiscoverGold
S&P 500: Active investment managers are notorious for buying equities at tops and selling them at bottoms, highlighting the difficulties they encounter in accurately timing the market and making lucrative investment choices
By: Isabelnet | February 15, 2024
• S&P 500
Active investment managers are notorious for buying equities at tops and selling them at bottoms, highlighting the difficulties they encounter in accurately timing the market and making lucrative investment choices.

Read Full Story »»»
DiscoverGold
$SPY Put Sell Sweepers Hitting the Tape *At the Bid*
By: Cheddar Flow | February 15, 2024
• $SPY Put Sell Sweepers Hitting the Tape
*At the Bid*

Read Full Story »»»
DiscoverGold
Money managers Increased their exposure to the US Equity markets since last week...
DiscoverGold
NAAIM Exposure Index
February 15, 2024
The NAAIM Number
95.58
Last Quarter Average
67.81
»»» Read More…
The 10 Top/Bottom NASDAQ 100 Index percent net change performers
By: Thom Hartle | February 15, 2024
• Today (8:35 CST), the 10 top/bottom percent net change performers in the NASDAQ 100 Index.

Read Full Story »»»
DiscoverGold
AI-generated Buy and Sell Daily Signals
By: Hedgeye | February 15, 2024
• This is free access to our brand-new AI-generated buy and sell signals.

Read Full Story »»»
DiscoverGold
$SPX Multi-condition breadth study if anyone is interested
By: Nautilus Research | February 14, 2024
• #breadth #SP500 $spx $spy - Multi-condition breadth study if anyone is interested.

Read Full Story »»»
DiscoverGold
The AAII Investor Sentiment
By: AAII | February 14, 2024
Bullish 42.2%
Neutral 31.1%
Bearish 26.8%
• Historical 1-Year High
Bullish: 52.9%
Neutral: 39.9%
Bearish: 50.3%
Read Full Story »»»
DiscoverGold
Can $SPY turn this week around? Seasonality aligns with the bulls. Over the last 20 years, this week has had the highest win rate in all of Q1 and Q2
By: TrendSpider | February 14, 2024
• Can $SPY turn this week around? Seasonality aligns with the bulls.
Over the last 20 years, this week has had the highest win rate in all of Q1 and Q2.
75% win rate with an average return of +0.85%

Read Full Story »»»
DiscoverGold
The 10 Top/Bottom S&P 500 Index percent net change performers
By: Thom Hartle | February 14, 2024
• Today (8:36 CST), the 10 top/bottom percent net change performers in the S&P 500 Index.

Read Full Story »»»
DiscoverGold
S&P 500 Index (SPX): Summary Analysis
By: Marty Armstrong | February 14, 2024
S&P 500 Cash Index opened below the previous low and closed beneath it as well warning of a bearish posture right now. It closed today at 495317 and is trading up about 3.84% for the year from last year's settlement of 476983. Caution is required for this market is starting to suggest it may now decline on the MONTHLY level.
Presently, this market has been declining for going into 2024 reflecting that this has been only still a bearish reactionary trend. As we stand right now, this market has made a new high exceeding the previous year's high reaching thus far 504839 while it is still trading above last year's high of 479330.
MARKET OVERVIEW
NEAR-TERM OUTLOOK
The S&P 500 Cash Index has continued to make new historical highs over the course of the rally from 1974 moving into 2024. Noticeably, we have elected two Bullish Reversals to date.
This market remains in a positive position on the weekly to yearly levels of our indicating models. Pay attention to the Monthly level for any serious change in long-term trend ahead.
The perspective using the indicating ranges on the Daily level in the S&P 500 Cash Index, this market remains moderately bullish currently with underlying support beginning at 490697 and overhead resistance forming above at 496905. The market is trading closer to the resistance level at this time.
On the weekly level, the last important high was established the week of February 5th at 503006, which was up 15 weeks from the low made back during the week of October 23rd. So far, this week is has moved to the upside exceeding last week's high of 503006 reaching 504839. A closing above last week's high would be a technical signal that the advance is still in motion just yet. This makes the current rally 1 weeks to date. .
When we look deeply into the underlying tone of this immediate market, we see it is currently still in a semi neutral posture despite declining from the previous high at 503006 made 0 week ago. This market has made a new historical high this past week reaching 503006. We have exceeded that high suggesting the market is still pushing upwards.
Right now, the market is above momentum on our weekly models hinting this is still bullish for now as well as trend, long-term trend. Looking at this from a wider perspective, this market has been trading up for the past 5 weeks overall.
INTERMEDIATE-TERM OUTLOOK
Interestingly, the S&P 500 Cash Index has been in a bullish phase for the past 10 months since the low established back in March 2023.
Critical support still underlies this market at 423850 and a break of that level on a monthly closing basis would warn that a sustainable decline ahead becomes possible. Nevertheless, the market is trading above last month's high showing some strength.
DiscoverGold
AI-generated Buy and Sell Daily Signals
By: Hedgeye | February 14, 2024
• This is free access to our brand-new AI-generated buy and sell signals.

Read Full Story »»»
DiscoverGold
Did the NASDAQ100 Put In a Major Top?
By: Dr. Arnout Ter Schure | February 13, 2024
• Yesterday, the index reached $18K, as forecasted in our last update. Although one last push higher to ~$19K cannot be excluded, the downside risk is at least 15% from current levels.
Completion of an Impulse
In our last update from two weeks ago, see here, we knew for the NASDAQ100 (NDX), based on the Elliott Wave Principle, that,
“…an impulse consists of five waves; so far, there have been only three waves since the January 5th low. Hence, we must expect another grey W-v to ideally $17738-890 once the current minor correction since last week’s high has run its course while staying above critical price levels. Note that the grey W-iv typically reaches the 100% Fib-extension level but can also bottom at 123.60% or 76.40%.”
Fast-forward, and the index bottomed out on “FED-day” right at the 76.40% level ($17128 vs. $17093) for grey W-iv and rallied up to yesterday to $18041 for grey W-v, only to fall out of bed today. See Figure 1 below. Moreover, the colored boxes and dotted arrows show the corresponding wave target zones and the general path forward based on the standard Fibonacci-based EWP impulse pattern forecasted on January 19, respectively.
Figure 1. NDX hourly chart with detailed EWP count and technical indicators

Today, the index broke below two of the four colored warning levels we presented to our premium members yesterday. I.e., the colored dotted lines (blue, grey, orange, and red) subsequently increase the warning levels for the Bulls, which can be used to prevent havoc on one’s portfolio. A drop below the red line from current price levels will strongly suggest that the rally from the January 5th low and even the October 26th low has ended.
We Can Only Outline The Markets’ Potentials, Not The Certainties
But by using the EWP, we always have price levels above or below, which lets us know if the market is still on the right path. Thus, our alternative scenario using the regular NASDAQ, as shown in Figure 2 below, remains the same as last.
Figure 2. Daily NAS chart with detailed EWP count and technical indicators

Namely, given that the rally from the October 2023 low was essentially straight up with very consecutive few down days, besides the five-day decline into the January 5 low, the correct interpretation of the price action from an EWP perspective is more complex. As such, yesterday may only be the green W-3 of the red W-v. As found in our last update,
“a pullback to around NDX17100+/-100 and NAS15250+/-100 for the green W-4, followed by another rally for the green W-5, should be anticipated.”
But, below the red warning level (the orange W-4 low on “Fed-day”) increases the odds the black W-4? is underway to ideally NDX15200+/-200, NAS13,800+/-200. That is where the 38.20% retrace of black W-3/c and the Volume-Price shelf resides. Lastly, please note that a break below the October 2023 low tells us the bull market is over.
Read Full Story »»»
DiscoverGold
$SPX Looks like they're back bidding
By: Cheddar Flow | February 13, 2024
• $SPX Looks like they're back bidding

Read Full Story »»»
DiscoverGold
February Weak Seasonality & Frothy Market Selloff Sets Up Next Bull Leg
By: Almanac Trader | February 13, 2024

The big round number of S&P 5000 is proving to be resistant. It will likely take a few attempts to break through. February’s notorious seasonal weakness is bound to relieve the market’s obviously overbought condition. Much like January’s selloff as the market came to grips with the reality that it’s not getting a rate cut anytime soon, selling on January’s hotter-than-expected CPI suggests we are due for some further weakness. This is not out of the ordinary for February even into March. February is the weak link of the Best Six Months so expect some pullback.
Contrary to popular belief our outlook for the year remains bullish. This usually mild (and healthy) retreat (around 4% on average by S&P 500) from mid-February to mid-March in election years with a sitting president running for reelection could be a good opportunity to establish new or add to existing positions. Election year seasonal patterns suggest respectable full-year gains.
Read Full Story »»»
DiscoverGold
S&P 500: The current reading of 97.04 indicates a very overbought US stock market, leading some investors to worry about a potential correction in the near future
By: Isabelnet | February 13, 2024
• S&P 500
The current reading of 97.04 indicates a very overbought US stock market, leading some investors to worry about a potential correction in the near future

Read Full Story »»»
DiscoverGold
The 10 Top/Bottom NASDAQ 100 Index percent net change performers
By: Thom Hartle | February 13, 2024
• Today (8:33 CST), the 10 top/bottom percent net change performers in the NASDAQ 100 Index.

Read Full Story »»»
DiscoverGold
AI-generated Buy and Sell Daily Signals
By: Hedgeye | February 13, 2024
• This is free access to our brand-new AI-generated buy and sell signals.

Read Full Story »»»
DiscoverGold
|
Followers
|
179
|
Posters
|
|
|
Posts (Today)
|
0
|
Posts (Total)
|
68146
|
|
Created
|
06/10/03
|
Type
|
Free
|
| Moderators DiscoverGold | |||
:::::::::::: Welcome to S&P 500 & Nasdaq Analysis and Trends :::::::::::::
• The purpose of this board is to help others with Short & Long term S&P 500 & Nasdaq analysis and direction.
• This is strickly an educational board helping traders to learn market direction, swing and bottom trading.
• I ask that everyone respect opinions on the board whether you agree with them or not. We are all here to make money and avoid the
minimum loss we can.
Rules of the Board
Most of this board's WATCHERS are "lurkers" who appreciate info available without the need to sift through tons of "empty" posts.
1. Respect everyone opinions on trades.
2. No Pumping of Stocks.
3. No OTCBB or PINK STOCKS
*********************************************************************************************************
To help us evaluate our performance, please "BoardMark" the board if you find it useful.
To do so, just click on "Add to Favorites" Button at Right just above the Posts Dates.
 Presently, the Board has 179 Boardmarks, Thank you!
*Information Posted on this Board is not Meant to Suggest any Specific Action, But to Point Out the Technical Signs That Can Help Our Readers Make Their Own Specific Decisions. Your Due Deligence is a Must.
EXCHANGE TRADED FUNDS~ETFs COMPONENTS~RSI and I/V charts#msg-5495097 COMPONENTSFOR ^NDX / QQQQ ~ I/V charts #msg-9787995
Gold~ Silver~ HUI~ XAU~ US$~ €uro~ Crude #msg-29347660 (thanks,bob)
Cookies/Bandwidth/Security/Privacy #msg-9353921 PIEs/Cookies/Macromedia/Flash #msg-9412363 PerformanceTips for WinXP #msg-9854670
| Volume | |
| Day Range: | |
| Bid Price | |
| Ask Price | |
| Last Trade Time: |


