 News
News  Market Data
  Discover
Support: 888-992-3836
Copyright © 2023 InvestorsHub Inc.


Register for free to join our community of investors and share your ideas. You will also get access to streaming quotes, interactive charts, trades, portfolio, live options flow and more tools.
$SPY $2.6 Million Very Unusual Call
By: Cheddar Flow | February 12, 2024
• $SPY $2.6M Very Unusual Call
This is OTM, has a near-term expiration, and is an opening order (Vol > OI)
This type of print is very aggressive and has a bullish emphasis
Typically, these prints have a tight stop, since they are betting on swift trend continuation

Read Full Story »»»
 DiscoverGold
What to Watch After S&P 500's Breakout
By: Schaeffer's Investment Research | February 12, 2024
• The S&P 500 (SPX) broke above the psychologically significant 5,000 level last week
• There's still momentum going forward
“…short interest hit a multi-year high in December, with evidence of covering activity in recent weeks that I anticipated would be supportive of the market. I would imagine short covering is still supporting the market, as the SPX easily sliced through a level of potential resistance at 4,940 last week. Bears are likely panicking, as there was not profit-taking at 4,940, which is 20% above the October 2023 closing low... The 5,000-millennium level is now in sight and poses a potential hesitation or pivot point. In April 2021, the SPX shot right through 4,000, rallied strongly to its January 2023 all-time high”
- Monday Morning Outlook, Feb. 5, 2024
We received end-of-January short interest figures late Friday night and expect to “slice and dice” the data today. However, judging by the price action from the past two weeks, I still believe that we are in a major short-covering rally.
Just like April 2021, when the S&P 500 Index (SPX--5,026.61) broke through the 4,000-millennium level without hesitation, the SPX sliced through 5,000 last week. In 2021, the SPX would go on to rally with minimal drawdown into its early-January 2022 peak, which was taken out roughly three weeks ago.
Per the chart immediately below, throughout 2021, stocks rallied as the shorts covered. Fast forward to the present, and short interest levels are significantly higher than 2021, which is a major positive for bulls if short covering is going to be supportive in the months ahead.

“The best course of action when momentum like this occurs is stay the course, as rallies will persist longer than most anticipate. That said, anything can happen in the short term, so be open to all possibilities.”
- Monday Morning Outlook, Feb. 5, 2024
At some point, yes, the momentum will slow, or the SPX pulls back. Based on the current slope of the SPX’s 30-day moving average, which marked the mid-January low, it will be at 4,880 at week’s end. In other words, a decline of nearly 3% would be painful for short-term traders with a long bias, but the SPX would still technically be in trending mode.
Given there is lots of “room” to this potential support, long-term investors should not panic if there is a pullback to 4,880, even if it occurs in a short period. But short-term traders should be open to the fact that the SPX is coming into the week more than 3% above a moving average that provided support less than a month ago. A revisit of this moving average is a technical risk within the bigger-picture momentum higher.

A reason I would not be surprised to see momentum continue higher is the contrarian implications of short-term option traders, a time frame of a week or less, on the SPDR S&P 500 ETF Trust (SPY--501.20). Since December, this group has and continues to emphasize puts, or downside bets on the SPY.
My tool for gauging the sentiment among traders with the time frame of a week or less is analyzing the five-day cumulative open interest changes on the most recently expired SPY options, or the Friday, 2/9 expiration SPY options.
Per the chart below, note the continued emphasis on put volume, or the red bars. I used strikes that were 10 points below the SPY low in this period and ten points above SPY high heading into Friday’s trading.
A potential red flag is when we see an emphasis on calls, which are the blue bars in the below graph.

That is not to say that sentiment is pessimistic or cautious among all option players. In the equity world, our quantitative analysts here at Schaeffer’s Investment Research created a new chart that looks at the percentage of SPX component stocks whose 10-day, buy (to open) put/call ratios are above 1.0. Ahead of the late-October bottom, the percentage was near 50%. Now it is 20%, with longer-term extremes reaching 10% but 20% also marking levels that preceded significant pullbacks. This is something to keep in the back of your mind if anticipated support levels break down. But as it stands now, such optimism is to be expected in the presence of all-time highs and therefore, for now, means less from a contrarian perspective.

Finally, in evaluating last week’s price action and the SPX’s push through 5,000, it did so in the face of headlines about commercial real estate being a potential global contagion, continued push-back from multiple Federal Reserve officials about an imminent rate cut and a second major brokerage house in as many weeks sounding alarms that risk is growing and a sell-off is near. Remember, many brokerages have been ringing alarm bells for investors from late-November through mid-December, when the SPX was 6-10 percent below current levels.
Eventually, Wall Street will be correct, but then again, timing is everything, especially for anyone that listened to these warnings and missed out on a rally like this that does not occur very often.
Bears are hoping that consumer price index (CPI) data tomorrow and/or retail sales numbers later in the week knock the bulls off course. If not, we can expect to see more short covering.
Read Full Story »»»
DiscoverGold
$NDX - Daily View Update...
By: Sahara | February 12, 2024
• $NDX - Daily View Update...

Read Full Story »»»
DiscoverGold
$SPX - Daily View Update...
By: Sahara | February 12, 2024
• $SPX - Daily View Update...

Read Full Story »»»
DiscoverGold
The 10 Top/Bottom S&P 500 Index percent net change performers
By: Thom Hartle | February 12, 2024
• Today (8:33 CST), the 10 top/bottom percent net change performers in the S&P 500 Index.

Read Full Story »»»
DiscoverGold
The 10 Top/Bottom NASDAQ 100 Index percent net change performers
By: Thom Hartle | February 12, 2024
• Today (8:33 CST), the 10 top/bottom percent net change performers in the NASDAQ 100 Index.

Read Full Story »»»
DiscoverGold
SPX Seasonal Composite Election Year
By: Nautilus Research | February 12, 2024
• SPX Seasonal Composite Election Year

Read Full Story »»»
DiscoverGold
AI-generated Buy and Sell Daily Signals
By: Hedgeye | February 12, 2024
• This is free access to our brand-new AI-generated buy and sell signals.

Read Full Story »»»
DiscoverGold
This week, one of the components in the Risk-Off Composite Model issued an alert. However, the composite remains below the threshold for a broad model warning.
By: Dean Christians | February 10, 2024
• This week, one of the components in the Risk-Off Composite Model issued an alert. However, the composite remains below the threshold for a broad model warning.

Read Full Story »»»
DiscoverGold
The Nasdaq high low logic index is at 2.2 which means the Nasdaq is in a danger zone
By: CyclesFan | February 10, 2024
• The Nasdaq high low logic index is at 2.2 which means the Nasdaq is in a danger zone. The last time it topped above 2 was at the bull market high in November 2021. However, the 2021 case was an exception. The pattern in the previous cases going back to 2014 was that the 1st top..

Read Full Story »»»
DiscoverGold
Most Overbought S&P 500 Stocks
By: Barchart | February 10, 2024
• Nvidia $NVDA and Walt Disney $DIS are among this week's most 10 most overbought S&P 500 stocks.

Read Full Story »»»
DiscoverGold
February Monthly Options Expiration: Bullish Weekly Tendency Fading
By: Almanac Trader | February 9, 2024

February’s monthly option expiration week has had a bullish lean over the past 30 years, but it has faded over the last four years. Weekly average gains fall in a range of 0.28% by S&P 500 to 0.44% by DJIA. Based upon the number of positive weeks, DJIA has the best track record. From 2006 through 2019, S&P 500 was up 12 of 14, but has been down the last four straight during February’s monthly expiration week. Monthly option expiration Friday and the week after have a bearish record with average losses over the last 30 years.


Read Full Story »»»
DiscoverGold
CoT: Peek Into Future Through Futures, How Hedge Funds Are Positioned
By: Hedgopia | February 10, 2024
• Following futures positions of non-commercials are as of February 6, 2024.
E-mini S&P 500: Currently net short 233k, up 7k.

We are seven trading sessions into February, and the S&P 500 is already up 3.7 percent for the month. This follows an up 1.6 percent in January. The January barometer, which posits that ‘as goes January, so goes the year,’ bodes well this year. The maxim does have a strong record, including last year (more on this here).
That said, it also does not hurt keeping in mind the fact that the large cap index has had a phenomenal time since bottoming late October last year. From that low, it is already up 22.6 percent. It has now rallied in 14 of the last 15 weeks, with the last five in a row.
One after another metric is crying ‘overbought’. In fairness, it has been this way for a while now. Just because things are overbought does not mean a reversal has to occur right away. The weekly RSI, for instance, ended this week at 74.74; the last time this indicator was at least as extended was in December 2019-January 2020. Back then, the index peaked February 19th at 3394 and proceeded to tumble 35 percent in the next five weeks. The Covid-19 was the catalyst for the selloff back then. Yes, equities are grossly extended, but unless a catalyst for a selloff emerges, it is the bulls’ ball to lose.
Nasdaq (mini): Currently net long 32.9k, down 6.4k.

What looked like a potentially bearish hanging man last week failed to confirm. This week, the Nasdaq 100 had another strong week, up 1.8 percent to 17962, which is more than 1200 points from the prior record high of 16765 from November 2021. The prior high was surpassed on December 19th.
This week’s was a 14th up week in the last 15. Things are hot and heavy, with the weekly RSI at 74.63, which is already a level that is hard to maintain. Tech bears’ problem is that momentum has refused to break down.
Russell 2000 mini-index: Currently net short 20k, up 9.5k.

The Russell 2000 (2001) rallied 2.4 percent this week to close right at 2000, which has created problems for small-cap bulls going back to August 2022.
Earlier on December 13th, the small cap index broke out of a 200-point range between 1900 and 1700, which had been in place since January last year. A measured-move target of the breakout would amount to 2100, which was just about hit two weeks later when on December 27th it reached 2072. Near term, small-cap bulls have a shot at that high.
US Dollar Index: Currently net long 1.5k, up 1.2k.

The US dollar index, up six weeks in a row after bottoming at 100.32 on December 28th, ended up 0.2 percent to 103.99, but the bulls failed to save Monday’s intraday high of 104.47. It remains above both the 200- and 50-day (respectively 103.40 and 102.80).
Earlier, the index peaked on October 3rd at 107.05 and began to really come under pressure early November. Post-Fed pivot on December 13th, it sliced through horizontal support at 103-104. It has now made a return trip to that level.
Going back all the way to 1999, 103-104 has proven to be crucial for both bulls and bears. Upward momentum will pick up steam once 103-104 gives way.
VIX: Currently net short 49k, down 5.6k.

VIX gave back 0.92 points to 12.93 but maintained a streak of higher lows since December 12th when it tagged 11.81 intraday. This week’s low of 12.69 was recorded on Friday.
That said, the weekly RSI turned lower from just under the median. Near term, this can further help the volatility bears.
Read Full Story »»»
DiscoverGold
The S&P 500's $SPY performance each year since 1994
By: Evan | February 10, 2024
• The S&P 500's $SPY performance each year since 1994
1994: +0.4%
1995: +38.1%
1996: +22.5%
1997: +33.5%
1998: +28.7%
1999: +20.4%
2000: -9.7%
2001: -11.8%
2002: -21.6%
2003: +28.2%
2004: +10.7%
2005: +4.8%
2006: +15.9%
2007: +5.1%
2008: -36.8%
2009: +26.4%
2010: +15.1%
2011: +1.9%
2012: +16%
2013: +32.3%
2014: +13.5%
2015: +1.3%
2016: +12%
2017: +21.7%
2018: -4.6%
2019: +31.2%
2020: +18.4%
2021: +28.8%
2022: -18.2%
2023: +24.2%
2024*: +5.5% (The way too early year to date performance)
Read Full Story »»»
DiscoverGold
S&P 500 Index (SPX) »» Weekly Summary Analysis
By: Marty Armstrong | February 10, 2024
S&P 500 Cash Index opened above the previous high and closed above it as well warning of a bullish posture right now. This market is above all our indicators at this time reflecting it is moving higher over recent activity. It closed today at 502661 and is trading up about 5.38% for the year from last year's settlement of 476983. Caution is required for this market is starting to suggest it may now decline on the MONTHLY level.
Immediately, this market has been rising for 3 months going into February reflecting that this has been only still, a bullish reactionary trend. As we stand right now, this market has made a new high exceeding the previous month's high reaching thus far 503006 while it is still trading above last month's high of 493109.
ECONOMIC CONFIDENCE MODEL CORRELATION
Here in S&P 500 Cash Index, we do find that this particular market has correlated with our Economic Confidence Model in the past. Our next ECM target remains Tue. May 7, 2024. The Last turning point on the ECM cycle low to line up with this market was 2009 and 2002. The Last turning point on the ECM cycle high to line up with this market was 2022 and 2007 and 2000.
MARKET OVERVIEW
NEAR-TERM OUTLOOK
The S&P 500 Cash Index has continued to make new historical highs over the course of the rally from 1974 moving into 2024. We have elected two Bullish Reversals to date.
This market remains in a positive position on the weekly to yearly levels of our indicating models. Pay attention to the Monthly level for any serious change in long-term trend ahead.
Solely focusing on only the indicating ranges on the Daily level in the S&P 500 Cash Index, this market remains in a bullish position at this time with the underlying support beginning at 495719.
On the weekly level, the last important high was established the week of February 5th at 503006, which was up 15 weeks from the low made back during the week of October 23rd. So far, this week is trading within last week's range of 503006 to 491809. Nevertheless, the market is still trading upward more toward resistance than support. A closing beneath last week's low would be a technical signal for a correction to retest support.
When we look deeply into the underlying tone of this immediate market, we see it is currently still in a semi neutral posture despite declining from the previous high at 503006 made 0 week ago. This market has made a new historical high this past week reaching 503006. Here the market is trading positive gravitating more toward resistance than support. We have technical support lying at 498584 which we are still currently trading above for now.
Right now, the market is above momentum on our weekly models hinting this is still bullish for now as well as trend, long-term trend. Looking at this from a wider perspective, this market has been trading up for the past 5 weeks overall.
INTERMEDIATE-TERM OUTLOOK
YEARLY MOMENTUM MODEL INDICATOR
Our Momentum Models are rising at this time with the previous low made 2022 while the last high formed on 2023. However, this market has rallied in price with the last cyclical high formed on 2022 warning that this market remains strong at this time on a correlation perspective as it has moved higher with the Momentum Model.
Interestingly, the S&P 500 Cash Index has been in a bullish phase for the past 10 months since the low established back in March 2023.
Critical support still underlies this market at 423850 and a break of that level on a monthly closing basis would warn that a sustainable decline ahead becomes possible. Nevertheless, the market is trading above last month's high showing some strength.
DiscoverGold
Nasdaq Composite Index (COMP) »» Weekly Summary Analysis
By: Marty Armstrong | February 10, 2024
NASDAQ Composite Index Cash opened above the previous high and closed above it as well warning of a bullish posture right now. This market is above all our indicators at this time reflecting it is moving higher over recent activity. It closed today at 1599066 and is trading up about 6.52% for the year from last year's settlement of 1501135. Caution is required for this market is starting to suggest it may now decline on the MONTHLY level.
Factually, this market has been rising for 3 months going into February reflecting that this has been only still, a bullish reactionary trend. As we stand right now, this market has made a new high exceeding the previous month's high reaching thus far 1600729 while it is still trading above last month's high of 1563058.
ECONOMIC CONFIDENCE MODEL CORRELATION
Here in NASDAQ Composite Index Cash, we do find that this particular market has correlated with our Economic Confidence Model in the past. Our next ECM target remains Tue. May 7, 2024. The Last turning point on the ECM cycle low to line up with this market was 2022 and 2009 and 2002. The Last turning point on the ECM cycle high to line up with this market was 2007 and 2000.
MARKET OVERVIEW
NEAR-TERM OUTLOOK
The historical perspective in the NASDAQ Composite Index Cash included a rally from 2009 moving into a major high for 2021, the market has been in a bearish trend since the high moving into the low in 2022 for a declining trend during that year. The last Yearly Reversal to be elected was a Bullish at the close of 2022.
This market remains in a positive position on the weekly to yearly levels of our indicating models. Pay attention to the Monthly level for any serious change in long-term trend ahead.
From a perspective using the indicating ranges on the Daily level in the NASDAQ Composite Index Cash, this market remains in a bullish position at this time with the underlying support beginning at 1563788.
On the weekly level, the last important high was established the week of February 5th at 1600729, which was up 15 weeks from the low made back during the week of October 23rd. So far, this week is trading within last week's range of 1600729 to 1547168. Nevertheless, the market is still trading upward more toward resistance than support. A closing beneath last week's low would be a technical signal for a correction to retest support.
When we look deeply into the underlying tone of this immediate market, we see it is currently still in a semi neutral posture despite declining from the previous high at 1600729 made 0 week ago. The broader perspective, this current rally into the week of February 5th reaching 1600729 has exceeded the previous high of 1515007 made back during the week of December 25th.
Right now, the market is above momentum on our weekly models hinting this is still bullish for now as well as trend, long-term trend. Looking at this from a wider perspective, this market has been trading up for the past 5 weeks overall.
INTERMEDIATE-TERM OUTLOOK
YEARLY MOMENTUM MODEL INDICATOR
Our Momentum Models are rising at this time with the previous low made 2022 while the last high formed on 2023. However, this market has rallied in price with the last cyclical high formed on 2021 warning that this market remains strong at this time on a correlation perspective as it has moved higher with the Momentum Model.
Interestingly, the NASDAQ Composite Index Cash has been in a bullish phase for the past 10 months since the low established back in March 2023.
The market is trading some 2.30% percent above the last high 1563058 from which we did originally obtain one sell signal from that event established during January. Long-Term critical support still underlies this market at 1316160 and only a break of that level on a monthly closing basis would warn of a break of the current uptrend. At this time, the market is holding and is trading above last month's high as well.
DiscoverGold
Sentiment Lopsided - Is It a Problem?
By: Erin Swenlin | February 9, 2024
Periodically, we like to review sentiment charts, and today we have two for you. One is the poll results from the American Association of Individual Investors (AAII) and the other is the National Association of Active Investment Managers (NAAIM) Exposure level.
In both cases, we are starting to see sentiment lopsided to the bullish side. Not a surprise; given the rally out of the October lows, investors should be bullish. However, bullish sentiment becomes a problem if it hits extremes. Sentiment is contrarian. When investors get overly bullish and hop on the wagon, the wheels will eventually fall off from the weight. The reverse is also true with extreme bearish sentiment typically leading to higher prices. This is apparent when you look at key tops and bottoms in the market.
The Bull/Bear Ratio is where to focus on the AAII chart. The ratio is definitely showing strain to the upside, but it could get more overbought.
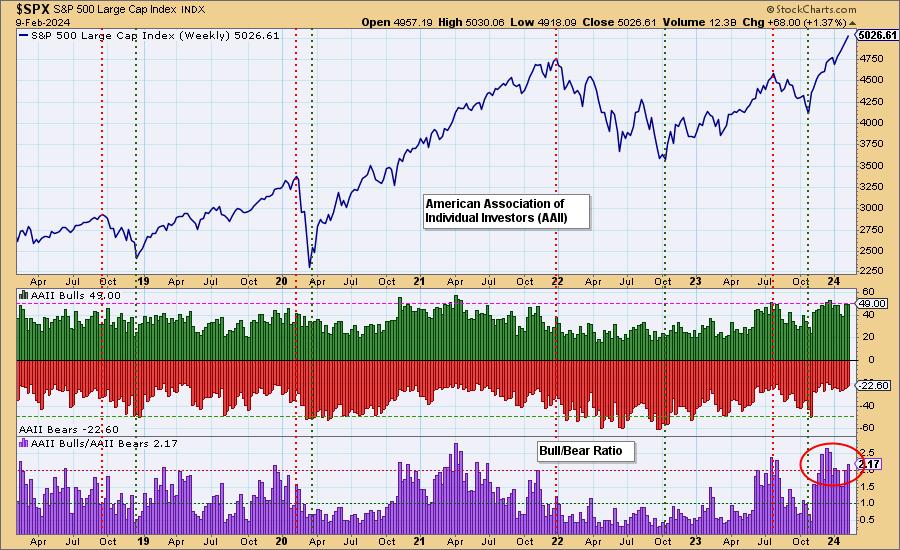
The NAAIM Exposure Index shows high readings of exposure. We would point out that during a strong bull market move, as we saw in 2020-2021, those readings can get very overbought and not lead to downside. We just note that last time readings got to this level, it was a problem.
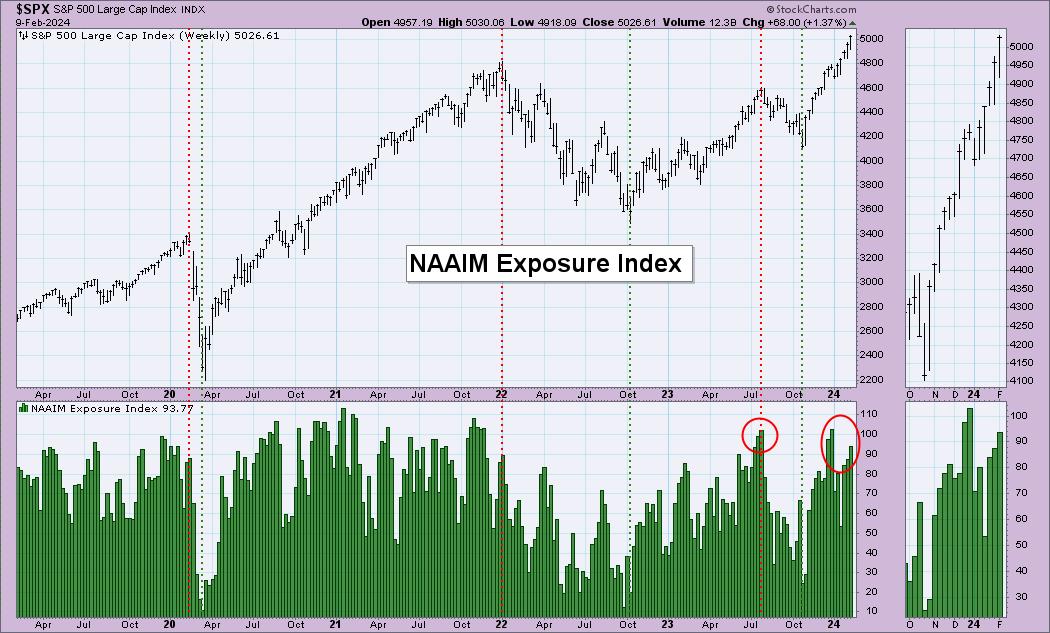
Conclusion: Readings on sentiment indicators are lopsided to the bullish side. However, we do note that these readings can persist in a strong bull market move. That is likely the case right now, but we should be aware that current conditions are reading overbought for sentiment indicators. It will be worth watching further.
Read Full Story »»»
DiscoverGold
The AAII Investor Sentiment
By: AAII | February 8, 2024
Bullish 49.0%
Neutral 28.4%
Bearish 22.6%
• Historical 1-Year High
Bullish: 52.9%
Neutral: 39.9%
Bearish: 50.3%
Read Full Story »»»
DiscoverGold
Money managers Increased their exposure to the US Equity markets since last week...
DiscoverGold
NAAIM Exposure Index
February 8, 2024 
The NAAIM Number
93.77
Last Quarter Average
67.81
»»» Read More…
$SPY $564K far OTM call print
By: Cheddar Flow | February 9, 2024
• $SPY $564K far OTM call print
This trader just made a very aggressive bet that SPY will continue to rip to the upside
Vol > OI so this was bought to open too
The strike is the most interesting part of the order, because it is very far OTM with a near-term expiration (Aggressively bullish)

Read Full Story »»»
DiscoverGold
If the S&P 500 closes above 4958.61 on Friday, it's going to match the best 15-week stretches in history.
By: Jason Goepfert | February 9, 2024
• If the S&P 500 closes above 4958.61 on Friday, it's going to match the best 15-week stretches in history.


Read Full Story »»»
DiscoverGold
The 10 Top/Bottom S&P 500 Index percent net change performers
By: Thom Hartle | February 9, 2024
• Today (8:33 CST), the 10 top/bottom percent net change performers in the S&P 500 Index.

Read Full Story »»»
DiscoverGold
The 10 Top/Bottom NASDAQ 100 Index percent net change performers
By: Thom Hartle | February 9, 2024
• Today (8:33 CST), the 10 top/bottom percent net change performers in the NASDAQ 100 Index.

Read Full Story »»»
DiscoverGold
SPX Signal From May (2023) Doing Okay
By: Nautilus Research | February 9, 2024
• $SPY #SPX Signal From May (2023) Doing Okay.

Read Full Story »»»
DiscoverGold
AI-generated Buy and Sell Daily Signals
By: Hedgeye | February 9, 2024
• This is free access to our brand-new AI-generated buy and sell signals.

Read Full Story »»»
DiscoverGold
$SPX & $NVDA They are bidding again
By: Cheddar Flow | February 7, 2024
• $SPX & $NVDA THEY ARE BIDDING AGAIN
Every. Single. Day.

Read Full Story »»»
DiscoverGold
The 10 Top/Bottom S&P 500 Index percent net change performers
By: Thom Hartle | February 7, 2024
• Today (8:34 CST), the 10 top/bottom percent net change performers in the S&P 500 Index.

Read Full Story »»»
DiscoverGold
The 10 Top/Bottom NASDAQ 100 Index percent net change performers
By: Thom Hartle | February 7, 2024
• Today (8:34 CST), the 10 top/bottom percent net change performers in the NASDAQ 100 Index.

Read Full Story »»»
DiscoverGold
Nasdaq Composite Index (COMP): Summary Analysis
By: Marty Armstrong | February 7, 2024
NASDAQ Composite Index Cash closed today at 1560900 and is trading up about 3.98% for the year from last year's settlement of 1501135. Caution is required for this market is starting to suggest it may now decline on the MONTHLY level. As of now, this market has been rising for going into 2024 reflecting that this has been only still a bullish reactionary trend. As we stand right now, this market has made a new high exceeding the previous year's high reaching thus far 1566421 while it is still trading above last year's high of 1515007.
MARKET OVERVIEW
NEAR-TERM OUTLOOK
The historical perspective in the NASDAQ Composite Index Cash included a rally from 2009 moving into a major high for 2021, the market has been in a bearish trend since the high moving into the low in 2022 for a declining trend during that year. The last Yearly Reversal to be elected was a Bullish at the close of 2022.
This market remains in a positive position on the weekly to yearly levels of our indicating models. Pay attention to the Monthly level for any serious change in long-term trend ahead.
Looking at the indicating ranges on the Daily level in the NASDAQ Composite Index Cash, this market remains moderately bullish currently with underlying support beginning at 1559725.
On the weekly level, the last important high was established the week of January 29th at 1566421, which was up 14 weeks from the low made back during the week of October 23rd. So far, this week is trading within last week's range of 1566421 to 1515849. Nevertheless, the market is still trading upward more toward resistance than support. A closing beneath last week's low would be a technical signal for a correction to retest support.
When we look deeply into the underlying tone of this immediate market, we see it is currently still in a semi neutral posture despite declining from the previous high at 1566421 made 0 week ago. The broader perspective, this current rally into the week of January 29th reaching 1566421 has exceeded the previous high of 1515007 made back during the week of December 25th.
Right now, the market is above momentum on our weekly models hinting this is still bullish for now as well as trend, long-term trend. Looking at this from a wider perspective, this market has been trading up for the past 4 weeks overall.
INTERMEDIATE-TERM OUTLOOK
Interestingly, the NASDAQ Composite Index Cash has been in a bullish phase for the past 10 months since the low established back in March 2023.
This market is trading within less than a half percent below that previous key high of January which was 1563058. Critical support still underlies this market at 1316160 and a break of that level on a monthly closing basis would warn of a further decline ahead becomes possible. Nevertheless, at this time, the market is still holding and is trading above last month's high.
DiscoverGold
AI-generated Buy and Sell Daily Signals
By: Hedgeye | February 7, 2024
• This is free access to our brand-new AI-generated buy and sell signals.

Read Full Story »»»
DiscoverGold
Nasdaq 100 Price Forecast – Nasdaq 100 Continues to Look For Momentum to Upside
By: Christopher Lewis | February 6, 2024
• The NASDAQ 100 has been bullish for some time but at this juncture I think we have to look at this through the prism of buying on the dips.
NASDAQ 100 Technical Analysis
It looks like the NASDAQ 100 is pretty stagnant in early hours on Tuesday, which makes a certain amount of sense considering we are at the very top of a major move. The market recently has stalled out for the last couple of days, but with a lack of economic announcements, certainly makes quite a bit of sense that we’re just hanging out.
We are essentially trying to work off some of the excess froth and that does make sense considering just how strong the move had been previously underneath. We should see plenty of support near the 17,000 level, which is basically the bottom of that massive candlestick from last week underneath there. We then have the 50 day EMA that comes into the picture offering support, so keep that in mind as well.
But nonetheless, I think we’re probably more likely to go looking towards the 18,000 level above, which of course is a big round figure and it will attract a certain amount of attention regardless. So ultimately, I think the way you have to look at the NASDAQ 100 is to simply buy on the dips looking for signs of value every time they appear. With that, I am bullish, but I also recognize this is a market that you probably have to be somewhat patient with because it doesn’t have any real reason to go crazy at the moment. Ultimately, we have a situation where I believe we will eventually, perhaps get a little bit of momentum, but right now it’s just in a period of consolidation and just simply hanging around trying to find the next reason to go higher.
Keep in mind that there are only about seven stocks that move the entire thing. So again, it is like playing an ETF and you must always remember that. The market isn’t equally weighted, so you must be able to recognize that the market will behave as such.
Read Full Story »»»
DiscoverGold
AI-generated Buy and Sell Daily Signals
By: Hedgeye | February 6, 2024
• This is free access to our brand-new AI-generated buy and sell signals.

Read Full Story »»»
DiscoverGold
Double Indications of Momentum - in One Signal
By: Nautilus Research | February 5, 2024
• Friday's closing bell rang with the emergence of a relatively rare technical momentum signal. The SPX posted a +38.50% upswing from its October 2022 low and a +20% rebound from the October 2023 low. When the larger swing occurs within less than 3 months of the smaller swing, which one might characterize as a resurgence of momentum following a brief pause, historical data indicates continued strength.
In our analysis spanning back to 1904, inclusive of Dow data prior to 1927, we have unearthed 12 analogous instances of this phenomenon. Over the subsequent 3-6 months following these signals, the S&P 500 (SPX) displayed gains in 11 out of 12 cases. Peering ahead to a one-year horizon, the SPX registered positive returns in 10 out of 12 occurrences, boasting an average gain of +23.11%. It is noteworthy that the only significant cautionary event transpired in 1930.
For a more comprehensive examination, please consult the accompanying chart and table below.

Read Full Story »»»
DiscoverGold
January Barometer Bodes Well For S&P 500, Which Remains Extremely Overbought
By: Hedgopia | February 5, 2024
January ended up 1.6 percent. Historically, an up January bodes well for the rest of the year. This may very well be the case this year, but one should not be oblivious of how overbought the S&P 500 is.

Following a 2023 in which the S&P 500 jumped 24.3 percent, 2024 picked up where it left off. In the first month, it rose 1.6 percent, which is much weaker than the 6.2-percent rally the large cap index put up in January last year, but an up January nevertheless bodes well for the year.
Investors widely believe that as goes January so goes the year. The so-called January barometer’s record when the month is up is strong.
Chart 1 plots the annual performance in the S&P 500 going back to 1951 – for a total of 73 years. The data is divided into four buckets: (1) years that finished up when January was up, (2) years that finished down when January was up, (3) years that finished down when January was down, and (4) years that finished up when January was down. The number of years corresponding to each bucket are put in parenthesis.
It turns out the January barometer’s success rate is strong when January ends in the green. Out of the 73, this occurred 38 times; there were only five years that ended down with an up January. This is a very high success rate. In contrast, the record of a down January is mixed right down the middle, with the year ending up or down 15 times each, which is nothing but a coin flip.

This bodes well for the rest of the year. That said, this of course is not etched in stone. Thus far, February is following firmly on the footsteps of January with the first two sessions alone bringing gains of 2.3 percent. This, at the same time, questions the sustainability of the move.
The S&P 500 bottomed late October last year at 4104. Last Friday, it ticked 4975, with a session close of 4959, up 1.4 percent for the week. This was the fourth consecutive up week – and the 13th in 14. From the October low, it is up north of 21 percent.
Conditions are extremely overbought, with the weekly RSI at 72.71. Concurrently, breadth is narrowing, with the percentage of S&P 500 stocks above the 50-day moving average last week down 10.2 percentage points week-over-week to 66.4 percent.
Investors Intelligence’s bullish percent, in the meantime, jumped 4.8 percentage points w/w to 57.7 percent last week (as of Tuesday). This metric is yet to hit 60, which may very well happen in the best of circumstances, but the fact remains that last week’s reading was the highest since mid-July 2021.
In the event of a pullback, short-term support lies at 4900, followed by the important 4800-4810s. Three weeks ago, the index eclipsed the prior record high of 4819 from January 2022, followed by bids at 4840s in the following couple of weeks. Given how extended several metrics are, it is just a matter of time before another retest occurs. Bulls’ failure to defend the breakout will open up opportunities for the bears.
Read Full Story »»»
DiscoverGold
$SPX - Daily View...
By: Sahara | February 2, 2024
• $SPX - Daily View...

• $SPX - Caution...
Watch for Large 'M'-Top Pattern...

Read Full Story »»»
DiscoverGold
$NDX - Daily View...
By: Sahara | February 2, 2024
• $NDX - Daily View...

• $NDX - Caution.
Watch for Large 'M'-Top Pattern...

Read Full Story »»»
DiscoverGold
The 10 Top/Bottom S&P 500 Index percent net change performers
By: Thom Hartle | February 5, 2024
• Today (8:34 CST), the 10 top/bottom percent net change performers in the S&P 500 Index.

Read Full Story »»»
DiscoverGold
The 10 Top/Bottom NASDAQ 100 Index percent net change performers
By: Thom Hartle | February 5, 2024
• Today (8:34 CST), the 10 top/bottom percent net change performers in the NASDAQ 100 Index.

Read Full Story »»»
DiscoverGold
AI-generated Buy and Sell Daily Signals
By: Hedgeye | February 5, 2024
• This is free access to our brand-new AI-generated buy and sell signals.

Read Full Story »»»
DiscoverGold
CoT: Peek Into Future Through Futures, How Hedge Funds Are Positioned
By: Hedgopia | February 3, 2024
• Following futures positions of non-commercials are as of January 30, 2024.
E-mini S&P 500: Currently net short 226k, up 36.5k.

Another up week! Four in a row; it was the 13th up week in 14. Until Wednesday’s FOMC meeting-induced selling, the S&P 500 was down 0.9 percent for the week. Then it rallied 2.3 percent in the remaining two sessions to reverse the week higher 1.4 percent.
All in all, breadth was narrow, with the percentage of S&P 500 stocks above the 50-day down 10.2 percentage points w/w to 66.4 percent. The bulls will take this regardless. The large cap index posted yet another intraday high of 4975, closing the week at 4959.
The S&P 500 has been rallying since late October last year when it bottomed at 4104. It is up north of 21 percent. Even some ardent bulls are saying, ‘this is crazy!’ The latest move higher came on January 19th when the index busted through 4800, which had held it down since late December, which also meant the January 2022 high of 4819 was eclipsed.
In the meantime, Investors Intelligence’s bullish percent this week jumped 4.8 percentage points w/w to 57.7 percent. While it can be argued that sentiment is yet to hit 60 percent, the fact remains that this week’s reading reached the highest since mid-July 2021. There is a limit to how much a rubber band can be stretched.
In the event of a pullback, short-term support lies at 4900, followed by the important 4800-4810s.
Nasdaq (mini): Currently net long 39.3k, up 6.2k.

Of the five majors reporting this week (more on this here), post-earnings reaction was negative for Apple (AAPL), Microsoft (MSFT) and Google owner Alphabet (GOOG) and positive for Amazon (AMZN) and Facebook owner Meta (META). Yet, the Nasdaq 100 ended up 1.3 percent for the week. As a matter of fact, the tech-heavy index was down 1.7 percent until Wednesday, before rallying three percent on Thursday and Friday to end the week at 17643.
Friday’s high of 17682 surpassed last week’s high of 17665 by a tad. More importantly, last week’s spinning top has been followed by a potentially bearish hanging man, which, if true, can signal an important reversal. Fingers crossed!
Russell 2000 mini-index: Currently net short 10.5k, up 4.3k.

The Russell 2000 diverged with both the S&P 500 and Nasdaq 100 in a big way. The small cap index dropped 0.8 percent for the week, while the other two indices were solidly in the plus column.
Ironically, even in the wake of Friday’s robust jobs report, the Russell 2000, which has a larger exposure to the domestic economy than its large-cap peers, failed to rally. For two weeks now, the index has struggled at 2000, and that was true this Tuesday and Wednesday.
Earlier on December 13th, the Russell 2000 broke out of a 200-point range between 1900 and 1700, which had been in place since January last year. A measured-move target of the breakout came to 2100, which was just about hit two weeks later when on December 27th it tagged 2072.
It now increasingly looks like the index once again is headed for a breakout retest at 1900, which occurred mid-January – successfully.
US Dollar Index: Currently net long 372, down 1.3k.

The US dollar index, up 0.5 percent this week to 103.78, has now rallied for five straight weeks. it bottomed at 100.32 on December 28th.
Before that, the index peaked on October 3rd at 107.05 and began to really come under pressure early November. Post-Fed pivot on December 13th, it sliced through horizontal support at 103-104. It has now made a return trip to that price point.
Going back all the way to 1999, 103-104 has proven to be crucial for both bulls and bears.
Perhaps importantly, the daily RSI this week turned up right at the median, even as the weekly – at 52.15 – just crossed over from below. Dollar bulls should like this. Momentum will decidedly shift upward once 103-104 gives way.
VIX: Currently net short 54.5k, up 5.3k.

As things stand, the daily could go either way.
The streak of higher lows since December 12th when VIX tagged 11.81 intraday continued this week, with a low of 13.18 on Wednesday and a weekly close of 13.85, up 0.59 points w/w. This was the second week in the last three the volatility index has gone hand in hand with the S&P 500. This in and of itself is rare, as the two tend to go in the opposite direction.
Amidst this, the 50-day (13.07) is no longer dropping, rather flattish to ever so slightly higher, even as the 200-day (15.21) is flattish to slightly lower. Just looking at the way these averages are positioned, and considering the existing pattern of higher lows, VIX is getting ready to meaningfully firm up in the weeks ahead.
Read Full Story »»»
DiscoverGold
S&P 500 Index (SPX) »» Weekly Summary Analysis
By: Marty Armstrong | February 3, 2024
Here in S&P 500 Cash Index, we do find that this particular market has correlated with our Economic Confidence Model in the past. Our next ECM target remains Tue. May 7, 2024. The Last turning point on the ECM cycle low to line up with this market was 2009 and 2002. The Last turning point on the ECM cycle high to line up with this market was 2022 and 2007 and 2000.
MARKET OVERVIEW
NEAR-TERM OUTLOOK
The S&P 500 Cash Index has continued to make new historical highs over the course of the rally from 1974 moving into 2024. Noticeably, we have elected two Bullish Reversals to date.
This market remains in a positive position on the weekly to yearly levels of our indicating models. Pay attention to the Monthly level for any serious change in long-term trend ahead.
Looking at the indicating ranges on the Daily level in the S&P 500 Cash Index, this market remains in a bullish position at this time with the underlying support beginning at 492931.
On the weekly level, the last important high was established the week of January 29th at 497529, which was up 14 weeks from the low made back during the week of October 23rd. So far, this week is trading within last week's range of 497529 to 484515. Nevertheless, the market is still trading upward more toward resistance than support. A closing beneath last week's low would be a technical signal for a correction to retest support.
When we look deeply into the underlying tone of this immediate market, we see it is currently still in a semi neutral posture despite declining from the previous high at 497529 made 0 week ago. This market has made a new historical high this past week reaching 497529. Here the market is trading positive gravitating more toward resistance than support. We have technical support lying at 489359 which we are still currently trading above for now.
Right now, the market is above momentum on our weekly models hinting this is still bullish for now as well as trend, long-term trend. Looking at this from a wider perspective, this market has been trading up for the past 4 weeks overall.
INTERMEDIATE-TERM OUTLOOK
YEARLY MOMENTUM MODEL INDICATOR
Our Momentum Models are rising at this time with the previous low made 2022 while the last high formed on 2023. However, this market has rallied in price with the last cyclical high formed on 2022 warning that this market remains strong at this time on a correlation perspective as it has moved higher with the Momentum Model.
Interestingly, the S&P 500 Cash Index has been in a bullish phase for the past 10 months since the low established back in March 2023.
Critical support still underlies this market at 423850 and a break of that level on a monthly closing basis would warn that a sustainable decline ahead becomes possible. Nevertheless, the market is trading above last month's high showing some strength.
DiscoverGold
Nasdaq Composite Index (COMP) »» Weekly Summary Analysis
By: Marty Armstrong | February 3, 2024
Here in NASDAQ Composite Index Cash, we do find that this particular market has correlated with our Economic Confidence Model in the past. Our next ECM target remains Tue. May 7, 2024. The Last turning point on the ECM cycle low to line up with this market was 2022 and 2009 and 2002. The Last turning point on the ECM cycle high to line up with this market was 2007 and 2000.
MARKET OVERVIEW
NEAR-TERM OUTLOOK
The historical perspective in the NASDAQ Composite Index Cash included a rally from 2009 moving into a major high for 2021, the market has been in a bearish trend since the high moving into the low in 2022 for a declining trend during that year. The last Yearly Reversal to be elected was a Bullish at the close of 2022.
This market remains in a positive position on the weekly to yearly levels of our indicating models. Pay attention to the Monthly level for any serious change in long-term trend ahead.
Looking at the indicating ranges on the Daily level in the NASDAQ Composite Index Cash, this market remains in a bullish position at this time with the underlying support beginning at 1544987. The market is trading closer to the resistance level at this time. An opening above this level in the next session will imply that a bounce is unfolding.
On the weekly level, the last important high was established the week of January 29th at 1566421, which was up 14 weeks from the low made back during the week of October 23rd. So far, this week is trading within last week's range of 1566421 to 1515849. Nevertheless, the market is still trading upward more toward resistance than support. A closing beneath last week's low would be a technical signal for a correction to retest support.
When we look deeply into the underlying tone of this immediate market, we see it is currently still in a semi neutral posture despite declining from the previous high at 1566421 made 0 week ago. The broader perspective, this current rally into the week of January 29th reaching 1566421 has exceeded the previous high of 1515007 made back during the week of December 25th.
Right now, the market is above momentum on our weekly models hinting this is still bullish for now as well as trend, long-term trend. Looking at this from a wider perspective, this market has been trading up for the past 4 weeks overall.
INTERMEDIATE-TERM OUTLOOK
YEARLY MOMENTUM MODEL INDICATOR
Our Momentum Models are rising at this time with the previous low made 2022 while the last high formed on 2023. However, this market has rallied in price with the last cyclical high formed on 2021 warning that this market remains strong at this time on a correlation perspective as it has moved higher with the Momentum Model.
Interestingly, the NASDAQ Composite Index Cash has been in a bullish phase for the past 10 months since the low established back in March 2023.
This market is trading within less than a half percent below that previous key high of January which was 1563058. Critical support still underlies this market at 1316160 and a break of that level on a monthly closing basis would warn of a further decline ahead becomes possible. Nevertheless, at this time, the market is still holding and is trading above last month's high.
DiscoverGold
All these stocks hit new 52 WEEK HIGHS at some point today
By: Evan | February 2, 2024
• All these stocks hit new 52 WEEK HIGHS at some point today
Facebook $META
Amazon $AMZN
Nvidia $NVDA
Berkshire Hathaway $BRK.B
Walmart $WMT
Costco $COST
American Express $AXP
DraftKings $DKNG
Caterpillar $CAT
Eli Lilly $LLY
Mastercard $MA
$UBER
General Electric $GE
Procter & Gamble $PG
Super Micro $SMCI
Snowflake $SNWO
Spotify $SPOT
AbbVie $ABBV
Adobe $ADBE
Autodesk $ADSK
Amgen $AMGN
Arista $ANET
Boston Scientific $BSX
Cigna $CI
Chipotle $CMG
$DELL
Dick's $DKS
ELF Beauty $ELF
Fastenal $FAST
Fiserv $FI
Hartford Financial $HIG
Hilton $HLT
Howmet $HWM
Interactive Brokers $IBRK
JB Hunt $JBHT
Marriot $MAR
Mckesson $MCK
Moody's $MCO
Merck $MRK
Pinterest $PINS
Regeneron $REGN
Ross Stores $ROST
$TJX
Union Pacific $UNP
US Foods $USFD
Read Full Story »»»
DiscoverGold
Up January vs. Down January Beats All Months
By: Almanac Trader | February 2, 2024

• Largest Improvement over next 11 months and next 12 months
• Next 11 months after Up January: +11.6%
• Next 11 month after Down January: +1.2%
Up January has much more outperformance versus when it’s down than any other month in the year on the following 11-months or 12-months return. Since 1938, when the S&P 500 was up in January the next 11-months average a gain of 11.6%. When January is down, the next 11-months average plummets to just 1.2%. Years with a positive January have historically outperformed a down January by 10.4%. Over the following 12 months, the outperformance grows to 11.2%. No other month comes close to these levels.
Hallelujah! The January Barometer is positive.

S&P 500 was up 1.6% this January which avoids the historically worst combination for the January Indicator Trifecta where all three are negative. Devised by Yale Hirsch in 1972, the January Barometer has registered 12 major errors since 1950 for an 83.8% accuracy ratio. This indicator adheres to propensity that as the S&P 500 goes in January, so goes the year. Of the 12 major errors, nine have occurred since 2001. Including the eight flat years yields a .730 batting average.
Our January Indicator Trifecta combines the Santa Claus Rally (SCR), the First Five Days Early Warning System (FFD) and our full-month January Barometer (JB). The predicative power of the three is considerably greater than any of them alone; we have been rather impressed by its forecasting prowess. It was certainly on the mark last year when all three were positive and S&P 500 gained 24.2%. However, this year is just the fourth time that the SCR and FFD were down, and the JB was positive.
As you can see from the table above, a positive JB has significantly improved the performance over the next 11 months and for the full year compared to when all three January indicators were down. In the prior three years when the SCR and FFD were down, but the JB was positive, next 11-month and full year gains averaged 15.1% and 19.9% respectively. This compares quite favorably to when all three January indicators were down as the next 11-months averaged just 0.2% and full year averaged a loss of 3.6%.
All Election Years Up When January Barometer Up

S&P 500 gained 1.6% in January and thus our January Barometer is positive for 2024. Full years followed January’s direction in 12 of the last 18 presidential election years. But 9 Election Years since 1950 with an up January Barometer are up 100% of the time with an average 15.6% S&P 500 gain.
JB is not a stand-alone indicator. Use in conjunction with other data and indicators to confirm or question your assessment of the market. Since 1938 when JB was positive, full year was positive 86.5% of the time & when it’s down the year was up 44.1% of the time. Every down January since 1950 was followed by a new or continuing bear market, a 10% correction or a flat year. Down Januarys were followed by substantial declines averaging -13.3%. See page 24 in the 2024 Stock Trader’s Almanac.
Read Full Story »»»
DiscoverGold
$SPX Bearish divergence spotted
By: TrendSpider | February 2, 2024
• Bearish divergence spotted.

Read Full Story »»»
DiscoverGold
$SPX Relentless Nonstop Bidding
By: Cheddar Flow | February 2, 2024
• $SPX Relentless
Nonstop Bidding.

Read Full Story »»»
DiscoverGold
January 2024 Key ETF Performance
By: Markets & Mayhem | February 1, 2024
The first month of 2024 is already complete, and below is a look at the performance of various asset classes during January using key ETFs that we track closely. The S&P 500 (SPY) finished the month up 1.59% even though the average stock in the index was down 0.84%. While large-cap ETFs like SPY and QQQ finished the month higher, the small-cap Russell 2,000 (IWM) was down 3.9%.
At the sector level, Real Estate (XLRE) and Consumer Discretionary (XLY) both fell 4%+, while Communication Services (XLC) saw the biggest move to the upside at 4.4%. International equity ETFs were all over the place in January with India (PIN) and Japan (EWJ) solidly higher and China (ASHR) and Hong Kong (EWH) sharply lower. Oil (USO) was actually the best performing area of the entire matrix in January with a gain of 6.4%. On the flip side, natural gas (UNG) and silver (SLV) both fell 3%+.

Read Full Story »»»
DiscoverGold
Bullish Sentiment Can Stay Bullish
By: Almanac Trader | February 2, 2024

Concern over frothy bullish sentiment has some of the biggest bulls concerned. But Bullish sentiment can stay high for quite a while. Just look at the two Investors Intelligence Bullish and Bearish readings. Both the difference and ratio of bulls & bears were at and above these levels in 2021 as the market ripped higher all year. Contrary sentiment indicators are more effective at extremes and at calling bottoms not tops.
Yesterday’s selloff as the market came to grips with the fact that a March rate cut is unlikely suggests we may be due for some further weakness. Which is not out of the ordinary for February even into March. February is the weak link of the Best Six Months so expect some pullback.

Read Full Story »»»
DiscoverGold
AI-generated Buy and Sell Daily Signals
By: Hedgeye | February 2, 2024
• This is free access to our brand-new AI-generated buy and sell signals.

Read Full Story »»»
DiscoverGold
$TQQQ Has received unusually active flow today
By: Cheddar Flow | February 1, 2024
• $TQQQ Has received unusually active flow today
A lot of these put orders were bought to open with a near-term expiration
They are bearish bets on Nasdaq

Read Full Story »»»
DiscoverGold
|
Followers
|
178
|
Posters
|
|
|
Posts (Today)
|
0
|
Posts (Total)
|
67938
|
|
Created
|
06/10/03
|
Type
|
Free
|
| Moderators DiscoverGold | |||
:::::::::::: Welcome to S&P 500 & Nasdaq Analysis and Trends :::::::::::::
• The purpose of this board is to help others with Short & Long term S&P 500 & Nasdaq analysis and direction.
• This is strickly an educational board helping traders to learn market direction, swing and bottom trading.
• I ask that everyone respect opinions on the board whether you agree with them or not. We are all here to make money and avoid the
minimum loss we can.
Rules of the Board
Most of this board's WATCHERS are "lurkers" who appreciate info available without the need to sift through tons of "empty" posts.
1. Respect everyone opinions on trades.
2. No Pumping of Stocks.
3. No OTCBB or PINK STOCKS
*********************************************************************************************************
To help us evaluate our performance, please "BoardMark" the board if you find it useful.
To do so, just click on "Add to Favorites" Button at Right just above the Posts Dates.
 Presently, the Board has 178 Boardmarks, Thank you!
*Information Posted on this Board is not Meant to Suggest any Specific Action, But to Point Out the Technical Signs That Can Help Our Readers Make Their Own Specific Decisions. Your Due Deligence is a Must.
EXCHANGE TRADED FUNDS~ETFs COMPONENTS~RSI and I/V charts#msg-5495097 COMPONENTSFOR ^NDX / QQQQ ~ I/V charts #msg-9787995
Gold~ Silver~ HUI~ XAU~ US$~ €uro~ Crude #msg-29347660 (thanks,bob)
Cookies/Bandwidth/Security/Privacy #msg-9353921 PIEs/Cookies/Macromedia/Flash #msg-9412363 PerformanceTips for WinXP #msg-9854670
| Volume | |
| Day Range: | |
| Bid Price | |
| Ask Price | |
| Last Trade Time: |


