 News
News  Market Data
  Discover
Support: 888-992-3836
Copyright © 2023 InvestorsHub Inc.


Register for free to join our community of investors and share your ideas. You will also get access to streaming quotes, interactive charts, trades, portfolio, live options flow and more tools.
S&P 500 Index (SPX) »» Weekly Summary Analysis
By: Marty Armstrong | May 18, 2024
S&P 500 Cash Index closed today at 530327 and is trading up about 11% for the year from last year's settlement of 476983. This price action here in May is reflecting that this is within the scope of a bearish reactionary move on the monthly level thus far. As we stand right now, this market has made a new high exceeding the previous month's high reaching thus far 532549 intraday and is still trading above that high of 526395.
ECONOMIC CONFIDENCE MODEL CORRELATION
Here in S&P 500 Cash Index, we do find that this particular market has correlated with our Economic Confidence Model in the past. The Last turning point on the ECM cycle low to line up with this market was 2009 and 2002. The Last turning point on the ECM cycle high to line up with this market was 2022 and 2007 and 2000.
MARKET OVERVIEW
NEAR-TERM OUTLOOK
The S&P 500 Cash Index has continued to make new historical highs over the course of the rally from 1974 moving into 2024. Noticeably, we have elected two Bullish Reversals to date.
This market remains in a positive position on the weekly to yearly levels of our indicating models. Pay attention to the Monthly level for any serious change in long-term trend ahead.
Focusing on our perspective using the indicating ranges on the Daily level in the S&P 500 Cash Index, this market remains in a bullish position at this time with the underlying support beginning at 523726.
On the weekly level, the last important high was established the week of May 13th at 532549, which was up 29 weeks from the low made back during the week of October 23rd. So far, this week is trading within last week's range of 532549 to 521116. Nevertheless, the market is still trading upward more toward resistance than support. A closing beneath last week's low would be a technical signal for a correction to retest support.
When we look deeply into the underlying tone of this immediate market, we see it is currently still in a weak posture. This market has made a new historical high this past week reaching 532549. Here the market is trading positive gravitating more toward resistance than support. We have technical support lying at 529174 which we are still currently trading above for now.
Right now, the market is above momentum on our weekly models hinting this is still bullish for now as well as trend, long-term trend. Looking at this from a wider perspective, this market has been trading up for the past 4 weeks overall.
INTERMEDIATE-TERM OUTLOOK
YEARLY MOMENTUM MODEL INDICATOR
Our Momentum Models are rising at this time with the previous low made 2022 while the last high formed on 2023. However, this market has rallied in price with the last cyclical high formed on 2022 warning that this market remains strong at this time on a correlation perspective as it has moved higher with the Momentum Model.
Looking at the longer-term monthly level, we did see that the market has made a low following the previous high of March at 495356. The fact that the market for April close below the previous month's low is a sign of near-term weakness with a possible decline into the next turning point on the Array. So far here in May this market has held above last month's low reaching 501105. At this time, May has rallied to exceed the previous month's high reaching 532549. This implies we may see a rally into the next turning point on the top line of the Array. So pay close attention.
Critical support still underlies this market at 438504 and a break of that level on a monthly closing basis would warn that a sustainable decline ahead becomes possible. Nevertheless, the market is trading above last month's high showing some strength.
 DiscoverGold
Nasdaq Composite Index (COMP) »» Weekly Summary Analysis
By: Marty Armstrong | May 18, 2024
NASDAQ Composite Index Cash closed today at 1668597 and is trading up about 11% for the year from last year's settlement of 1501135. This price action here in May is reflecting that this is within the scope of a bearish reactionary move on the monthly level thus far. As we stand right now, this market has made a new high exceeding the previous month's high reaching thus far 1679783 intraday and is still trading above that high of 1649065.
ECONOMIC CONFIDENCE MODEL CORRELATION
Here in NASDAQ Composite Index Cash, we do find that this particular market has correlated with our Economic Confidence Model in the past. The Last turning point on the ECM cycle low to line up with this market was 2022 and 2009 and 2002. The Last turning point on the ECM cycle high to line up with this market was 2007 and 2000.
MARKET OVERVIEW
NEAR-TERM OUTLOOK
The NASDAQ Composite Index Cash has continued to make new historical highs over the course of the rally from 2009 moving into 2024. Clearly, we have elected four Bullish Reversals to date.
This market remains in a positive position on the weekly to yearly levels of our indicating models. Pay attention to the Monthly level for any serious change in long-term trend ahead.
The perspective using the indicating ranges on the Daily level in the NASDAQ Composite Index Cash, this market remains in a bullish position at this time with the underlying support beginning at 1640705.
On the weekly level, the last important high was established the week of May 13th at 1679783, which was up 29 weeks from the low made back during the week of October 23rd. So far, this week is trading within last week's range of 1679783 to 1633486. Nevertheless, the market is still trading upward more toward resistance than support. A closing beneath last week's low would be a technical signal for a correction to retest support.
When we look deeply into the underlying tone of this immediate market, we see it is currently still in a weak posture. This market has made a new historical high this past week reaching 1679783. Here the market is trading positive gravitating more toward resistance than support. We have technical support lying at 1669126 which we are currently trading below implying the market is very weak. This infers that this level will now be resistance. Our Major Channel Support lies at 1418428 and a break of that level would be a bearish indication for this market.
Right now, the market is above momentum on our weekly models hinting this is still bullish for now as well as trend, long-term trend. Looking at this from a wider perspective, this market has been trading up for the past 4 weeks overall.
INTERMEDIATE-TERM OUTLOOK
YEARLY MOMENTUM MODEL INDICATOR
Our Momentum Models are rising at this time with the previous low made 2022 while the last high formed on 2023. However, this market has rallied in price with the last cyclical high formed on 2021 warning that this market remains strong at this time on a correlation perspective as it has moved higher with the Momentum Model.
Looking at the longer-term monthly level, we did see that the market has made a low following the previous high of March at 1522278. The fact that the market for April close below the previous month's low is a sign of near-term weakness with a possible decline into the next turning point on the Array. So far here in May this market has held above last month's low reaching 1555764. At this time, May has rallied to exceed the previous month's high reaching 1679783. This implies we may see a rally into the next turning point on the top line of the Array. So pay close attention.
Critical support still underlies this market at 1405840 and a break of that level on a monthly closing basis would warn that a sustainable decline ahead becomes possible. Nevertheless, the market is trading above last month's high showing some strength.
DiscoverGold
The One Chart to Watch as S&P 500 Makes New All-Time Highs
By: David Keller | May 17, 2024
As the S&P 500 and Nasdaq 100 have once again made new all-time highs, and the Dow Jones Industrial Average has briefly broken above the 40,000 level for the first time, how should we think about further upside for our equity benchmarks?

There are two general ways to play a chart pushing higher into uncharted territory, pun intended. First, we can use technical tools to identify potential upside objectives, using things like Elliott Wave or Gann or pattern measurements. I tend to avoid this sort of approach, only because I've learned that when something is working, you want to keep it working as long as possible!
Peter Lynch famously compared this approach to growing a garden. If you're selling your winners and doubling down on your losers, it's like pulling your flowers and watering your weeds! To grow a beautiful garden, you want to pull the weeds and water your flowers. So in a portfolio context, that means riding winning stocks higher as long as they continue to help your portfolio.
So the second general approach is to become a trend-follower, tracking the uptrend and looking for signs of any change in that trend. Here's one chart I'm using now to make that general assessment for the S&P 500.

This chart has three series, starting with a high yield index option-adjusted spread from Bank of America. If you're confused by that wordy title, allow me to simplify. Bonds are quoted in terms of a spread above a risk-free rate. So US Treasury bonds are considered a "risk-free investment" because it is highly unlikely that the US government would be unable to pay interest on their debt obligations. Any corporate bond, issued by a particular company, by definition will bear additional risk than a Treasury bond. So a corporate spread of any kind tells you the additional yield you should expect to receive for taking on that additional risk.
Lots of corporate bonds include call options, meaning the bond can be redeemed by the company before maturity. In this case, we're using an "option-adjusted spread", which means you are stripping out those options to compare bonds on more of an apples-to-apples basis. And this spread is based on high-yield or "junk" bonds, meaning the bonds of risky companies with lower credit scores.
So to summarize, we are tracking how much of a spread bond investors are demanding for taking on the risk of junk bonds. I've plotted this series upside down because wider spreads mean additional risk, which usually means bad news for equities. You can see that when spreads are widening (the line is going lower on this chart), that tends to coincide with downtrends for the S&P 500 (bottom panel). Conversely, narrowing spreads tend to coincide with uptrend for the major equity indexes.
High-yield spreads are currently at the lowest levels in years, suggesting that bond investors are expecting a low-risk environment for the foreseeable future. If and when we see spreads start to widen, as they did in early April, that would be a bearish sign for stocks.
The middle series shows the VIX, because markets tend to rise on low volatility and stocks tend to drop with much higher volatility conditions. I've plotted this series upside-down as well, because it makes it easier to compare volatility to the S&P 500 trend. The VIX is also at its lowest levels that we've seen in the last two years, demonstrating what I would describe as a low-volatility environment. If and when the VIX would increase above 15, and especially if it would eclipse the 20 level, that would indicate a much more bearish environment for risk assets like the S&P 500 and Nasdaq 100.
To be clear, this chart is currently quite bullish, with the S&P 500 trending higher along with narrow high-yield spreads and very low volatility. If and when we see a widening of credit spreads, and if and when volatility begins to increase, that could be a great opportunity for equity investors to really question the sustainability of the bull market phase.
Read Full Story »»»
DiscoverGold
The Pending Crash - Short Sweat or into 2026?
By: Marty Armstrong | May 18, 2024
Our two precise targets here in 2024 were 40825.47 and 44300.58. We can see that since the Dow did NOT peak precisely on May 7th, that is the GOOD NEWS. Otherwise, that would have warned of a decline of 4 to 5 years to come, which really did not make sense given the prospects for the combination of war and the Sovereign Debt Crisis.
There is no question that 2024 was a Directional Change and we still see higher volatility into 2025. Yes, one would expect commercial real estate to crash with higher interest rates and the damage done to this sector thanks to the COVID lockdowns...
DiscoverGold $SPY $2.9 Billion worth of sig Dark Pool prints today
By: Cheddar Flow | May 17, 2024
• $SPY $2.9B worth of sig Dark Pool prints today
SPY has been pinned to this price for most of the session

Read Full Story »»»
DiscoverGold
$QQQ Unusual amount of singular Dark Pool prints from earlier today
By: Cheddar Flow | May 17, 2024
• $QQQ Unusual amount of singular Dark Pool prints from earlier today

Read Full Story »»»
DiscoverGold
Is This The Magic Upward Break Everybody Was Waiting For?
By: Julius de Kempenaer | May 17, 2024
• Sector rotation still pointing to defense
• Upward break in SPY not supported by volume
• Asset class rotation` starting to rotate in favor of bonds

No Confirmation In Volume.
This week, the S&P 500 is breaking out above its previous high, undeniably a bullish sign for the market.
After the initial break on Wednesday, the market held up well on Thursday. However, a few things are holding me back from getting overly enthusiastic.
One of the issues is the volume pattern, as can be seen on the above spy chart. The lower pane holds the volume combined with its moving average (the blue line). During the decline from the 525 peak at the end of March all the way down to 494 in the second half of April, the volume rose slightly. So, we had a declining price on rising volume.
The rally out of the low has taken place on declining volumes. The technical rule is that volume should increase in the direction of the trend. So, if we were in a full-fledged uptrend, I would have expected the volume to decline during the move lower and then rise again from 494 to current levels. Also, higher volumes do not accompany the break above resistance, which usually makes upward breaks (more) reliable.
Sector Rotation Not Supportive

The relative rotation graph above shows long and strong tails for defensive sectors. As you know, the traditionally defensive sectors are utilities, consumer staples, and healthcare.
Utilities and staples are inside the improving quadrant and on a strong RRG-Heading toward leading. The healthcare sector is inside the lagging quadrant and has just started to curl back up.
Reading from the JdK RS-Ratio axis, energy is the strongest sector at the moment. Although it is not considered a really defensive sector, it has a low beta compared to other sectors, which is also a defensive characteristic.
On the other hand, we see a really offensive sector like consumer discretionary inside the legging quadrant and moving further into it. Other sectors inside the lagging quadrant are technology and real estate. Both move lower on the JdK RS-ratio scale at a stable negative RS-momentum level.
Other more offensive or cyclical sectors, like materials, industrials, and financials, are inside the leading quadrant. Still, they have rolled over and are now out of the zero to 90-degree RG heading. Overall, this combination of rotations is not what you would expect during a strong rally in a bull market.
A strong rally in the S&P 500 is not in line with this type of sector rotation.
Obviously, there are two ways this situation can be resolved. The first one is that the sector rotation will move to a more offensive trajectory in the coming weeks, matching and catching up with the rally in the S&P 500. The second one is that the S&P 500 gets back in line with a more defensive rotation.
Asset Class Rotation Turning Towards Bonds

Finally, the third observation that makes me cautious is the current state of asset class rotation. as seen in the RRG above.
The tail for SPY is inside the leading quadrant but has been moving lower on the RS momentum scale for a few weeks already, almost crossing over into the weakening quadrant. The tails for fixed-income-related asset classes, government bonds, corporate bonds, and high-yield bonds are inside the improving quadrant, and all are moving at a positive RRG-heading.

Bringing that relationship back to the SPY:IEF chart shows us that this ratio is struggling with the resistance offered by the previous peak, around 5.7.
At the same time, the RSI plotted below the price chart shows a buildup of negative divergence. As you know, this is usually a sign of, at least, a pause or a turn in the existing trend.
A clear reversal of this trend would mean that bonds are taking over the leadership role from stocks. And this usually happens when stocks are moving lower.
All In All
All in All, these three observations make me very cautious regarding the quality of the upside break in the S&P500.
Read Full Story »»»
DiscoverGold
Our Targets on the Dow for 2024
By: Marty Armstrong | May 17, 2024
We have reached our first MID-RANGE target for the Dow in this bull market, and it appears that the vast majority remain totally ignorant of what is truly behind it. For the life of me, I do not understand why people never just look at the trends to see if what they are reporting is valid. I guess it's like polls in California, where people are so brainwashed that they believe men can become pregnant. Here we have the standard explanation of the rally that traders are looking at signs, as reported by Reuters, "of U.S. disinflation resuming and the wider economy cooling all stoked hopes that Federal Reserve interest rate cuts are indeed coming - with annual corporate profit growth and year-to-date stock index gains revving up into double digits." Yet just look, interest rates doubled between 1927 and 1929, and so did the stock market.
Interest rates began to rise when Trump took office. The stock market rallied, and they called it the Trump Rally. They lowered rates thanks to the insane COVID Lockdowns that destroyed the economy and created shortages that produced inflation that the Fed has still been forced to confront...
The plain truth is that where there is that our targets here in 2024 are:
40825.47 and 44300.58
We have to be concerned that a KNEE-JERK Reaction can occur first with the prospect of war. This is the danger as we head into June. Thereafter, as war are the debt crisis merge together, then the shift from PUBLIC to PRIVATE will unfold.
DiscoverGold
$SPX $Millions of Puts
By: Cheddar Flow | May 17, 2024
• $SPX Hello There

Read Full Story »»»
DiscoverGold
Nasdaq 100 breadth rebounds, signaling a more favorable market environment.
By: Dean Christians | May 17, 2024
• Nasdaq 100 breadth rebounds, signaling a more favorable market environment.

Read Full Story »»»
DiscoverGold
The 10 Top/Bottom S&P 500 Index percent net change performers
By: Thom Hartle | May 17, 2024
• Today (8:34 CST), the 10 top/bottom percent net change performers in the S&P 500 Index.

Read Full Story »»»
DiscoverGold
The 10 Top/Bottom NASDAQ 100 Index percent net change performers
By: Thom Hartle | May 17, 2024
• Today (8:34 CST), the 10 top/bottom percent net change performers in the NASDAQ 100 Index.

Read Full Story »»»
DiscoverGold
Earnings season for S&P 500 companies is about 87% complete, and the picture looks pretty healthy
By: SentimenTrader | May 16, 2024
• Earnings season for S&P 500 companies is about 87% complete, and the picture looks pretty healthy.
Reported earnings are on track to grow 10% from Q1 2023; the first back-to-back quarterly increases in a couple of years.
A cruel irony of markets is that what's obvious is often not helpful. It should be obvious that earnings growth is good for stocks. And double-digit growth should be even better.
That hasn't been the case, however.

Read Full Story »»»
DiscoverGold
$SPY $2.5 Million Very Far OTM Put Due to how far OTM it is, the whale is likely hedging an existing position
By: Cheddar Flow | May 16, 2024
• $SPY $2.5M Very Far OTM Put
This contract has seen a jump in volume today
Due to how far OTM it is, the whale is likely hedging an existing position


Read Full Story »»»
DiscoverGold
$SPY Millions worth of ATM Puts just hit the tape were all executed above the ask and have late June + September expirations
By: Cheddar Flow | May 16, 2024
• $SPY Millions worth of ATM Puts just hit the tape
These were all executed above the ask and have late June + September expirations
The flow is still skewed towards further-dated $SPY puts (2-4 months and shorter-dated $SPX calls (1-6 weeks)

Read Full Story »»»
DiscoverGold
Money managers Reduced their exposure to the US Equity markets since last week...
DiscoverGold
NAAIM Exposure Index
May 16, 2024 
The NAAIM Number
89.25
Last Quarter Average
87.84
»»» Read More…
The AAII Investor Sentiment
By: AAII | May 16, 2024
Bullish 40.9%
Neutral 35.9%
Bearish 23.3%
• Historical 1-Year High
Bullish: 52.9%
Neutral: 37.4%
Bearish: 50.3%
Read Full Story »»»
DiscoverGold
Markets Monthly Pattern »» Watchlist - Top 10
By: Marty Armstrong | May 16, 2024
• Dow Jones Industrials Index »» Turning Back UP
• NASDAQ Composite Index »» Still BULLISH
• NASDAQ 100 Index »» Still BULLISH
• S&P 500 Index »» Turning Back UP
• Russell 2000 Index »» New Pattern Forming
• US Dollar Index »» Temp Pause
• CBOE VIX Index »» Turning BACK DOWN
• NY Gold Futures »» Possible High Closing
• NY Silver COMEX Futures »» New Pattern Forming
• NY Crude Oil Futures »» Turning BACK DOWN
DiscoverGold
Millions worth of calls all day long. Here's some notable prints from the past hour
By: Cheddar Flow | May 15, 2024
• Millions worth of calls all day long
Here's some notable prints from the past hour.

Read Full Story »»»
DiscoverGold
The technical analysis suggests that the S&P 500 index may potentially reach 5560 during a summer rally, as part of the ongoing secular bull market within the presidential cycle
By: Isabelnet | May 15, 2024
• The technical analysis suggests that the S&P 500 index may potentially reach 5560 during a summer rally, as part of the ongoing secular bull market within the presidential cycle.

Read Full Story »»»
DiscoverGold
$SPX - Zooming in we can see the 3rd Target from the 'Broadening' has just been Hit. 5389 is the final target
By: Sahara | May 15, 2024
• ... $SPX - Zooming in we can see the 3rd Target from the 'Broadening' has just been Hit. 5389 is the final target.
Note the Target for the fractal 'Broadening' too, all contained in a pot'l Bear 'Wedge' (Red)...

Read Full Story »»»
DiscoverGold
$SPX - Tripping the Targets I showed from that 'Broadening' Plot B/Out of 5125 on the 3rd May...
By: Sahara | May 15, 2024
• $SPX - Tripping the Targets I showed from that 'Broadening' Plot B/Out of 5125 on the 3rd May...

Read Full Story »»»
DiscoverGold
The 10 Top/Bottom S&P 500 Index percent net change performers
By: Thom Hartle | May 15, 2024
• Today (8:34 CST), the 10 top/bottom percent net change performers in the S&P 500 Index.

Read Full Story »»»
DiscoverGold
Still waiting on $SPX to pound out a new all-time high above 5250... but it's worth noting here that the NYSE advance-decline has already done so!
By: David Keller | May 14, 2024
• Still waiting on $SPX to pound out a new all-time high above 5250... but it's worth noting here that the NYSE advance-decline has already done so! Same for large cap and mid cap A-D lines. Bullish breadth = bullish market.

Read Full Story »»»
DiscoverGold
S&P 500: The current reading of 79.43 indicates that the US stock market is overbought, suggesting that prices have risen too quickly
By: Isabelnet | May 14, 2024
• S&P 500
The current reading of 79.43 indicates that the US stock market is overbought, suggesting that prices have risen too quickly.

Read Full Story »»»
DiscoverGold
The 10 Top/Bottom NASDAQ 100 Index percent net change performers
By: Thom Hartle | May 14, 2024
• Today (8:34 CST), the 10 top/bottom percent net change performers in the NASDAQ 100 Index.

Read Full Story »»»
DiscoverGold
Market Situation Report: CPI Outlook
By: Hedgeye | May 14, 2024
There are many moving parts when it comes to the money supply, making it difficult to keep things concise or fully understand it. But let's try. Today's bonus chart in isolation suggests CPI will follow the M2 money supply on a lag and drop sharply over the next 18 months. M2 hasn't been this negative since the 1930s, and that period will become more relevant as we discuss this further.
In the very short term, CPI is likely to remain elevated as the ISM prices paid index rose for the 4th consecutive month, up 5.1%.

Things get more complex when looking at money aggregates. Demand deposits (checking accounts) have essentially been unchanged for 18 months. However, savings accounts have dropped by almost $2 trillion. It could be argued much of this went into retail money markets and CDs by issuing IOUs to consumers. Money market funds lend in repo or buy T-bills, taking the T-bills as collateral if lending in repo. If Janet Yellen spends that Treasury money back into the economy, we'd expect demand deposits to rise, effectively double-counting M2 to some degree.

Interestingly, if the process reverses with redemptions from money markets, the money can come from maturing Treasuries or M1 deposits paying back the money markets, which then pay back M1 depositors. Money market deposits go down, resulting in a significant M2 contraction. As mentioned, it's convoluted and double-counts the money available for goods/services or critically paying off consumer debt.
M1 is down $2.7 trillion since June 2022, yet consumer credit continues rising while bank credit is sideways, despite most M1 creation coming from banks. The debt keeps rising as money gets loaned multiple times. The danger now is the money supply aggregate dropping while debt has hit $40 trillion. Mitigating this divergence would require a higher velocity of money, which obviously slows in a recession. Should unemployment rise, we'll likely see debt come down from defaults. Then the 1930's become part of the conversation. A thought experiment for another day.
Read Full Story »»»
DiscoverGold
Markets Monthly Pattern »» Watchlist - Top 10
By: Marty Armstrong | May 14, 2024
• Dow Jones Industrials Index »» Turning BACK DOWN
• NASDAQ Composite Index »» Warning High Closing
• NASDAQ 100 Index »» New Pattern Forming
• S&P 500 Index »» New Pattern Forming
• Russell 2000 Index »» New Pattern Forming
• US Dollar Index »» Temp Pause
• CBOE VIX Index »» Knee Jerk Low
• NY Gold Futures »» Top High Close
• NY Silver COMEX Futures »» New Pattern Forming
• NY Crude Oil Futures »» Turning BACK DOWN
DiscoverGold
77% of S&P 500 stocks are now trading above their 200D moving average, one of the highest levels in the last 2 years
By: Barchart | May 13, 2024
• 77% of S&P 500 stocks are now trading above their 200D moving average, one of the highest levels in the last 2 years.

Read Full Story »»»
DiscoverGold
Weak May Monthly OpEx Week - DJIA Down 12 of Last 15
By: Almanac Trader | May 13, 2024

Since 1990 May’s monthly OpEx week has a slight bearish bias with DJIA and S&P 500 down 18 and up 16. More recently, DJIA has suffered declines in 12 of the last 15, monthly expiration weeks. S&P 500 has one additional weekly gain since 2009, down 11 of the last 15. NASDAQ has declined in 9 of the last 15.
Read Full Story »»»
DiscoverGold
$SPX $Millions of Calls Flow
By: Cheddar Flow | May 13, 2024
• $SPX & $SPXW Flow

Read Full Story »»»
DiscoverGold
With a current value of 68.22, the Market Greed/Fear Index still indicates a prevailing sentiment of greed among investors, revealing their appetite for higher risk-taking in the US stock market
By: Isabelnet | May 13, 2024
• Sentiment
With a current value of 68.22, the Market Greed/Fear Index still indicates a prevailing sentiment of greed among investors, revealing their appetite for higher risk-taking in the US stock market.
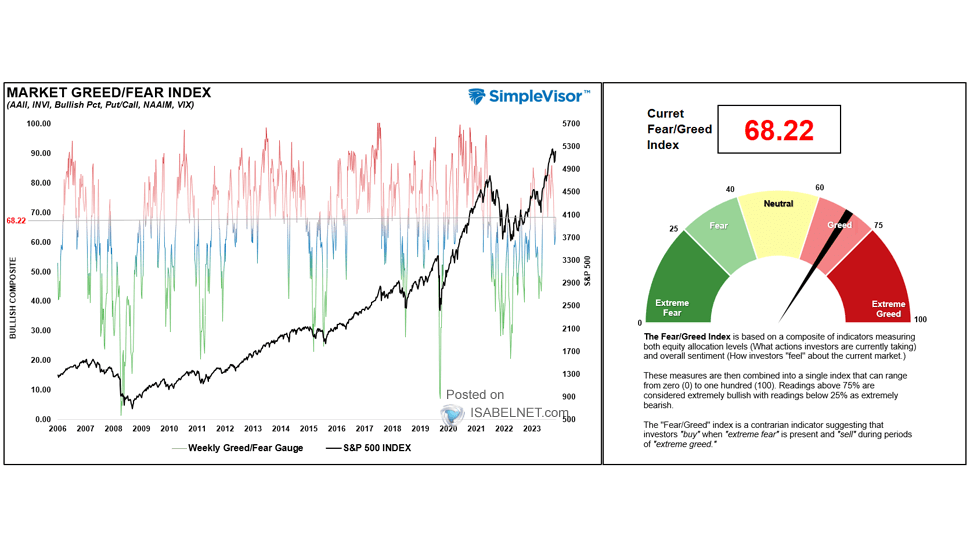
Read Full Story »»»
DiscoverGold
S&P 500: Three consecutive days NYSE advancers of 74% or greater suggest a bullish outlook for the S&P 500 over the next 12 months, with an average gain of 22.7% since 2000
By: Isabelnet | May 13, 2024
• S&P 500
Three consecutive days NYSE advancers of 74% or greater suggest a bullish outlook for the S&P 500 over the next 12 months, with an average gain of 22.7% since 2000.

Read Full Story »»»
DiscoverGold
S&P 500 futures book depth is back to very healthy levels, improving intraday dynamics for futures traders. Reducing the chance of large, gappy moves provided liquidity stays abundant
By: Markets & Mayhem | May 13, 2024
• S&P 500 futures book depth is back to very healthy levels, improving intraday dynamics for futures traders. Reducing the chance of large, gappy moves provided liquidity stays abundant.
Chart: Goldman Sachs
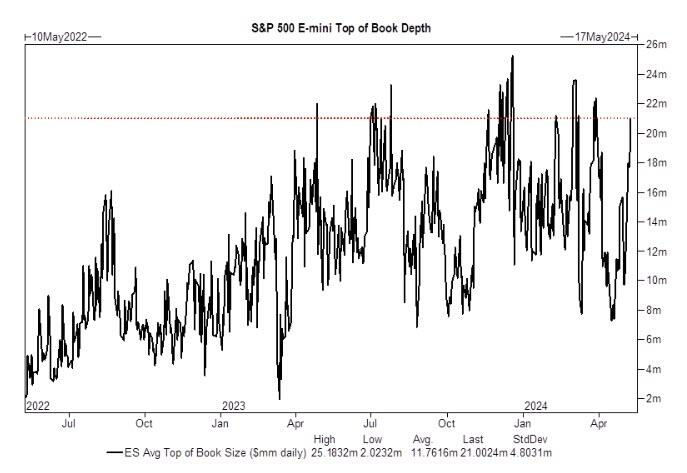
Read Full Story »»»
DiscoverGold
$QQQ Large $658 Million Dark Pool Print
By: Cheddar Flow | May 13, 2024
• $QQQ Large $658M Dark Pool Print

Read Full Story »»»
DiscoverGold
The 10 Top/Bottom S&P 500 Index percent net change performers
By: Thom Hartle | May 13, 2024
• Today (8:34 CST), the 10 top/bottom percent net change performers in the S&P 500 Index.

Read Full Story »»»
DiscoverGold
The 10 Top/Bottom NASDAQ 100 Index percent net change performers
By: Thom Hartle | May 13, 2024
• Today (8:34 CST), the 10 top/bottom percent net change performers in the NASDAQ 100 Index.

Read Full Story »»»
DiscoverGold
Equity Bulls Probably Eyeing Wed’s CPI To Give Additional Boost To Weary Indices
By: Hedgopia | May 13, 2024
If Wednesday’s CPI for April cooperates, equity bulls will try to use it to build on last three weeks’ momentum. Major US equity indices have rallied back to just under their all-time highs from March but are giving out signs of fatigue.

The S&P 500 rallied 1.9 percent last week to 5223. From the low of April 19th through last Friday’s high, it is up 5.8 percent, which just about recovered the 5.9-percent drop from the March 28th peak of 5265.
The large cap index has now rallied for three consecutive weeks. At Friday’s close, it is 0.8 percent from the March peak. In late March and early April, bulls were rejected at 5260s in three sessions over seven before coming under pressure (Chart 1). They would obviously try hard to test those highs again, even as signs of fatigue are showing up.
Last week, on the daily, a couple of sessions ended with a doji, and volume has been nothing to write home about.

At this point, with handsome gains the last three weeks, bulls are desperate for a catalyst. It is most probably not going to be earnings.
The March-quarter earnings season is just about done. As of last Tuesday, 85.6 percent of S&P 500 companies had reported their numbers, with blended operating earnings coming in at $55.41 (Chart 2), which witnessed a nice bump from mid-April’s $53.18, aided primarily by big tech. That said, when the March quarter began, the sell-side was expecting $55.92, and $57.45 last May.
Speaking of which the consensus this year is $241.74, which will have registered a growth rate of 13.2 percent from last year. In 2023, earnings grew 8.4 percent and fell 5.4 percent in 2022. Next year, for whatever it is worth, this year’s momentum is expected to continue with growth of 13.9 percent. If past is any guide, these analysts customarily bring out the scissors as the year progresses. At its height in September 2022, earnings were expected to jump 14.7 percent in 2023.

Bulls are probably eyeing something else to potentially provide a fillip to the latest momentum in equities.
The consumer price index for April is due out Wednesday. Going into this, both headline and core CPI are meaningfully lower from four-decade highs recorded nearly two years ago but are showing signs of stalling in recent months.
In the 12 months of March, headline and core CPI grew 3.48 and 4.80 percent respectively. In 2022, they were rising at 9.06 percent and 6.63 percent in June and September, in that order (bars with blue border in Chart 3). This is a tremendous progress toward the Federal Reserve’s two-percent goal.
However, the disinflation trend has stalled recently. Headline CPI has risen since recording 3.09 percent this January, while the core grew 3.75 percent in February. Further, the core has been above the headline since March last year. Any relief in these trends is likely to ignite risk-on. It remains to be seen if this should to enough to push the indices to new highs.

Equity bulls have two potential problems currently: (1) overbought condition and (2) vanishing bears.
On the daily, the Nasdaq 100, for instance, is way extended, having rallied 7.5 percent in the last three weeks. Of course, it gave back 8.1 percent over four weeks after peaking at 18465 on March 21st – peaking a week before the S&P 500. The tech-heavy index, in fact, failed to sustainably break out of 18300s for seven weeks before going the other way.
Last Friday – a spinning top session – tech bulls rallied the index to 18248 before they ran out of steam (Chart 4). This is taking place just above the 50-day (17943), with the index staying above the average in all five sessions last week; earlier, the Nasdaq 100 remained under the average for 15 consecutive sessions.
Irrespective of what happens post-CPI Wednesday, odds favor a breach of the average in due course – if nothing else just to unwind the overbought condition the index finds itself in.

The Nasdaq 100 is up 7.9 percent year-to-date. Last year, it surged 53.8 percent. This was facilitated by the non-believing bears, among others.
At the end of September 2022, short interest in QQQ (Invesco QQQ Trust) stood at 90.1 million. It ended last year at 60.1 million. By the end of April (this year), this had further shrunk to 49.5 million, which is the lowest since end-July 2020 (Chart 5).
Persistent covering by the bears provided a sustained tailwind to QQQ/Nasdaq 100 in the past. This is disappearing fast, as short interest languishes at a multi-year low. This is also a reason why a post-CPI rally – should there be one – is unlikely to sustain itself.
Read Full Story »»»
DiscoverGold
3 Sentiment Indicators That Turned Bullish Last Week
By: Schaeffer's Investment Research | May 13, 2024
• The S&P 500 is rallying into last year's closing high
• Another round percentage level could act as a pivot/hesitation point this week
“…the SPX bounced off the supportive 80-day moving average, reaching potential resistance levels again. The first was the trendline connecting highs at the start of the current decline, which the index breached on Friday. It comes into the week at 5,102 and will be at 5,077 at the end of the week, meaning it's sloping five points lower each day. However, the convergence of the 30- and 50-day moving averages at 5,130 should be on your radar as a point of potential resistance to watch, if the see-saw action continues. The SPX closed under this level on Friday, putting the trendline breakout in an awkward position heading into next week. Early price action may determine if the SPX breaks out or re-enters the choppy environment.”
-Monday Morning Outlook, May 6, 2024
The S&P 500 Index’s (SPX—5,222.68) converging 30-day and 50-day moving average “resistance” met nothing last week, as the index sliced above them to begin last week’s trading. The 50-day moving average has not been significant in months, so little surprise that it was not significant last week. But the unpopular 30-day moving average proved supportive at the mid-January low and marked resistance in mid-October, and therefore the quick crossover above this trendline was impressive.
As is the case whenever the SPX experienced a healthy pullback or lengthy corrective or bear market action, it claws its way back and there are multiple potential resistance points. In the week prior, it closed above potential trendline resistance connecting lower highs since its peak. While last week, it crossed above the convergence of two important moving averages.
To that point, after three weeks of rally mode, the SPX is again approaching potential resistance from the index's all-time closing high of 5,254. Note that this closing high in late March occurred just above 5,235, or exactly 10% above the 2023 close. Long-time readers of this commentary are very much aware of how round percentage levels like this have a way of acting as hesitation and/or pivot points. In fact, this area was even around Friday’s intraday high.
Also of interest is a line segment that is the site of the breakdown below the lower trendline of a channel in early April at 5,220. The SPX closed just above this level on Friday.
If looking for an entry point on the SPX, await a breakout and close above the all-time closing high with a stop just below it, or await a pullback to the 30-day moving average in the 5,100 area, which is where the SPX broke above the short-term trendline connecting lower highs. Moreover, a trendline using higher lows since last month’s bottom is currently in this area.

“If you are aggressive and anticipate the SPX breaking out above resistance, the one indicator that is giving you permission to do so is the CBOE Market Volatility (VIX – 15.03). In early April, the VIX hinted at higher volatility ahead when it closed above 15.40, or half the 2023 high. It then closed above 18.68 at the start of April expiration week, further hinting at weakness. Since peaking just below the October high point on April 19, it has come down sharply.”
-Monday Morning Outlook, April 29, 2024
“One sentiment indicator that moved in options bulls' favor last week was the 10-day, buy-to-open put/call volume ratio on SPX components. It is now showing hints of rolling over from a relatively high level. This type of behavior typically comes up as the market begins a basing period around the eventual lows, withs some rollovers in the ratio coinciding with bottoms. If the SPX moves above the technical levels discussed above, this indicator will be more valid”
-Monday Morning Outlook, May 6, 2024
Per the excepts above, one by one sentiment indicators are turning more in the bulls’ favor. First it was the Cboe Market Volatility Index’s (VIX—12.55) move back below the important 15.40 level in late April. The advance above 2024’s resistance at 15.40 in early April hinted at increasing volatility and lower equity prices, and the move back below it foreshadowed the decreasing volatility and advance in stocks so far this month.
Last week, option buyers on SPX components began buying less puts relative to calls compared to prior weeks, which created less of a coincidental headwind and foreshadowed a trough and/or bottoming process at hand.
A third indicator turned bullish last week, with the release of short interest data from the exchanges late last week. This data is as of the last day of April trading, so technically this indicator turned bullish in late April. But it wasn’t apparent to us until the exchanges released the data last week.
Per the SPX component short interest graph with SPX overlay below, short interest rolled over after a steady build to a multi-year high. The bottom line conclusion when looking at this graph is bullish, with the SPX trading around its all-time high. The absolute level of SPX component short interest in context of the index itself being near an all-time high suggests that many short positions are underwater. This implies that at a minimum, shorts will not continue to build position, while the possibility of forced short covering would be supportive of a rally.
One sentiment indicator that was in neutral mode last week was the National Association of Active Investment Manger’s (NAAIM) weekly exposure survey. The active managers surveyed in the prior week had roughly 50% exposure but as of last week moved closer to full exposure. This suggests little left in the fuel tank if you are depending on this group to support the market.
Stay in tune with the levels mentioned earlier in this commentary as various sentiment indicators improve for bulls.

Read Full Story »»»
DiscoverGold
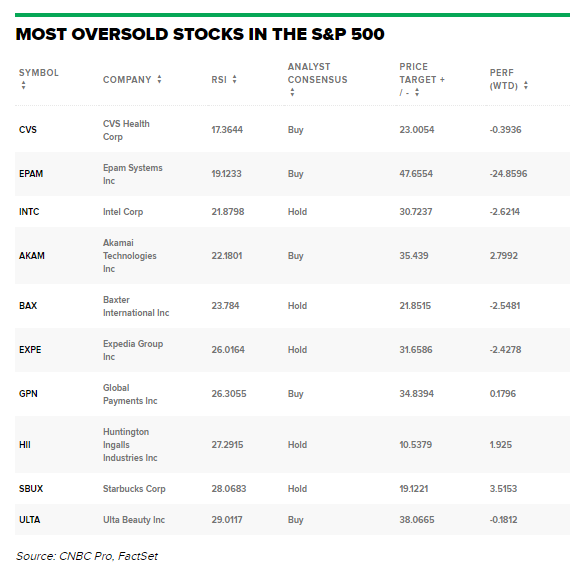
10 Most Oversold Stocks in the S&P 500 - $CVS $INTC $SBUX and $ULTA making the list
By: Barchart | May 11, 2024
• 10 Most Oversold Stocks in the S&P 500 - $CVS $INTC $SBUX and $ULTA making the list.
Read Full Story »»»
DiscoverGold
Market performance by sector so far in 2024
By: Evan | May 11, 2024
• Market performance by sector so far in 2024
1 Comm Services +16%
2 Technology +11%
3 Utilities +10.7%
4 Energy +9.9%
5 Financial +9.7%
6 Industrials +9.4%
7 Consumer Defensive +7.6%
8 Healthcare +5.4%
9 Basic Materials +3.2%
10 Consumer Cyclical +2.9%
11 Real Estate -5.9%
Read Full Story »»»
DiscoverGold
Eyes on the $437 area for support if we see a pullback on the Nasdaq this week
By: TrendSpider | May 12, 2024
• Eyes on the $437 area for support if we see a pullback on the Nasdaq this week

Read Full Story »»»
DiscoverGold
Tech trouble on deck? $NQ $QQQ
By: TrendSpider | May 12, 2024
• Tech trouble on deck? $NQ $QQQ
This week holds the lowest win rate for Nasdaq 100 Futures over the last two decades, closing green just 37% of the time.

Read Full Story »»»
DiscoverGold
The best performing stocks in the S&P 500 over the last 30 years...
By: Charlie Bilello | May 8, 2024
• The best performing stocks in the S&P 500 over the last 30 years...

Read Full Story »»»
DiscoverGold
Flow: Investors' optimism and appetite for potential returns in the US stock market resulted in inflows of $7.72 billion into US equity funds over the past week
By: Isabelnet | May 11, 2024
• Flow
Investors' optimism and appetite for potential returns in the US stock market resulted in inflows of $7.72 billion into US equity funds over the past week.

Read Full Story »»»
DiscoverGold
Big US Stocks’ Q1’24 Fundamentals
By: Adam Hamilton | May 10, 2024
The big US stocks dominating markets and investors’ portfolios continue to thrive. They are finishing up another earnings season covering a record-breaking quarter, reporting some fantastic results. Still these fat underlying profits are growing far slower than major companies’ soaring stock prices. That has forced valuations deeper into dangerous bubble territory, fueling mounting risks for awakening a new bear market.
Prevailing stock prices are mostly driven by herd psychology, popular greed and fear. That often masks how companies are actually faring fundamentally. But those obscuring sentiment fogs are dispelled once a quarter when new results are released. Companies listed on US stock exchanges have 40-calendar-day deadlines after quarter-ends to file these reports with the US Securities and Exchange Commission.
These comprehensive quarterlies include full financial statements, and management’s discussion and analysis on them. MD&As are often more valuable than financials, illuminating material developments and sharing strategies to achieve future growth. These essential quarterly reports offer the best-available fundamental data on individual stocks, yielding excellent insights into how companies are likely to perform.
By the look of the stock markets, big US stocks must be crushing it. In Q1’24 the flagship S&P 500 stock index dominated by these elite companies blasted 10.2% higher in a powerful one-sided advance. While the SPX achieved fully 22 new record closes last quarter, those relentless gains stretched it to extremely-overbought levels. By late March the S&P 500 had soared 14.1% above its baseline 200-day moving average!
Q1’s strong surge naturally fueled serious greed and euphoria, a warning sign flagging major toppings. Couple hyper-bullish popular sentiment with extreme overboughtness and bubble valuations, and stock investors ought to be wary. That includes all Americans with retirement accounts, which are heavily invested in big US stocks! With the SPX mostly grinding lower since Q1 ended, the reckoning may be underway.
As always big US stocks’ latest Q1’24 results are important for gaming stock markets’ likely direction in coming months. For 27 quarters in a row now, I’ve analyzed how the 25 largest US companies that dominate the SPX fared in their latest earnings seasons. Exiting Q1, these behemoths commanded a stunning record 46.8% of the SPX’s total market cap! Their latest-reported key results are detailed in this table.
Each big US company’s stock symbol is preceded by its ranking change within the S&P 500 over the past year since the end of Q1’23. These symbols are followed by their stocks’ Q1’24 quarter-end weightings in the SPX, along with their enormous market capitalizations then. Market caps’ year-over-year changes are shown, revealing how those stocks performed for investors independent of manipulative stock buybacks.
Those have been off the charts for years, long fueled by the Fed’s previous zero-interest-rate policy and trillions of dollars of bond monetizations. Stock buybacks are deceptive financial engineering undertaken to artificially boost stock prices and earnings per share, maximizing executives’ huge compensation. Looking at market-cap changes rather than stock-price ones neutralizes some of buybacks’ distorting effects.
Next comes each of these big US stocks’ quarterly revenues, hard earnings under Generally Accepted Accounting Principles, stock buybacks, trailing-twelve-month price-to-earnings ratios, dividends paid, and operating cash flows generated in Q1’24 followed by their year-over-year changes. Fields are left blank if companies hadn’t reported that particular data as of mid-week, or if it doesn’t exist like negative P/E ratios.
Percentage changes are excluded if they aren’t meaningful, primarily when data shifted from positive to negative or vice-versa. Collectively these latest quarterly results from the leading US companies shed light on crucial questions. Are the US stock markets still fundamentally-sound enough to keep rallying on balance, or are they threatened with a major selloff? If the latter, is it likely to be a correction or new bear market?
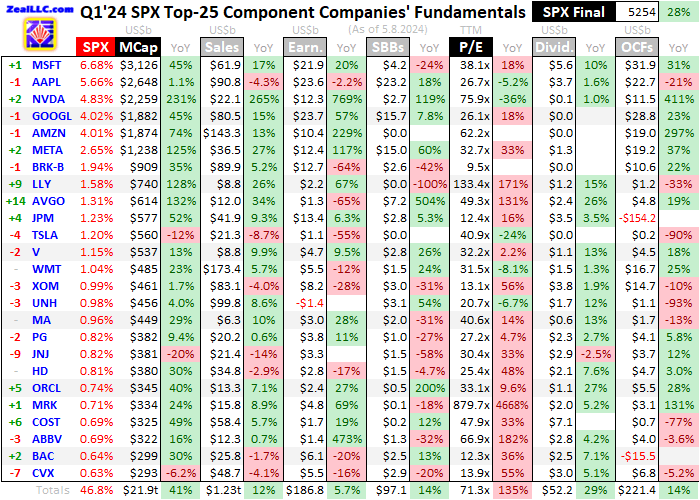
The US stock markets have grown increasingly top-heavy, which is a serious risk. Exiting Q1, the SPX’s 25 largest component stocks again represented 46.8% of its entire weighting! Dramatically soaring since the 34.8% in Q3’17 when I launched this deep quarterly research thread, that extreme concentration is troubling. The fewer stocks any bull market depends on to drive it, the more fragile and precarious it is.
These US stock markets are heavily reliant on the beloved Magnificent 7 mega-cap technology stocks. Together mighty Microsoft, Apple, NVIDIA, Alphabet, Amazon, Meta Platforms, and Tesla now account for a staggering 29.1% of the SPX’s total market cap! The Mag7’s gargantuan total $13,587b exceeded the total of the SPX’s bottom 403 components. These market darlings essentially are the US stock markets.
Their outperformance remains dramatic, with the Mag7’s market cap skyrocketing 50.6% over the year ending Q1’24! That almost doubled the entire S&P 500’s 27.9% gain, which means the vast majority of its other 493 stocks seriously underperformed. While these mega-cap-tech giants are fantastic American companies with amazing fundamentals, their stocks are still exceedingly overvalued as we will soon discuss...
* * *
Read Full Story »»»
DiscoverGold
CoT: Peek Into Future Through Futures, How Hedge Funds Are Positioned
By: Hedgopia | May 11, 2024
• Following futures positions of non-commercials are as of May 7, 2024.
E-mini S&P 500: Currently net short 9.7k, up 52.8k.

Equity bulls put up another week of strong show, with the S&P 500 rallying 1.9 percent to 5223. This was the third up week in a row. From the April 19th low of 4954 to Friday’s intraday high of 5240, the large cap index is up 5.8 percent, which just about offsets the 5.9-percent decline between last month’s low and the March 28th high of 5265. At Friday’s high, the index was less than 0.5 percent from the March peak.
Amidst this, signs of fatigue are showing up. Volume was anemic this week, and two of the five sessions ended in a doji. If non-commercials are to be believed, it will be a tough sled from here on. These traders, having switched to net long four weeks ago, are now net short e-mini S&P 500 futures.
Nasdaq (mini): Currently net long 4.4k, up 1.6k.

The Nasdaq 100 trudged higher 1.5 percent this week – its third consecutive up week. From the April 19th low of 16974 through Friday’s high of 18248, it rallied 7.5 percent. Before that, the tech-heavy index peaked at 18465 on March 21st, failing to sustainably break out of 18300s for seven weeks before rolling over; from that high through last month’s low, it swiftly gave back 8.1 percent.
Friday – a spinning top session – tech bulls could not quite muster strength enough to test 18300s. The index began the week with a rally past the 50-day on Monday, then struggled to keep up the momentum. The daily RSI is below 59. Ahead, bulls are likely to struggle to save the 50-day.
Russell 2000 mini-index: Currently net short 38k, down 2.3k.

Small-cap bulls Friday came close to testing 2100, but no cigar. This is an important level.
The Russell 2000 peaked in November 2021 at 2459, subsequently reaching 1641 in June 2022, which was successfully tested in October of both 2022 and 2023. A 61.8-percent Fibonacci retracement of that drop comes to 2144. The small cap index lost 2100 in January 2022 and has since found stiff resistance at that price point, which also represents a measured-move price target post-breakout at 1900 last December. Before that, the index went back and forth between 1700 and 1900 going back to January 2022.
A decisive takeout of 2100 can give the bulls a much-needed fillip. Until then, they need to defend 2000 and most definitely 1900.
US Dollar Index: Currently net long 1.9k, up 1.9k.

Last Friday, the 50-day (now 104.52) was successfully tested. Dollar bulls did build on that this week, but only slightly. The US dollar index rose 0.2 percent this week to 105.18, with an intra-week high of 105.64 on Thursday.
Last week, on May 1st, the index rallied as high as 106.38 but only to retreat. That was the fourth week in a row the index stalled just north of 106. So, for now, this is the area to beat as far as dollar bulls are concerned.
On the downside, breakout retest lies at 103-104, which goes back to December 2016 and was taken out four weeks ago; 104 also serves as trendline support from last December when the index bottomed at 100.32.
VIX: Currently net short 38.9k, up 16.4k.

Volatility bulls better step up soon. VIX is perilously close to horizontal support at 12.30s. The volatility index yielded 0.94 points this week to 12.55. It is now down three weeks in a row. Four weeks ago – on April 19th – it tagged 21.36 and reversed.
Having lost nearly nine points over three weeks, VIX is oversold – way oversold. The daily in particular can rally.
Read Full Story »»»
DiscoverGold
S&P 500 Index (SPX) »» Weekly Summary Analysis
By: Marty Armstrong | May 11, 2024
ECONOMIC CONFIDENCE MODEL CORRELATION
Here in S&P 500 Cash Index, we do find that this particular market has correlated with our Economic Confidence Model in the past. The Last turning point on the ECM cycle low to line up with this market was 2009 and 2002. The Last turning point on the ECM cycle high to line up with this market was 2022 and 2007 and 2000.
MARKET OVERVIEW
NEAR-TERM OUTLOOK
The S&P 500 Cash Index has continued to make new historical highs over the course of the rally from 1974 moving into 2024. Clearly, we have elected two Bullish Reversals to date.
This market remains in a positive position on the weekly to yearly levels of our indicating models. Pay attention to the Monthly level for any serious change in long-term trend ahead.
Looking at the indicating ranges on the Daily level in the S&P 500 Cash Index, this market remains moderately bullish currently with underlying support beginning at 518100 and overhead resistance forming above at 522481. The market is trading closer to the resistance level at this time. An opening above this level in the next session will imply that a bounce is unfolding.
On the weekly level, the last important high was established the week of March 25th at 526485, which was up 22 weeks from the low made back during the week of October 23rd. We have been generally trading up for the past 3 weeks from the low of the week of April 15th, which has been a move of 5.775%. When we look deeply into the underlying tone of this immediate market, we see it is currently still in a weak posture. Immediately, this decline from the last high established the week of March 25th has been important Before, this recent rally exceeded the previous high of 479330 made back during the week of December 25th. That high was likewise part of a bullish trend making higher highs over the week of October 16th. This immediate decline has thus far held the previous low formed at 410378 made the week of October 23rd. Only a break of that low would signal a technical reversal of fortune and of course we must watch the Bearish Reversals. Right now, the market is neutral on our weekly Momentum Models warning we have overhead resistance forming and support in the general vacinity of 510794. Additional support is to be found at 509114. Looking at this from a wider perspective, this market has been trading up for the past 18 weeks overall.
INTERMEDIATE-TERM OUTLOOK
YEARLY MOMENTUM MODEL INDICATOR
Our Momentum Models are rising at this time with the previous low made 2022 while the last high formed on 2023. However, this market has rallied in price with the last cyclical high formed on 2022 warning that this market remains strong at this time on a correlation perspective as it has moved higher with the Momentum Model.
Looking at the longer-term monthly level, we did see that the market has made a low following the previous high of March at 495356. The fact that the market for April close below the previous month's low is a sign of near-term weakness with a possible decline into the next turning point on the Array. So far here in May this market has held above last month's low reaching 501105.
Critical support still underlies this market at 438504 and a break of that level on a monthly closing basis would warn that a sustainable decline ahead becomes possible. Immediately, the market is trading within last month's trading range in a neutral position.
DiscoverGold
Nasdaq Composite Index (COMP) »» Weekly Summary Analysis
By: Marty Armstrong | May 11, 2024
This market made a new high today after the past 2 trading days. The market opened quite strong above the previous session's high 1636279 reaching 1643739 intraday. So far the market is still within a reactionary phase being up two trading days. Therefore, this market closed below the opening print while also closing down from the previous closing yet it was weak going into the close.
Immediately, we have not broken out and it still remains below our uptrend technical resistance projection which stands at 1658534.
Clearly, this market is still above the critical support point at this time, which lies at 1594781. Initial support lies at 1631229. This market has exceeded intraday 2 of three projected resistance points and it has closed below 2 others. Our underlying pivot providing some support lies at 1625890 and a close below this level will warn of a shift to retest support. Immediately, the projected extreme resistance stands at 1652642.
Additionally, our central point cyclical study models also ended in a bearish mode for the closing warning that the upward momentum is subsiding. Given the fact that we have made a new high and this study just turned down today, caution is advised that this may prove to be a temporary high and a break of today's low of 1629352 would tend to confirm that possibility. Furthermore, the short-term Stochastics have also signaled a possible crash is likely. During the last session, we did close above the previous session's Intraday Crash Mode support indicator which was 1605475 settling at 1634626. The current Crash Mode support for this session was 1616428 which we closed above at this time. The Intraday Crash indicator for the next session will be 1625890. Remember, opening below this number in the next session will warn that the market may enter an abrupt panic sell-off to the downside. Now we have been holding above this indicator in the current trading session, and it resides lower for the next session. If the market opens above this number and holds above it intraday, then we are consolidating. Prevailing above this session's low will be important to indicate the market is in fact holding. However, a break of this session's low of 1629352 and a closing below that will warn of a continued decline remains possible.
Intraday Projected Crash Mode Points
Today...... 1616428
Previous... 1605475
Tomorrow... 1625890
This market has not closed above the previous cyclical high of 1653886. Obviously, it is pushing against this resistance level.
ECONOMIC CONFIDENCE MODEL CORRELATION
Here in NASDAQ Composite Index Cash, we do find that this particular market has correlated with our Economic Confidence Model in the past. The Last turning point on the ECM cycle low to line up with this market was 2022 and 2009 and 2002. The Last turning point on the ECM cycle high to line up with this market was 2007 and 2000.
MARKET OVERVIEW
NEAR-TERM OUTLOOK
The NASDAQ Composite Index Cash has continued to make new historical highs over the course of the rally from 2009 moving into 2024. Noticeably, we have elected four Bullish Reversals to date.
This market remains in a positive position on the weekly to yearly levels of our indicating models. Pay attention to the Monthly level for any serious change in long-term trend ahead.
The perspective using the indicating ranges on the Daily level in the NASDAQ Composite Index Cash, this market remains moderately bullish currently with underlying support beginning at 1619786 and overhead resistance forming above at 1634818. The market is trading closer to the resistance level at this time. An opening above this level in the next session will imply that a bounce is unfolding.
On the weekly level, the last important high was established the week of March 18th at 1653886, which was up 21 weeks from the low made back during the week of October 23rd. We have been generally trading up for the past 3 weeks from the low of the week of April 15th, which has been a move of 7.978%. When we look deeply into the underlying tone of this immediate market, we see it is currently still in a weak posture. The broader perspective, this current rally into the week of March 18th has exceeded the previous high of 1515007 made back during the week of December 25th. This immediate decline has thus far held the previous low formed at 1254386 made the week of October 23rd. Only a break of that low would signal a technical reversal of fortune and of course we must watch the Bearish Reversals. Right now, the market is neutral on our weekly Momentum Models warning we have overhead resistance forming and support in the general vacinity of 1609202. Additional support is to be found at 1592591. Looking at this from a wider perspective, this market has been trading up for the past 18 weeks overall.
INTERMEDIATE-TERM OUTLOOK
YEARLY MOMENTUM MODEL INDICATOR
Our Momentum Models are rising at this time with the previous low made 2022 while the last high formed on 2023. However, this market has rallied in price with the last cyclical high formed on 2021 warning that this market remains strong at this time on a correlation perspective as it has moved higher with the Momentum Model.
Looking at the longer-term monthly level, we did see that the market has made a low following the previous high of March at 1522278. The fact that the market for April close below the previous month's low is a sign of near-term weakness with a possible decline into the next turning point on the Array. So far here in May this market has held above last month's low reaching 1555764.
Critical support still underlies this market at 1405840 and a break of that level on a monthly closing basis would warn that a sustainable decline ahead becomes possible. Immediately, the market is trading within last month's trading range in a neutral position.
DiscoverGold
Will The Fed Cut Rates in June?
By: Marty Armstrong | May 11, 2024
Right on schedule, Consumer Sentiment has turned down in early May to a six-month low. With all this talk of war, people will naturally pull back and spend less with uncertainty on the future horizon. Interest rates have not declined because of stubborn inflation and the job market, which undermines consumer confidence. Based on recent surveys, consumers expect prices to rise at an annual rate of 3.5% over the next year, up from 3.2% in April.
Our model indicates that as the Neocons wage their endless wars, the economy will turn down, further complicating the upcoming elections. Normally, the Fed should cut the rate as we enter recession in its June meeting. However, as we can see, while we have a Directional Change for the 3rd Quarter, the trend appears that it would still rise thereafter into the 3rd quarter of 2025 due to war. The only potential pressure the Fed might endure is the June 9th EU elections. However, the next meeting will be too late - June 11-12.
When we turn to the Weekly Array of the 10/2yr spread, the computer already targets the week of the next Fed Meeting. It appears that the Fed should cut the rate slightly with the economy moving into recession. But that may be a one-time event when we look at the prospects of war after that, which are always inflationary.
DiscoverGold
|
Followers
|
179
|
Posters
|
|
|
Posts (Today)
|
0
|
Posts (Total)
|
68116
|
|
Created
|
06/10/03
|
Type
|
Free
|
| Moderators DiscoverGold | |||
:::::::::::: Welcome to S&P 500 & Nasdaq Analysis and Trends :::::::::::::
• The purpose of this board is to help others with Short & Long term S&P 500 & Nasdaq analysis and direction.
• This is strickly an educational board helping traders to learn market direction, swing and bottom trading.
• I ask that everyone respect opinions on the board whether you agree with them or not. We are all here to make money and avoid the
minimum loss we can.
Rules of the Board
Most of this board's WATCHERS are "lurkers" who appreciate info available without the need to sift through tons of "empty" posts.
1. Respect everyone opinions on trades.
2. No Pumping of Stocks.
3. No OTCBB or PINK STOCKS
*********************************************************************************************************
To help us evaluate our performance, please "BoardMark" the board if you find it useful.
To do so, just click on "Add to Favorites" Button at Right just above the Posts Dates.
 Presently, the Board has 179 Boardmarks, Thank you!
*Information Posted on this Board is not Meant to Suggest any Specific Action, But to Point Out the Technical Signs That Can Help Our Readers Make Their Own Specific Decisions. Your Due Deligence is a Must.
EXCHANGE TRADED FUNDS~ETFs COMPONENTS~RSI and I/V charts#msg-5495097 COMPONENTSFOR ^NDX / QQQQ ~ I/V charts #msg-9787995
Gold~ Silver~ HUI~ XAU~ US$~ €uro~ Crude #msg-29347660 (thanks,bob)
Cookies/Bandwidth/Security/Privacy #msg-9353921 PIEs/Cookies/Macromedia/Flash #msg-9412363 PerformanceTips for WinXP #msg-9854670
| Volume | |
| Day Range: | |
| Bid Price | |
| Ask Price | |
| Last Trade Time: |


