Register for free to join our community of investors and share your ideas. You will also get access to streaming quotes, interactive charts, trades, portfolio, live options flow and more tools.
very good chance.
NY Gold Futures »» Weekly Summary Analysis
By: Marty Armstrong | June 18, 2022
This market made a new high today after the past 3 trading days. The market opened higher and closed lower. The immediate trading pattern in this market has exceeded the previous session's high intraday reaching 186150. Therefore, this market closed below the opening print while also closing down from the previous closing yet it was weak going into the close.
One indicator typical technicians follow is the 200 day moving average which the market has just moved back above 1 day ago. That number rested today at 184288. Historically, this indicator is more broad-term in what it reveals. It can flip back to negative after a few days.
Clearly, this market has broken under the former broader cyclical support which now resides above the market at 184711 rendering it vulnerable to a further decline at this time. The market just crossed that cyclical support during the previous session.
During the last session, we did close above the previous session's Intraday Crash Mode support indicator which was 177135 settling at 184990. The current Crash Mode support for this session was 179424 which we closed above at this time. The Intraday Crash indicator for the next session will be 182450. Remember, opening below this number in the next session will warn that the market may enter an abrupt panic sell-off to the downside. Now we have been holding above this indicator in the current trading session, and it resides lower for the next session. If the market opens above this number and holds above it intraday, then we are consolidating. Prevailing above this session's low will be important to indicate the market is in fact holding. However, a break of this session's low of 183610 and a closing below that will warn of a continued decline remains possible. The Secondary Intraday Crash Mode support lies at 178930 which we are trading above at this time. A breach of this level with a closing below will signal a sharp decline is possible.
Intraday Projected Crash Mode Points
Today...... 179424
Previous... 177135
Tomorrow... 182450
This market has not closed above the previous cyclical high of 188250. Obviously, it is pushing against this resistance level.
ECONOMIC CONFIDENCE MODEL CORRELATION
Here in NY Gold Futures, we do find that this particular market has correlated with our Economic Confidence Model in the past. The Last turning point on the ECM cycle low to line up with this market was 2015. The Last turning point on the ECM cycle high to line up with this market was 2020 and 2011 and 1996.
MARKET OVERVIEW
NEAR-TERM OUTLOOK
The historical perspective in the NY Gold Futures included a rally from 2015 moving into a major high for 2020, the market has been consolidating since the major high with the last significant reaction low established back in 2015. The market is still holding above last year's low. The last Yearly Reversal to be elected was a Bullish at the close of 2020.
This market remains in a positive position on the weekly to yearly levels of our indicating models.
From a perspective using the indicating ranges on the Daily level in the NY Gold Futures, this market remains moderately bullish currently with underlying support beginning at 183760 and overhead resistance forming above at 185880. The market is trading closer to the support level at this time.
On the weekly level, the last important high was established the week of June 13th at 188250, which was up 4 weeks from the low made back during the week of May 16th. So far, this week is trading within last week's range of 188250 to 180610. Nevertheless, the market is still trading downward more toward support than resistance. A closing beneath last week's low would be a technical signal for a correction to retest support.
Looking at this from a broader perspective, this last rally into the week of June 13th reaching 188250 failed to exceed the previous high of 200300 made back during the week of April 18th. That rally amounted to only four weeks. Right now, the market is neutral on our weekly Momentum Models warning we have overhead resistance forming and support in the general vacinity of 183630. Additional support is to be found at 179720. Looking at this from a wider perspective, this market has been trading up for the past 11 weeks overall.
INTERMEDIATE-TERM OUTLOOK
YEARLY MOMENTUM MODEL INDICATOR
Our Momentum Models are declining at this time with the previous high made 2020 while the last low formed on 2021. However, this market has rallied in price with the last cyclical high formed on 2020 and thus we have a divergence warning that this market is starting to run out of strength on the upside.
Critical support still underlies this market at 175200 and a break of that level on a monthly closing basis would warn that a sustainable decline ahead becomes possible. Immediately, the market is trading within last month's trading range in a neutral position.
 DiscoverGold
 COT - Commitments of Traders in Metals Futures Market Reports
By: Software North | June 17, 2022
Gold

Silver

Read Full Story »»»
 DiscoverGold
Gold Stocks: Double Bottom Launchpads
By: Morris Hubbartt | June 17, 2022
Super Force Signals (SFS) is being rebranded as Super Gold Signals (SGS at https://supergoldsignals.com), to reflect the growing global importance of gold.
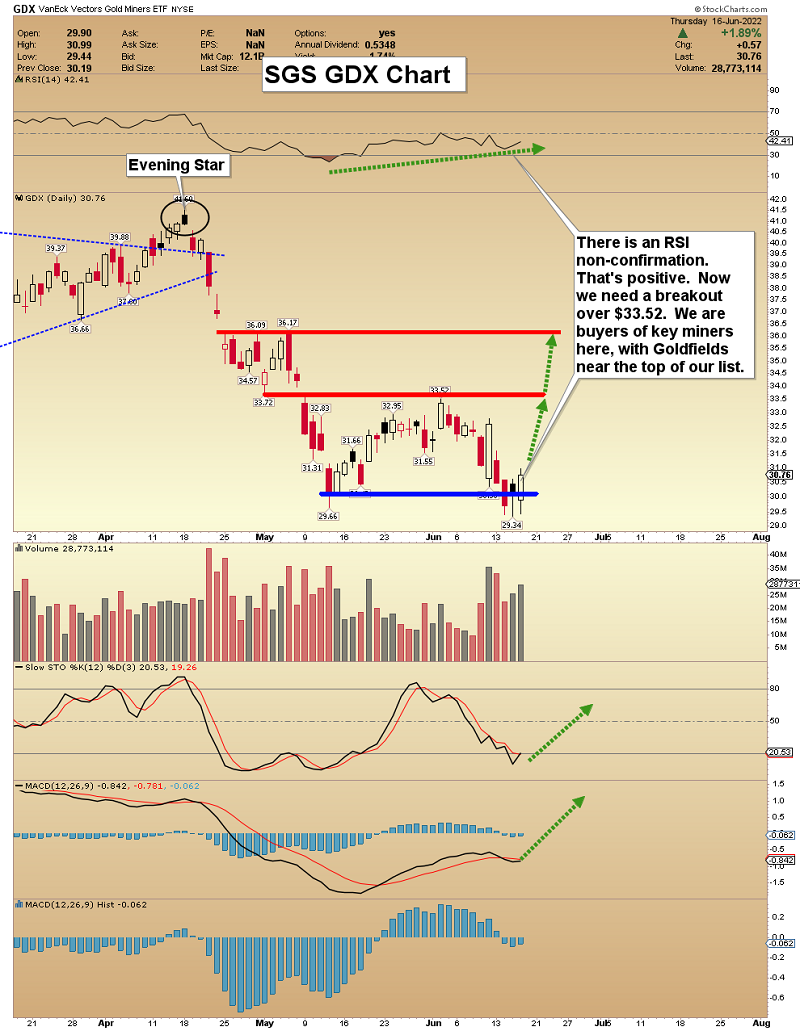
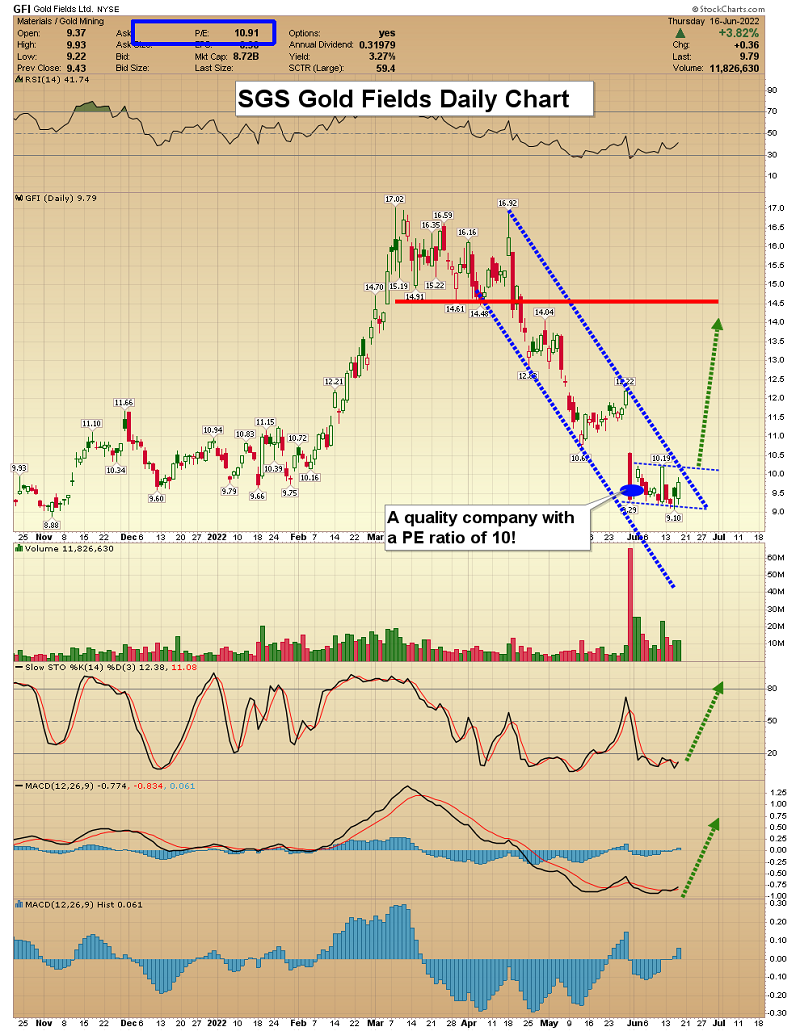
I cover the senior miners, commodities, and the Dow in my flagship SGS newsletter. A Fed Funds rate at 1.6% is not going to stop inflation that is somewhere between 8% and 15%. The war in Ukraine is a quagmire and tension is high going into our US election. There is opportunity for investors! At $249 a year, subscribers love the SGS value. I'm offering an inflation special of a full 14 months for just $199. Send me an email if you want the offer and I'll get you onboard. Thanks!
SG60 Key Charts, Signals, & Video Analysis
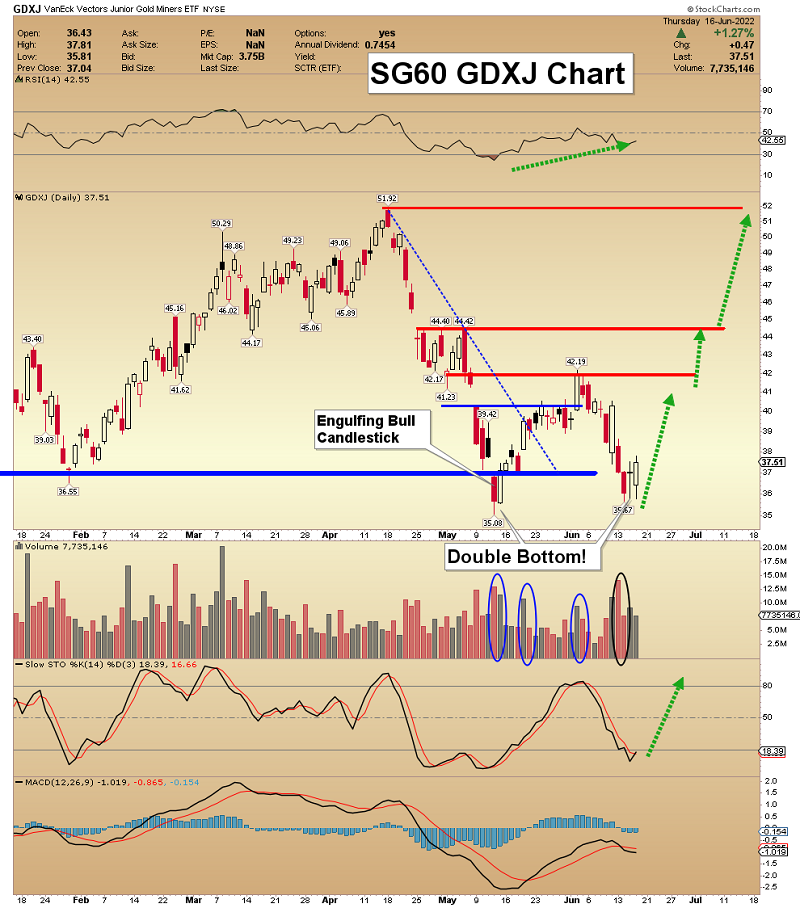
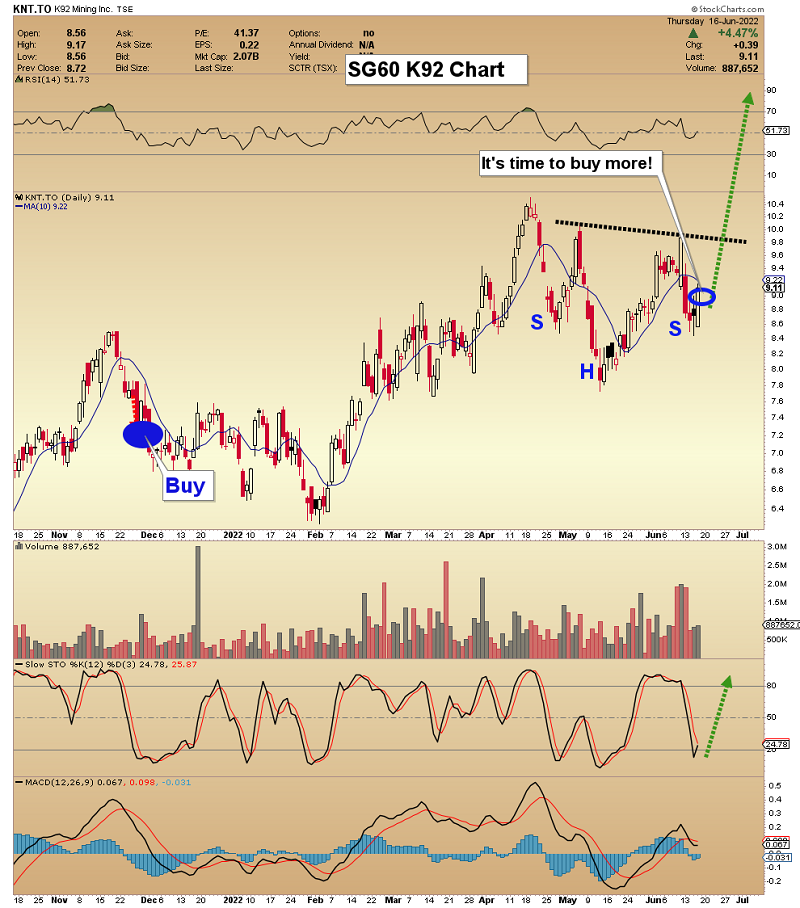
SGT Key Charts, Signals, & Video Analysis
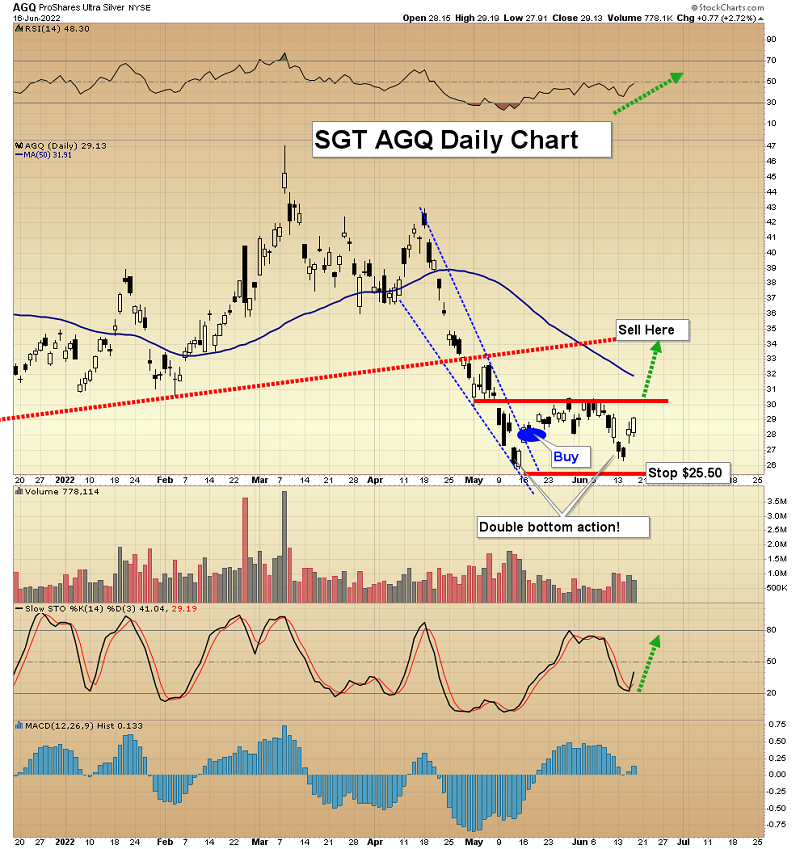
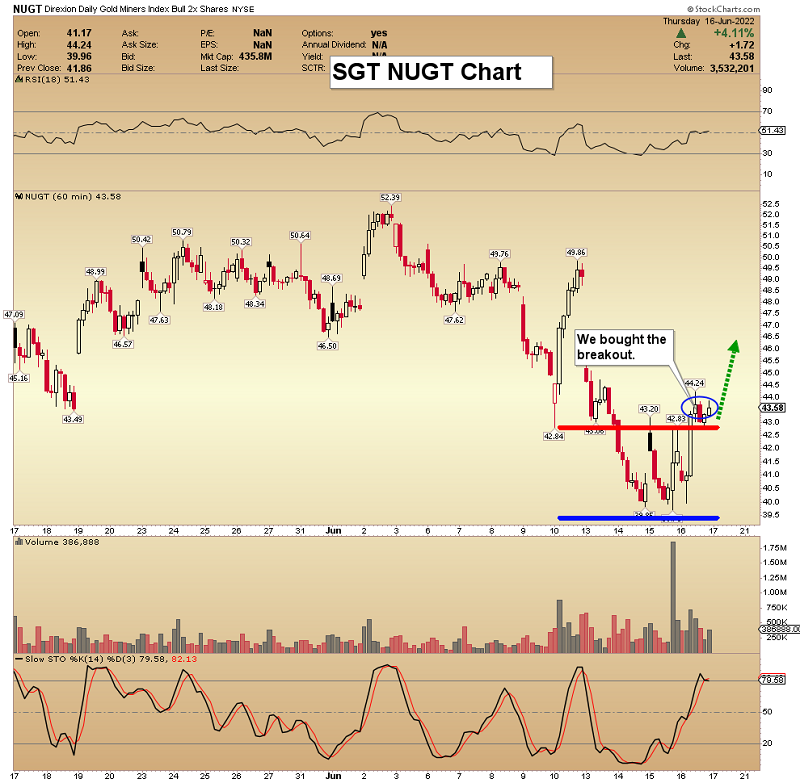
SGJ Key Charts, Signals, & Video Analysis
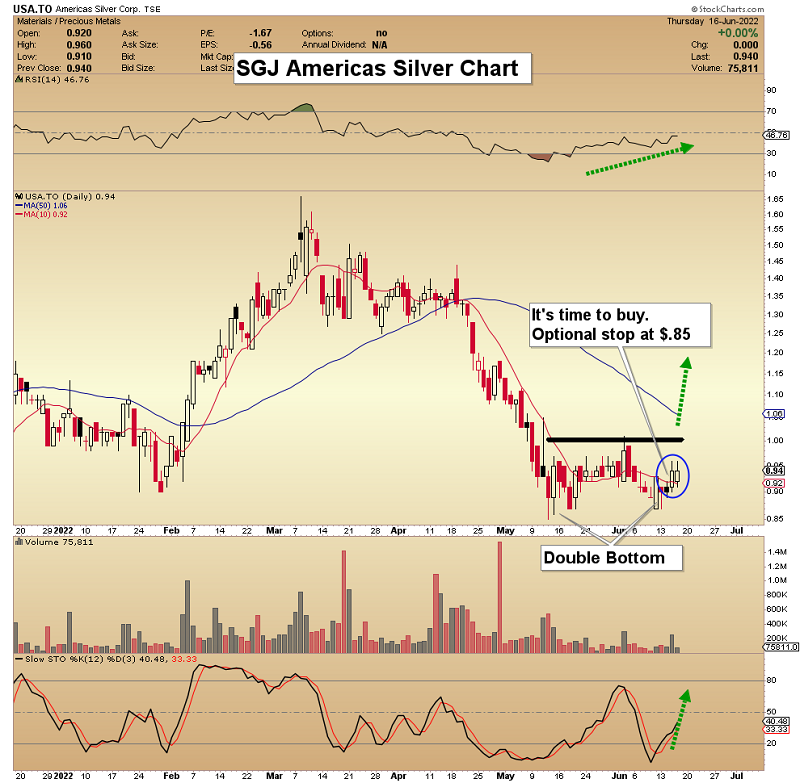
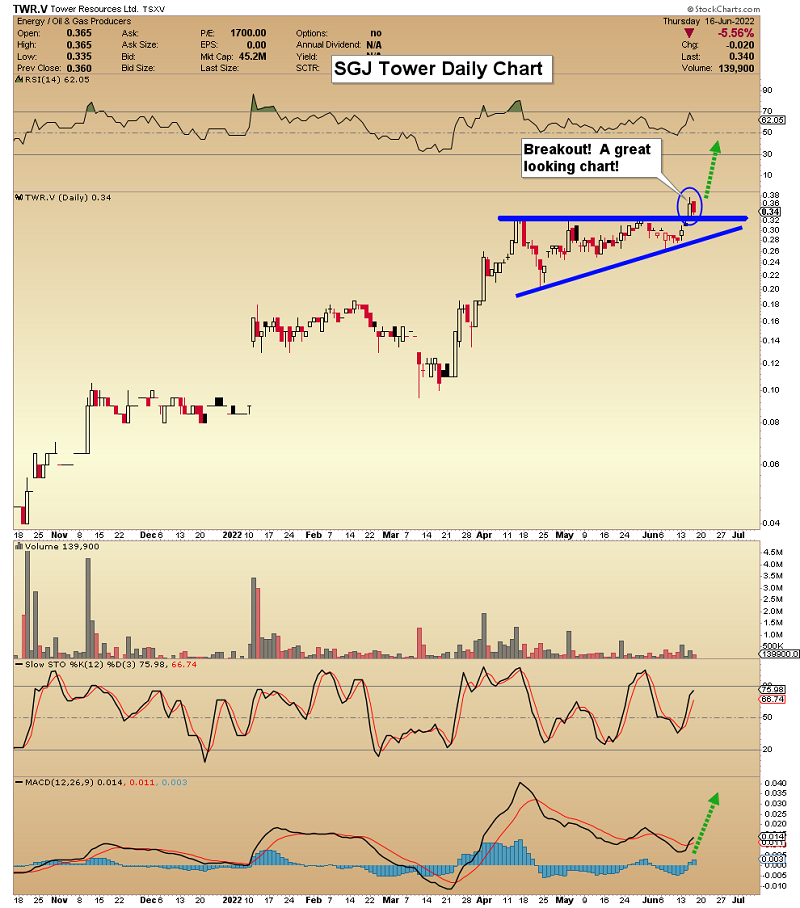
Read Full Story »»»
 DiscoverGold
It’s actually marching to the beat of the feds bots, or traders, or both. I can prove it. Just watching to see it break.
expectations now are dummied down so obscenely low. Even this guy prices things too conservatively.....gold is the next bitcoin and it will be, you will see. The electronic nonsense is basically over.
from Yahoo
Philip
yesterday
May I draw your attention to something . Let's take the chart of GDX ! Take the max duration . You can see that in the years 2006 , 2007 ...GDX was valued at 40 usd !! That was the time gold price was at 700 usd and the miners had a lot of debt , in 2006 miners took 150 usd profit per ounce ! Now in 2022 , gold price is at 1835 usd , the profit per ounce for miners is 735 usd (the aisc is 1100 usd for the average gold miner) and .....GDX is at ...30 usd !!!?? The gold miners are still incredibly undervalued and the upward potential is huge ! Conclusion ...a GDX price as in 2006 around 40 usd would be fair and even not expensive ! Maybe young people , who weren't investors in 2006 , should study history about commodities in general and certainly about gold ! Buy GDX now at 30-35 usd and do nothing ...just wait 3 years !
"Rah Rah, Go Team go!
this is her screen hollywood debut, an incredible woman, everything she did, so talented...died young of cancer.
big fan.
could play any role, to contrast, see her in the Omen as a mature woman, to take just one example.
Rah Rah Mama Guitar. \
a brilliant culture, the greatest the world has ever know, greater by far than the Greeks in the 5th and 4th century, in the age of Themistocles ...way way back there in second place.
but your central observation is correct: gold and the miners are not acting "hoppy" or jumpy; actually quite the reverse, but this has been going on now for 1.5 years give or take.
It won't stay that way much longer...weeks a few months.
-yea....sometimes in a crazy world, the one eyed man is king. I have made millions in the market, lost millions and have never had a big score as a momentum guy, going with the herd, and I outperform 99 percent of the fund managers in america.
Although the market is crooked and short term irrational, it cannot stay that way. Over time, it is a perfect predator.
I’m still holding to my 2400 in 2022.
downside is 20 bucks, the upside is $2,000 over the next 2.5 years.....do you really want to cut it that close, can you do that?
GDX could go to 28.50 at the bottom, but $285 in 3 years in a perfect gold world, We are gonna have that Internut stock, Bitcoin moment.
The market is always looking for the hot chick the cool idea where you can make 5X or more of your money.
The fundamentals suggest that gold's moment is approaching and it will be a stealth move...in 2 months, gold will be at $1,950 and everybody will be a skeptic. So what they will say, it will just go back down.
despite the obvious fundamentals.
and when it breaks $2000 by the end of September, people will say, hey it is doing pretty good but who knows, and that will be 5% of the investor types in America, the other 95% will be asleep at the wheel.
Americans hate gold for a variety of reasons, this will change.
but they are at this price of gold a rock solid value play here. The major component companies of the GDX are in terrific shape balance sheet wise. We get our little one day pullback due to the rate increase and as you say, the flying monkey people hitting gold. They are dead meat from my perspective. It is frustrating, but their position is ridiculous, The other countries of the world are buying gold like crazy, as the slow transition away from the dollar begins here, soon enough. Buy them now at the Armageddon low...
the mob will come in when the see "action." The mob in america are not value buyers.....the funds would rather buy gdx at 40 than at 30, because then, they reason, GDX is in an "uptrend."
PR is a futures trader and could not be more wrong.....saying that gold today and miners in particular are the same as 2012 is laughbable.
In 2012, a stock like barrick, for instance, had a PE of close to 50, and a market cap of 20 billion and net debt of 20 billion.. (all of the miners back then, those few making money, had PEs of 40 to 55)...that was a bubble high and all of the big cap Miners were like that, and GDXJ was over 150 and its smaller components were priced like 1999 internet stocks......, back then all of the miners had ridiculous bloated balance sheets and very few of the big ones were earning any money.
Today barrick gold, to take a typical example of a large cap, has perhaps 5 billion in debt, but is NET DEBT positive, Barrick has a PE of 18 per yahoo and will make well over a billion net earnings this year.....where in 2012 it had over 20 billion in debt and was barely breaking even....Barrick might have had 700 million in cash but owed 20 billion plus...and was making no money. Today 5 billion in debt, making over a billion per year, in truth at least 1.5 in net earnings, and a PE of 18
the Author is completely out of his mind, and he is a short btw, a futures trader for many years now.;
Barrick is just one of so many, but they will make 1.5 billion with every hundred dollar increase in the POG...all the major components of the GDX are poised to rocket higher.
And gold back then had just finished a massive 10 year bull run, having gone from 265 bucks at the low to about 1900 when it broke in 2011, ....and since that time entered a bear and is now consolidating amidst absurd radical government corruption money printing. America alone owes 200 TRILLION IN UNFUNDED LIABILITIES..
Bottom at 1820?
No Rosy Future Lies Ahead Gold Miners in the Stock World
By: Przemyslaw Radomski | June 17, 2022
Here Comes the Replay
Let’s not forget about the forest while looking at individual trees. By that, I mean looking at how gold stocks perform relative to gold. That’s one of the major indications that the current situation is just like what we saw at the 2012 top.

The situation in the gold stock to gold ratio is similar to what we saw in late 2012 and early 2013. The HUI to gold ratio invalidated its first attempt to break lower (marked with red, dashed lines), but after a corrective upswing, it then broke lower more decisively. That’s what I marked using black, dashed lines.
If the history is to rhyme, we’re about to see a profound decline.
Also, please note that the pattern that we currently see, which started in early 2016, is somewhat similar to what happened between 2003 and 2008.
Back in 2008, the breakdown from the consolidation resulted in sharply lower ratio values and much lower prices of gold stocks.
So, if the situation is analogous to 2012-2013, we’re likely to see a big decline in the following weeks/months, and if it’s analogous to 2008, we’re likely to see an enormous decline in the following weeks/months.
Declining stock prices would only add fuel to the bearish fire (after all, gold stocks are… stocks) and that’s exactly what’s likely to happen.

The Bearish Outlook for Precious Metals
The technical picture in the case of world stocks remains extremely bearish, and my previous comments on it were just confirmed. Here’s what I’ve been writing about the above chart for quite a few weeks now:
World stocks have already begun their decline, and based on the analogy to the previous invalidations, the decline is not likely to be small. In fact, it’s likely to be huge.
For context, I explained the ominous implications on Nov. 30. I wrote:
Something truly epic is happening in this chart. Namely, world stocks tried to soar above their 2007 high they managed to do so, and… failed to hold the ground. Despite a few attempts, the breakout was invalidated. Given that there were a few attempts and that the previous high was the all-time high (so it doesn’t get more important than that), the invalidation is a truly critical development.
It’s a strong sell signal for the medium – and quite possibly for the long term.
From our – precious metals investors’ and traders’ – point of view, this is also of critical importance. All previous important invalidations of breakouts in world stocks were followed by massive declines in mining stocks (represented by the XAU Index).
Two of the four similar cases are the 2008 and 2020 declines. In all cases, the declines were huge, and the only reason why they appear “moderate” in the lower part of the above chart is that it has a “linear” and not a “logarithmic” scale. You probably still remember how significant and painful (if you were long, that is) the decline at the beginning of 2020 was.
Now, all those invalidations triggered big declines in the mining stocks, and we have “the mother of all stock market invalidations” at the moment, so the implications are not only bearish, but extremely bearish.
World stocks have declined below their recent highs, and when something similar happened in 2008, it meant that both stocks and gold and silver mining stocks (lower part of the chart) were about to slide much further.
The medium-term implications for mining stocks are extremely bearish.
Let’s take a look at the U.S. stock market.

Stocks verified their breakdown below the Q1 2022 low and then they declined. They broke below the May low, and they corrected a bit after the rate hike announcement, but they didn’t invalidate the breakdown. This means that the breakdown is almost fully confirmed.
The S&P 500 is unlikely to fall below 3,700 this week due to specific positioning in the options market, but it may do so next week.. At the time of writing these words, the S&P 500 futures are trading at around 3,704.
A weekly close below the May lows would be a very bearish indication for the following days and weeks, and as investors have more time to digest this critical information, their willingness to sell in the following week would likely grow.
The implications for the precious metals market, especially for silver and mining stocks, are very bearish.
Read Full Story »»»
 DiscoverGold
Gold tamped down to 1840.
2 things are still very clear. Gold is directed where to go, and miners are no where near a run. They are very much tied to gold no matter the markets or their profits.
Spot at 1843, with Fed bots in charge that makes sense. Especially with quad witching today. Fed afraid gold will seek its value while they load up on physical.
great charts. They present an argument for vastly higher prices soon.
how can gdx not be a buy now, a a measly 30 and change?
these companies look like powerhouses to me, and these western governments are scams and so too their currencies.
I bought in very heavy yesterday a.m.....talk about being a glutton for punishment. I feel like a kid is throwing a rubber ball at a school wall and I am the ball. Here's to swimming with bowlleged women.
Former ceo of GG McEwen had a nice interview with lovely Michele and he says gold will be 5,000 bucks u.s. in 2 or 3 years.
he said people have to get into a preserve what they've got mind set. I agree. This guy is no dummy. He built GG into a 15 billion dollar powerhouse before it was acquired. Made ever call.
If gold is even 3500 bucks in 2 years than GDX will 200 bucks a share. easily. we are talking a bitcoin like move higher. GDX will be the hot chick. I wouldn't mind riding a 30 dollar item up to `300 smackers.
https://www.kitco.com/news/video/show/PDAC-2022/4066/2022-06-14/The-Feds-tightening-wont-cure-inflation-Why-gold-will-reach-$5K-in-two-to-three-years---Rob-McEwen
4 Charts that Reveal the Once-in-a-Lifetime Opportunity in Gold Stocks
By: the daily gold | June 16, 2022
If you are bullish on Gold and would like to know about little-known opportunities to make 185% or more, please pay close attention.
Thanks to a combination of historically low valuations, strengthening fundamentals, and the most inflationary monetary and fiscal policy over the past 100 years, we are looking at a once-in-a-lifetime opportunity to make record profits over the next few years.
I am not talking about buying physical Gold or Silver.
And I am not talking about buying gold indexes or senior mining stocks either.
Rather, I am talking about junior miners... small gold operations that can double, triple, even quadruple in price in a short period of time.
For example, one junior gold producer rocketed 317% in 18 months.
A junior exploration company shot up 155% in just 2 months.
And a little-known nano-cap silver junior surged 300% in 10 months.
Premium subscribers had a chance to earn these gains.
Thanks to the correction in the market, the best part is that the opportunities to profit over the next 12 to 24 months could be even better.
Here’s why...
First of all, the timing could not be better.
Gold performs best when stocks are in a secular bear market, and expected future returns from stocks and bonds are historically low.
Gold’s performance in recent years was limited by conventional stocks being in a secular bull market.
However, the secular bull market in stocks is likely over, and the current expected returns from a conventional 60/40 portfolio (60% stocks, 40% bonds) are near their lowest in history.
Hence, Gold is finally in a position to start what should be at least a decade-long bull market. Gold gained 2300% and 650% in its previous two secular bull markets.

Next, consider that Gold has formed one of the most bullish patterns possible, known as a “cup and handle pattern.”
When Gold can break above $2,100/oz, this pattern will trigger a measured upside target of $3,000/oz and a logarithmic target as high as $4,100/oz.
Historically, Gold has made three significant multi-year breakouts. The coming breakout will be the fourth.

Next, look at the Gold price required to back the US monetary base. This is calculated based on the fluctuations in the Gold price, the monetary base, and US gold reserves.
Note that the two historic peaks in the Gold price (in the 1930s and end of the 1970s) occurred at 100% backing of the monetary base. Gold would have to reach $24,000/oz for that today!
During the financial crisis in 2008, Gold reached a 30% backing of the US monetary base. For 30% backing today, Gold would need to rise to $7,250/oz.

Finally, the gold stocks remain extremely cheap on a historical basis.
In the chart below, we plot a historical gold stock index against the S&P 500. In addition, we plot the CAPE valuation metric (for the stock market) at the bottom.
Note, when the CAPE ratio is historically high, as it is now, the gold stocks can massively outperform the stock market over the years ahead.

Let’s recap.
Gold stocks have moved off their historic lows but remain extremely cheap on a historical basis. Moreover, the only other points in history when they were this cheap (the 1960s and 2000) delivered spectacular returns over the next ten years.
Meanwhile, Gold is in position for its fourth major breakout of the last 40 years and has a measured upside target of $3,000/oz and a logarithmic target of $4,100/oz.
Furthermore, Gold would have to gain roughly 300% to attain, relative to the monetary base, where it was in 2008.
In short, the setup for Gold and gold stocks over the next few years is one of the best ever. They are poised to move much higher, but my focus is on the junior mining sector, where select companies could rise 5-fold, 7-fold, or even 10-fold over the next 24 months!
Read Full Story »»»
 DiscoverGold
someone must have heard me, lol, right after they took it to 1858. sorry boys, the fed bots rule, and they said 1850. which is where it is right now again. now i need to look into the matrix, is what i call it, and see where its going next. lol
Bots say no to spot gold above 1850. Just happened to notice fresh signals.
The Ord Oracle: GDX Update
By: Tim Ord | June 15, 2022
SPX Monitoring Purposes: Long SPX on 5/31/22 at 4151.09.
Monitoring Purposes GOLD: Long GDX on 10/9/20 at 40.78.
Long Term SPX Monitor Purposes: Neutral.

Today, the GDX tested the previous low of May 20 on lighter volume suggesting support. Yesterday, we noted "the FOMC meeting announcement is this Wednesday and market could wait for the reversal until then. Market bottoms form on panic and we have panic in the TRIN, TICK, VVIX and VIX. It would be a worrisome sign if panic was not present. Its important to remember the higher degree of panic, the stronger the degree of the next rally."
Tim Ord,
Editor
Read Full Story »»»
 DiscoverGold
Gold Stocks That Might Be Worth A Look As Inflation Continues To Run Hot:
By: Schaeffer's Investment Research | June 15, 2022
• Where might gold prices go in 2022?
Inflation continues to run hot, and with the fed behind the curve, economists believe it will take some time before we hit peak inflation. Therefore, it's essential to have stocks in your portfolio that are a hedge against the current inflationary environment. One of the ways you can do that is through gold miners. In addition to being a hedge against inflation, gold is also a hedge against volatility.
WHERE MIGHT GOLD PRICES GO IN 2022?
A rise in recycling and production meant gold supply increased by 4% in Q1 of 2022; total gold production for the year is expected to come in around 3800 tonnes. Meanwhile, gold demand in Q1 of 2022 was up 34% Y-o-Y primarily due to an increase in ETF flows, along with ETF's global jewelry demand has also been putting pressure on gold prices. Demand for the year is expected to remain robust and may come anywhere from 4500-5000 tonnes. Although, gold prices have remained flat, and gold currently trades anywhere between $1800-1900 per ounce, the difference in demand and supply and the backdrop of inflation, could increase the prices anywhere from $2000-2300 per ounce, which would translate into an increase of anywhere from 10-25% for the year. Such an increase would be very positive for gold stocks as realized price per ounce increases, along with production. As a result, the combination should help bring in record levels of cash flow for gold miners.
RISKS TO GOLD
Gold has continued to trade sideways for a while now. While inflation is not going away in the near future, the deflationary effects of monetary policy could weigh on gold prices as quantitative tightening sucks the liquidity out of the market. Furthermore, demand for jewelry and other conspicuous consumption of gold could fall in demand well. Demand and supply dynamics and liquidity will remain the two significant factors to consider.
Consider the following two stocks:
Kinross Gold (NYSE: KGC) is one of the most prominent gold miners. The company is based out of Toronto, Canada and has operations in the United States, along with Russia, Brazil, Chile, and Ghana.
Kinross gold underperformed in the first quarter, as production fell. But, during the next three quarters, management expects that company is likely to ramp up production to historical levels. The first quarter production came in around 410,000 ounces of gold, down from the Q1 2021. This was mainly due to operational realignment at their U.S. sites. Kinross expects that as the quarters proceed, production should normalize, and has projected that it should produce 2.15 million ounces for the year; that number could rise by a further 5% as production continues to ramp up.
The all-in expense per ounce of gold came in at $1214 for the quarter, and with a lower cost of sales, it could fall below $1200 for the year. Free-cash flow for the quarter ex one-time costs came in at $155 million. Meanwhile, free cash flow for the coming quarter should significantly increase as those capital expenditure costs reduce. The increase in cash flow should help improve the stock’s fortunes.
Currently, the stock trades at a price-to-earnings (P/E) ratio of 35x, but as production ramps up, and if the price of gold increases, the forward P/E could fall to 12-13x earnings, which would make the stock relatively cheap compared to the broader market.
Royal Gold (NASDAQ: RGLD) continued to beat expectations as it ramped up production for the first quarter. The company acquires and manages precious metal streams, royalties, and related interests. It has interests in 187 properties, including 41 mines that produce primarily gold but also silver, nickel, cobalt, and zinc.
Management expects to produce around 315,000-340,000 gold equivalent ounces (GEO) and has projected a realized price of $1800 per GEO ounce. Total revenue is expected to come in slightly higher for the year if the realized price remains around $1800, but if the price of gold increases, annual revenue could increase by a further around 15%. Meanwhile, earnings are expected to increase anywhere from 10-20% for the year as the lower all-in cost of production improves the bottom line. Furthermore, royalty streams should increase as crucial mining operations return online, increasing output during the next few quarters. Operations from their Botswana mine are also expected to go online, which should help increase revenue from the stream side of the business.
Guidance is currently quite conservative and considering that production is expected to continue to increase, revenue could come in much higher, which mean forward P/E could fall to around 15x earnings, and would make the valuation a lot more attractive than it is now.
It should be noted multiple analysts have recently upgraded the stock to a “buy”.
Read Full Story »»»
 DiscoverGold
$GDX - Apparently the 75 bps hike has changed everything and the May low was taken out today
By: CyclesFan | June 14, 2022
• $GDX - Apparently the 75 bps hike has changed everything and the May low was taken out today. Since the daily cycle is only on day 22 and the low won't happen earlier than June 24, the yearly cycle low from September at 28.83 is also in danger of being taken out.

Read Full Story »»»
 DiscoverGold
Gold Stocks: Is the Gold Pullback Over?
By: MotleyFool | June 14, 2022
NEW YORK (June 14) Gold stocks bounced on Friday after a multi-week downturn that followed the decline of the price of gold. Investors who missed the rally earlier this year are wondering if gold stocks are undervalued and now a buy.
Gold price
The price of gold bounced in recent days after the U.S. inflation report for May showed a continued rise in prices. Inflation in the United States hit a 40-year high of 8.6% on a year-over-year comparison for the month of May. Markets had expected to see an indication that the upward momentum in the cost of living had peaked in April. That’s not the case and there is now concern that June or July won’t be the peak, either.
Bargain hunters moved into gold on the news, pushing the price of the yellow metal up to US$1,875. Gold has actually been trending higher for a month after dropping to less than US$1,810 on May 12 after the surge above US$2,000 that occurred in early March.
Gold is widely considered to be a decent hedge against inflation, especially for holders of currencies that tend to slide in value against the American dollar. The precious metal is priced in the American currency.
On the other side of the currency impact, a rising dollar can sometimes put pressure on the price of gold. That hasn’t been the case of late. Interestingly, the high inflation number lifted the value of the Dollar Index to a one-month high, so gold is seeing strength, despite the dollar tailwind.
This could indicate funds are moving back into the gold trade at a strong pace, despite the higher cost for non-dollar buyers. One reason might be the weakness in cryptocurrencies. Bitcoin is at its lowest price in more than a year, dropping below US$28,000 and way below the November peak of US$67,000. If the crypto crash picks up steam, gold could catch a new tailwind.
Gold is also viewed as a safe-haven asset. Demand on this front can offset currency effects. The Dollar Index has been on an upward trend for the past two years, while gold has traded in a range roughly between US$1,700 and US$2,050 per ounce.
Gold stocks
Gold stocks bounced last week but remain significantly below their 2022 highs. Barrick Gold (TSX:ABX) (NYSE:GOLD), for example, trades near $27 per share on the TSX at the time of writing. That’s up about 13% year to date but still down from the $33.50 it hit a few months ago.
Gold companies have done a good job of shoring up their balance sheets in recent years and are driving efficiency into their operations. Barrick Gold has zero net debt after a multi-year turnaround effort that saw the company sell non-core assets and eliminate a debt burden that was as high as US$13 billion.
Management is focused on delivering high returns on the remaining assets and generating strong free cash flow for investors. Barrick Gold raised the dividend by 11% for 2022 and implemented a dividend bonus program that pays investors up to an extra US$0.15 per share per quarter on top of the US$0.10 base dividend depending on the net cash position at the end of the three months. The Q1 2022 bonus is US$0.10 per share.
Should you buy gold stocks now?
Volatility in the gold market should be expected, but stocks such as Barrick Gold appear undervalued and could deliver strong capital gains through the end of the year. If you are a gold bull and are of the opinion that gold will move back to US$2,000 per ounce, Barrick Gold and its peers deserve to be on your radar.
Read Full Story »»»
 DiscoverGold
Options Bulls Should Consider This Gold Stock (NEM)
By: Schaeffer's Investment Research | June 14, 2022
• Newmont stock boasts an impressive technical setup
• NEM has added more than 19% over the past six months
Gold stock Newmont Corporation (NYSE:NEM) is bouncing off support at its 200- and 320-day moving average convergence. The stock has also found a floor right above the $62-$63 area, which marks both its year-to-date breakeven level and round $50 billion market cap. Plus, the stock is up 7.8% year-to-date and 19.2% over the past six months.

Of the 23 analysts in coverage, 16 carry a "hold" rating, with seven at a "buy" or better, leaving plenty of opportunity for an optimistic shift. And though short interest has increased roughly 40% since December, the shares have still rallied, pointing to underlying technical strength.
Many June 70 and 75 calls expire next week, and some recent weakness may have been caused by an unwinding of long positions associated with these calls. Furthermore, the security's Schaeffer's Volatility Scorecard (SVS) sits at a relatively high 80 out of 100, meaning NEM has exceeded options traders' volatility expectations during the past year.
Read Full Story »»»
 DiscoverGold
Are Gold Investors Ready for a Massive Dollar Rally?
By: P. Radomski | June 13, 2022
In the Extra Gold & Silver Trading Alert that I sent over the weekend, I explained why Friday’s upswing was most likely unsustainable. We didn’t have to wait long for the market to agree with me.
In today’s pre-market trading, gold, silver, and stocks are down substantially, while the USD Index is up. Let’s take a closer look.
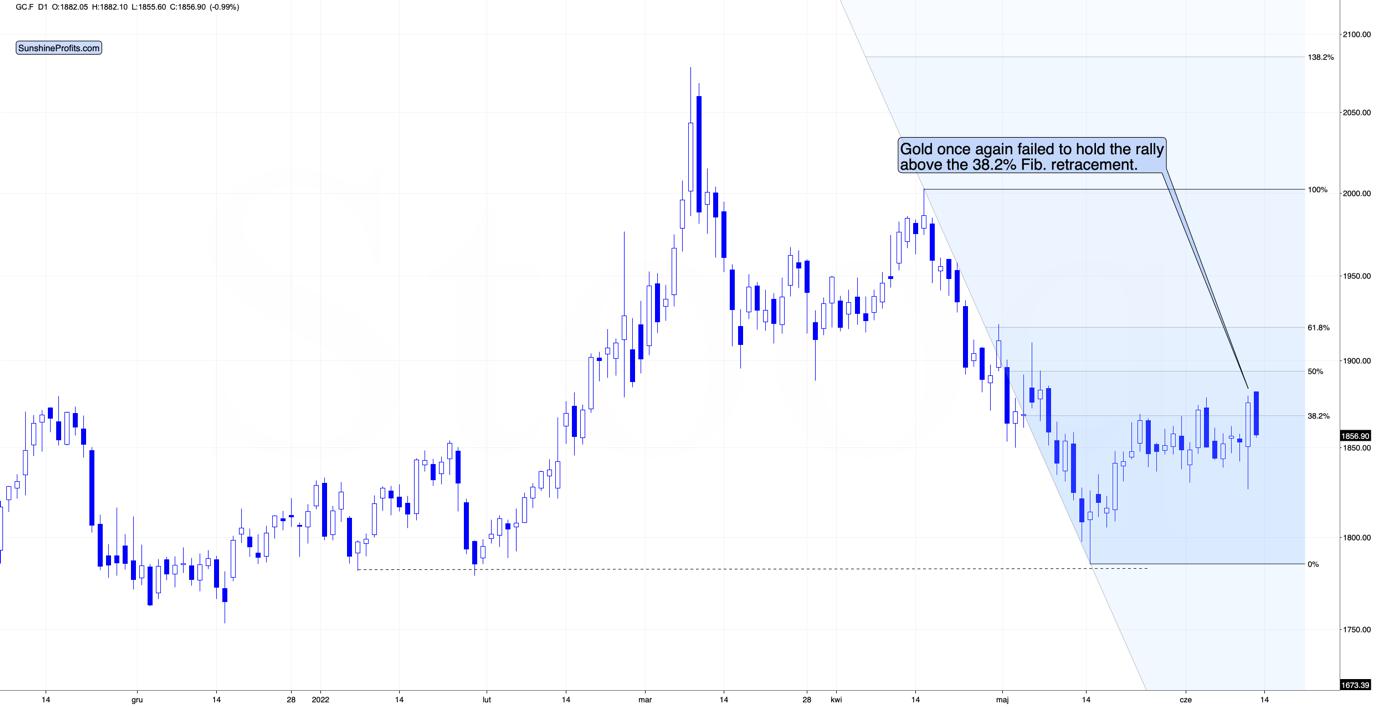
Gold declined 1% so far today and while it didn’t erase the entire Friday’s rally, it declined most of it and – most importantly – it already invalidated Friday’s attempt to break above the 38.2% Fibonacci retracement.

In the case of the silver market, Friday’s rally is barely visible. The reversal appeared notable, but silver is already back down in today’s pre-market trading, so it seems that even the short-term trend remains down.
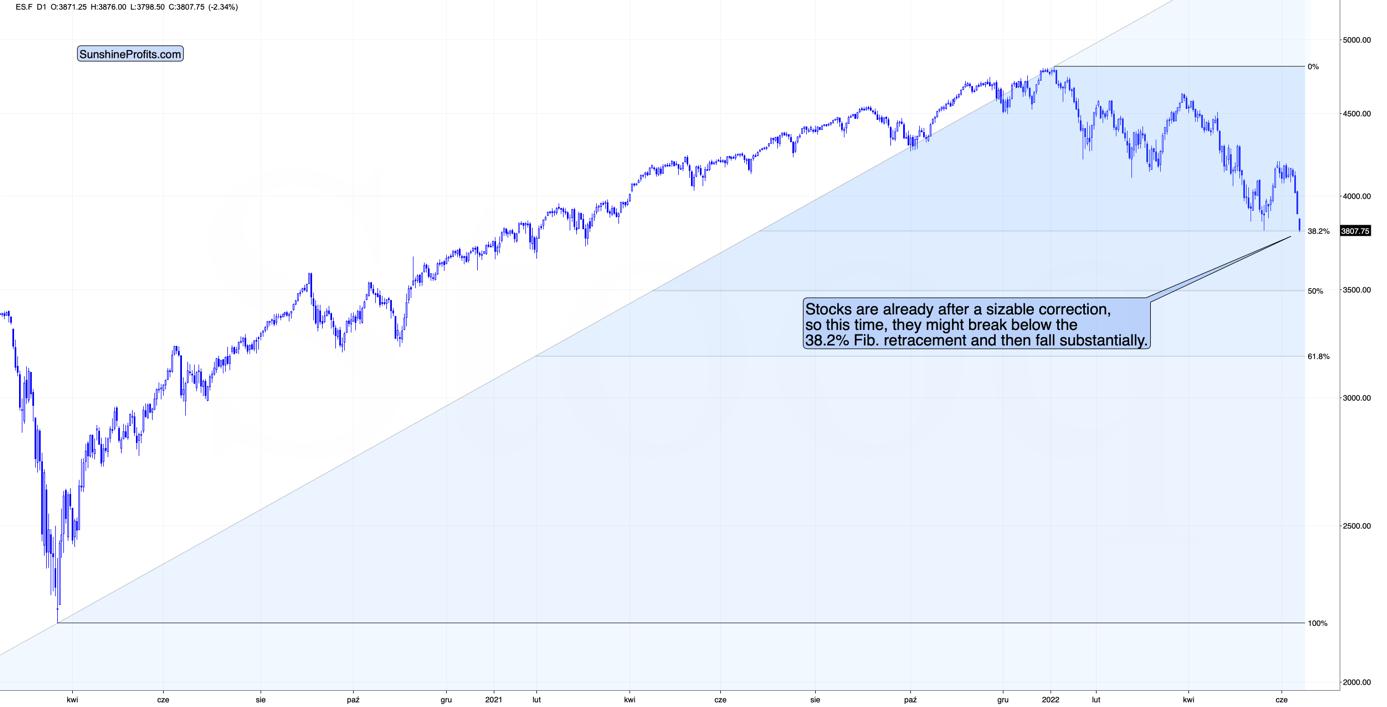
At the time of writing these words, the stock market (the S&P 500 futures) is already trading at new 2022 lows. Silver and mining stocks (especially junior miners) are closely linked to the performance of stocks in the short term, so it seems that when gold finally declines, silver and miners will be affected and decline even more. That’s very much in tune with my previous expectations.
On May 21, 2022 (based on May 20 close), I wrote the following:
If history rhymes – as it usually tends to – we’re likely to see higher stock market values in the next 1-3 days. That’s likely to support higher junior mining stock prices.
Also, let’s not forget about the forest while looking at the trees. Yesterday’s intraday low in the S&P 500 was 3810.32, which was just about 5 index points below my initial target for this short-term decline at the 38.2% Fibonacci retracement based on the entire 2020 – 2022 rally.
This means that the odds of a short-term rally in stocks have greatly increased.
That was the bottom, and we have indeed seen a short-term corrective upswing since then. However, this correction appears to be over – stocks have just moved to new lows. Given that they already corrected after first approaching the 38.2% Fibonacci retracement based on the 2020 – 2022 rally – they can now break through this level without looking back. This would be particularly bearish for silver and mining stocks (especially junior mining stocks).
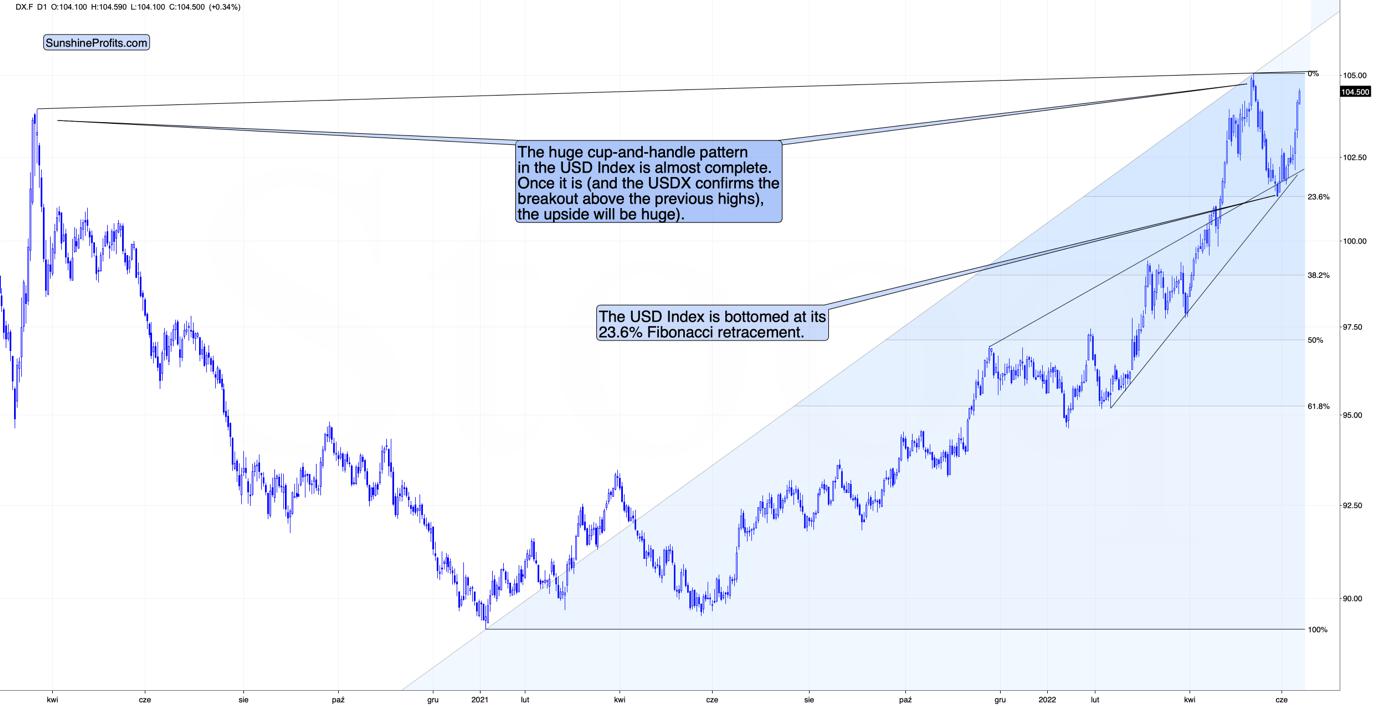
On top of that, we see a soaring USD Index, which is about to move to (and likely above) its previous highs.
The key detail about the following rally is that it will mean the completion of a broad cup-and-handle pattern. This means that after the breakout, the USD Index would be likely to continue rallying in the medium run, and yes, this means that the following rally could be huge. This is in perfect tune with what I’ve been expecting to see for many months – including the beginning of 2021, when almost everyone was bearish on the U.S. currency.
What about junior miners?
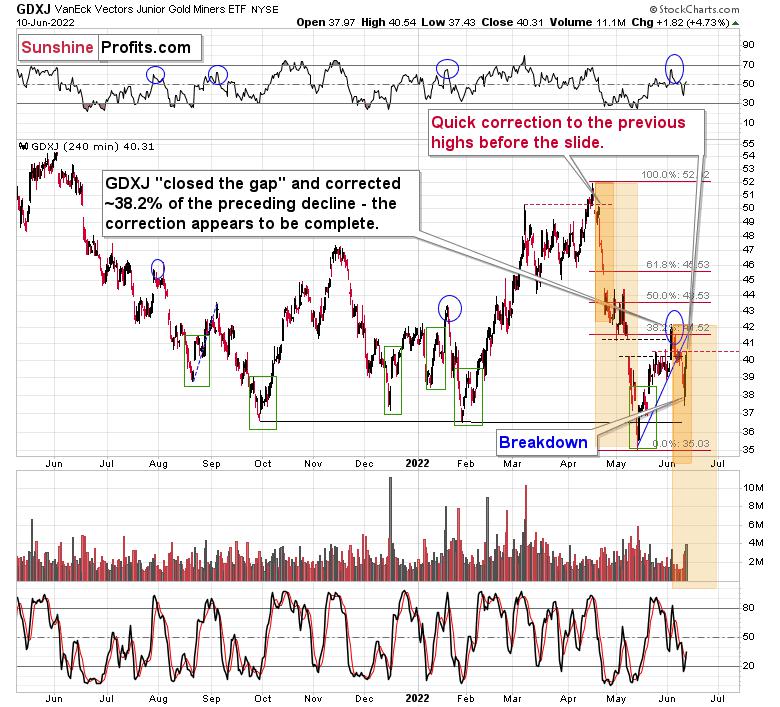
On Friday, they rallied in a quite emotional manner, just as gold did. Unlike gold, however, they didn’t move to new short-term highs. They just corrected to their previous highs, and even though Friday’s rally was much bigger than what we saw in early April, these rallies ended at similar levels – close to previous highs. I marked it with red, dashed lines.
Friday’s rally changes nothing with regard to the medium-term trends, and the overnight price changes that I discussed above support the theory in which junior miners head much lower in the following weeks (and probably days).
On a side note, do you know what appears to be a currency but doesn’t pay any interest, and doesn’t have thousands of years of history to back up its use? Cryptos. Do you know what just broke to new lows? Also cryptos, and as the interest rates on fiat currencies continue to increase, the pressure to sell cryptos will also increase. Please keep in mind that I called the top in bitcoin when it moved to $50k – it was not 100% precise, but given that it’s currently worth less than half of that, it seems that it was a quite good exit point.
Read Full Story »»»
 DiscoverGold
A Pivotal Juncture for Gold, Gold Stocks
By: Gary Tanashian | June 13, 2022
Another hot CPI fails to suppress gold
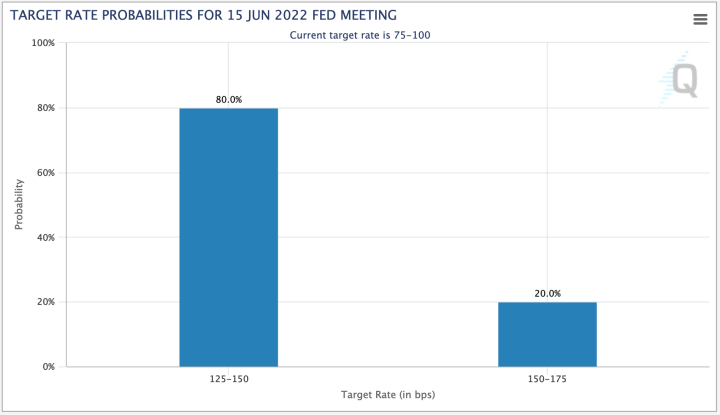
With FOMC on tap with an upcoming .5% rate hike, gold got hammered and bounced back with a vengeance on ‘CPI’ Friday. The Fed will raise the Funds Rate at least .5% next week. So says not me, but the wise guys whose job it is to correctly anticipate FOMC policy. Indeed, a full 20% of CME traders expect .75%, up from our last check on June 3.
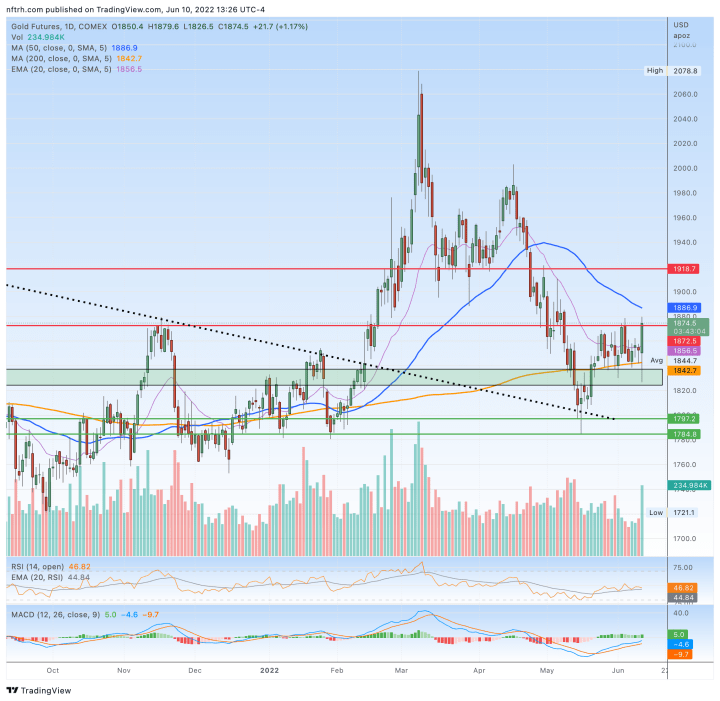
Meanwhile, the gold price (futures) was unceremoniously shoved below the daily chart’s SMA 200 before pulling its bounce back routine on CPI Friday. Check out that reversal volume. This is notable stuff and with FOMC in the wings, it is doubly so.
To NFTRH, unlike many gold/commodity observers, gold is far different from the other inflated stuff. It has far more counter-cyclical aspects to it than copper, industrial materials, energy commodities and even to a degree, silver.
As the latest CPI inflation reading comes in (click the graphic below for the full report from BLS) with economy-compromising data (among other things, real wages are falling and consumer sentiment is taking a big hit) the backdrop is stagflationary, not the long-since aborted but previously perceived ‘good’ inflation that drove stocks up and out of the 2020 pandemic crash.

From day one (of NFTRH history, nearly 14 years ago and counting) we have noted that gold is unique and as they leverage the macro either positively or negatively, gold stocks – especially miners – are even more unique. The long phases of gold miner under-performance to the metal are born of the fact that there have been long phases where central bank-sponsored inflation have worked toward pro-cyclical ends.
Now, amid the oncoming Stagflation (ref. this post from May 2021) and the Fed, tardy to its tightening regimen but now forced by the market into full frontal hawk mode, ready to raise rates again, comes a potential (important word; gurus making predictions should be tuned out as the carnival barkers they are) turning point. Maybe gold’s impressive in-day move is just that, a notable move during one day. FOMC is up next and that’s often a tough one for the monetary metal that would shine a light on the monetary shenanigans that the Fed and by extension, scores of financial advisers and the financial money management industry live by.
Here is a reminder of the weekly chart situation in gold. The metal has been hammered along with most other items during the Fed’s tardy but violent hawkish turn. But the ‘handle’ breakout has held, as has key support.
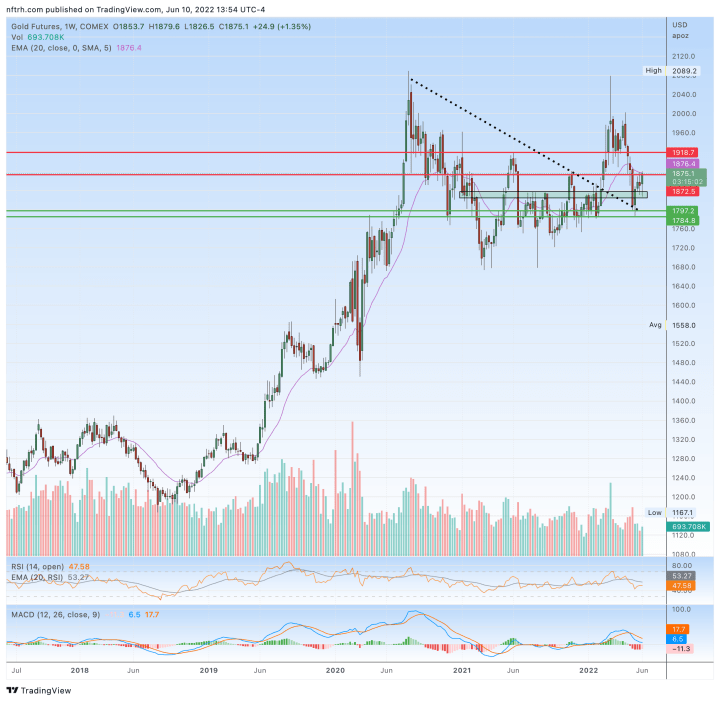
Handle you ask? Well yes. Since mid-2020 when projecting the need for gold to take a corrective breather we had been labeling the ensuing correction as the handle to a bullish big picture Cup. The gold price broke out of the handle in February of this year, put in a hard test of the breakout and now – amid the most hawkish projections yet for the Fed – it is acting unique compared to cyclical and inflated markets. As noted earlier on Friday in the NFTRH Trade Log:
But on a day like today, insofar as the uniqueness persists I take it seriously. Patiently, but seriously.
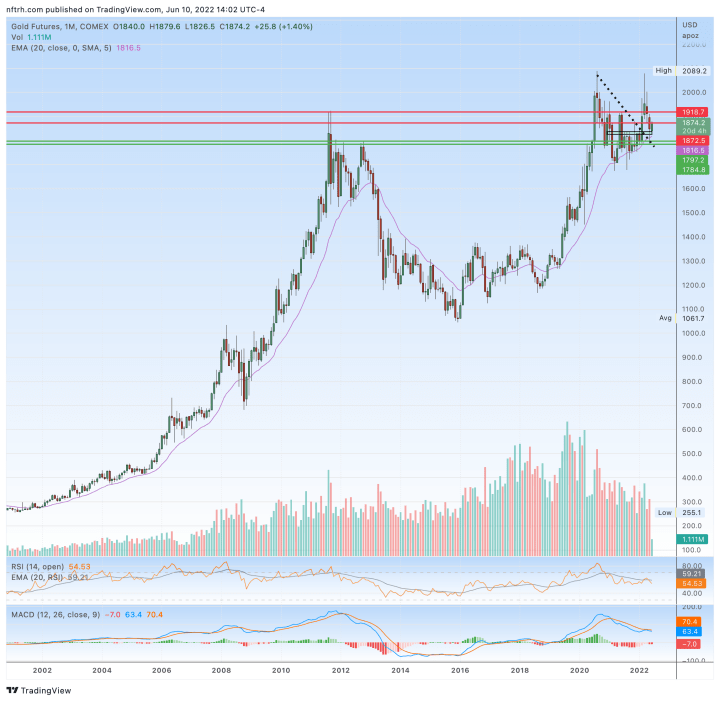
Especially since the monthly chart is and has been bullish since well before we projected the mid-2020 correction/consolidation. There is one thing and one thing only that I do not like about this chart. That thing was the failure to make a higher high in March to the 2020 high. It’s not a major issue, but it should be pointed out anyway because it would add an alternative view of a double top should gold unexpectedly fail. Forewarned is forearmed and all…
Bottom Line
This does not mean to run out and buy gold stocks right this minute (I did add a couple premier royalty companies to my one core miner and core smaller royalty already held), but it is something to watch for as we enter FOMC week. With the economically corrosive aspects of the current stagflationary environment, and with gold already out-performing stock markets and some commodities it is time to look for change. That change will not be toward the type of inflation that lifted so many cyclical boats out of the 2020 quagmire.
Gold and especially gold stocks (ongoing analysis in weekly NFTRH reports) are counter-cyclical. We have been noting forever and a day that the macro fundamental picture for gold stocks is incomplete, but with so much happening now on the macro and with the seasonal due to bottom in July well, if you’re not paying attention now you’re just not paying attention.
Read Full Story »»»
 DiscoverGold
why gold is down today is beyond reason, other than central bank bots trying to levitate the dollar. when it fails, moon shot.
Huge bullish reversal for $GDX after hitting the lower BB
By: CyclesFan | June 12, 2022
• Huge bullish reversal for $GDX after hitting the lower BB. Friday's low was only a half cycle low on day 20 so it's quite possible that GDX will make a higher high in this daily cycle potentially filling the gap at 34 before declining into the daily cycle low.

Read Full Story »»»
 DiscoverGold
Gold Market Update - FINAL TIME BELOW $2000...
By: Clive Maund | June 12, 2022
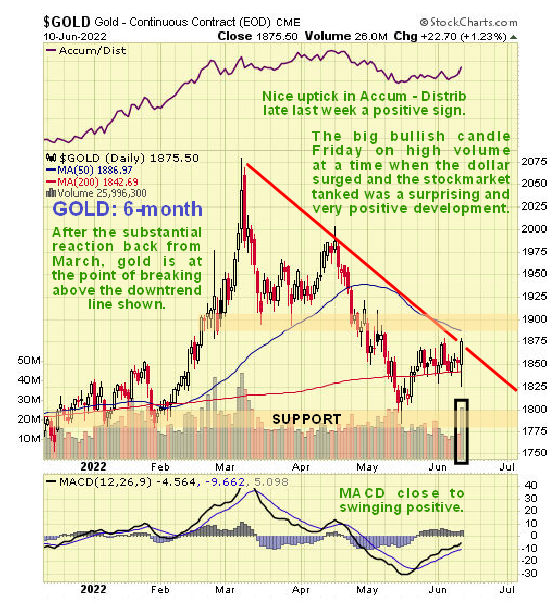
It was certainly an interesting day in the markets on Friday and more than that it was an encouraging day for investors in the Precious Metals sector, because gold actually rose at a time when the broad stockmarket fell hard and the dollar rose sharply at the same time.
On its latest 6-month chart we can see how, despite dropping vertically early in the day, gold went on to recover and then advance further on the strongest upside volume since early March to close well up on the day. In the circumstances this is very bullish. We can also see how this action brought it to the point of breaking out of the downtrend in force from early March.
On the 4-year chart we can see that gold is now in position to advance away from the quite strong support at the apex of the Symmetrical Triangle that it broke out of in February and March. Given the clear breakout from this Triangle it is surprising that gold reacted back as far as it did, but significantly it did not break below the support at the apex of the Triangle and thus, so far at least, it has not suffered technical damage as a result of this reaction. The Accumulation line continues to march higher in its uptrend suggesting that another important uptrend will soon develop in gold, and there is certainly scope for it with the MACD indicator being close to neutrality.

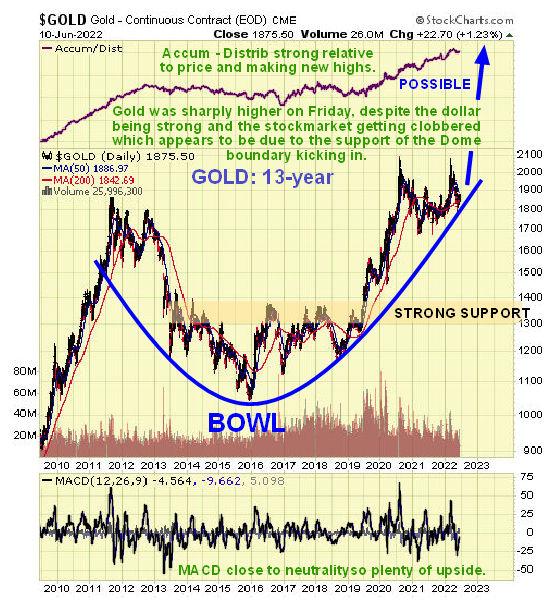
We can see why gold would break ranks here and advance on its 13-year chart, which reveals that the lengthy consolidation pattern from the August 2020 highs has allowed time for the boundary of the giant Bowl pattern shown to catch up to the price, the better to propel it higher. Note here that the pattern may also be described as a Cup & Handle that corresponds to the Cup & Handle that we have have delineated on the long-term silver chart, with the Handle being the consolidation pattern that has built out from the August 2020 high, but as we have a fit with our Bowl pattern, and adding the Cup & Handle on the chart would create clutter, we can leave it at thew Bowl pattern for now. What is certainly clear is that after having consolidated for almost 2 years now and inflation rapidly gathering pace, we could see a really big upleg from here, such that the $2000 level quickly disappears in the rear view.
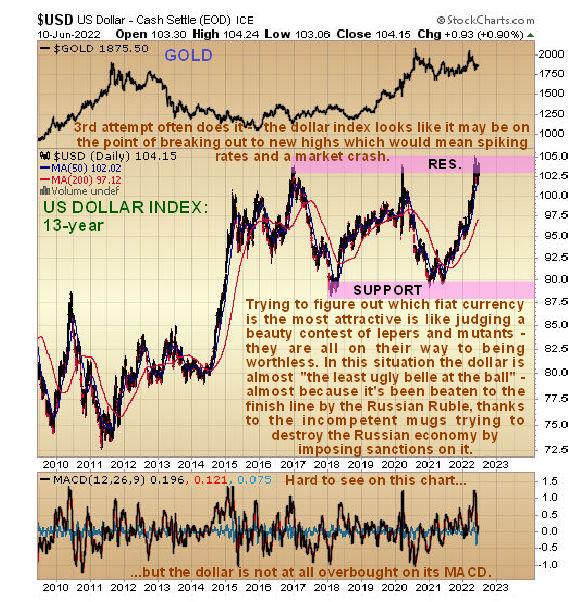
With the debt market getting ever closer to blowing to smithereens and the stockmarket inching towards an all-out crash in consequence it would seem that the dollar and gold are “brothers in arms” near-term as safe havens, even if the dollar is destined to end up in the ditch along with all other fiat. For now though the dollar is “the least ugly belle at the ball” because of its universality and the long habit of fleeing into it at times of crisis. Least ugly that is with the exception of the Russian Ruble. The malicious attempt to sabotage the Russian economy by the West by means of sanctions and the outright theft of its foreign assets is backfiring spectacularly which is why the Ruble is doing so well. Russia’s demands with respect to the Ukraine were perfectly reasonable – it did not want Ukraine joining NATO and then having loads of missiles pointed at it from the eastern Ukrainian border and the Russian speaking population of Eastern Ukraine being victimized by Ukraine’s Nazi thugs. Because these reasonable demands were not met, Russia had no option but to use force. The reason for the pathological hatred of Russia by NATO and the Western powers is not entirely clear but is thought to be related to geriatric old politicians who can’t get over the fact that the Soviet Union no longer exists, and also due to what psychologists call “projection” – the need to have someone to hate and victimize, apart from their own citizens of course. Russia’s attitude has been pragmatic throughout and it has said “OK, if you don’t want our gas and oil, minerals and wheat etc, there are plenty of other buyers in Asia etc who do. The globalist leaders in Brussels clearly have zero concern for their own citizens and are entirely preoccupied with the priorities of the World Economic Forum and Agenda 2030 etc, which means that, having alienated Russia and destroyed mutually beneficial relationships with it, Europe is destined to become even more of an economic basket case with its citizens set to freeze in the dark next Winter.
When we look at the long-term 13-year chart for the dollar index, we see that it is on the point of breaking out upside from the gigantic trading range that it has been stuck in since 2015 – this is the 3rd attempt at this and it is often the 3rd attempt that does it. If the debts markets blow up and stockmarkets tank there will clearly be an awful lot of funk money fleeing into cash and this time probably gold.
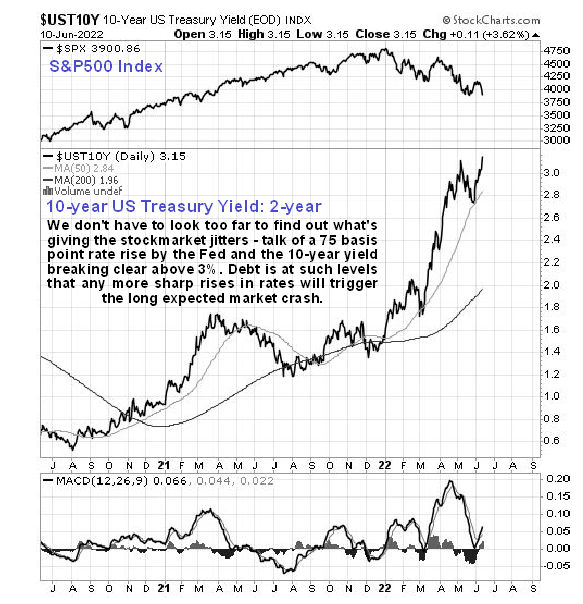
With inflation ramping up spectacularly, interest rates are grudgingly playing catchup and limping along behind. The rises in rates that we are likely to see will not be enough to contain inflation, which thanks to rabid money creation is fast heading in the direction of hyperiflation, but will be enough to implode the debt markets and crash global stockmarkets and burst housing bubbles. On our 2-year chart for the 10-year US Treasury Yield we can quickly see why stockmarkets got clobbered this Spring – the yield broke out at the start of the year and rose sharply. Now, after a pause that has allowed markets to unwind their oversold conditions, it looks like it is set to march higher again and Friday’s rise to new highs and talk of the Fed raising rates by 75 basis points this coming week is what the stockmarket to drop hard on Friday. So if the 10-year yield continues to advance from here, we can expect markets to tank.
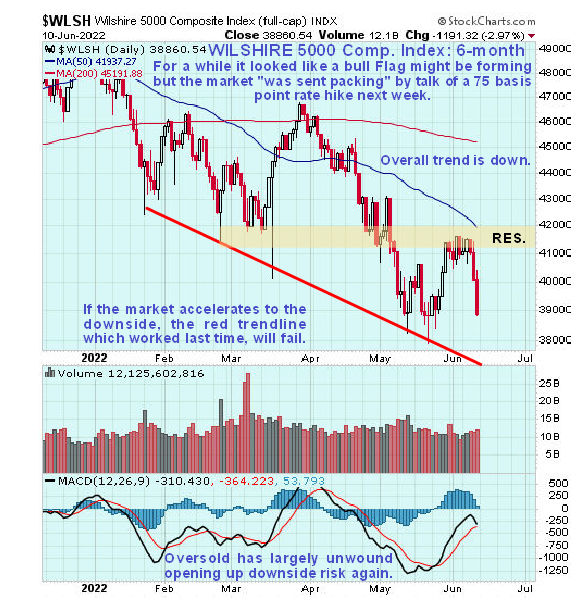
On the 6-month chart for the Wilshire 5000 index we can see how the market started to head south again on Thursday and Friday and looks like it is headed to the red trendline as a mínimum short-term downside objective.
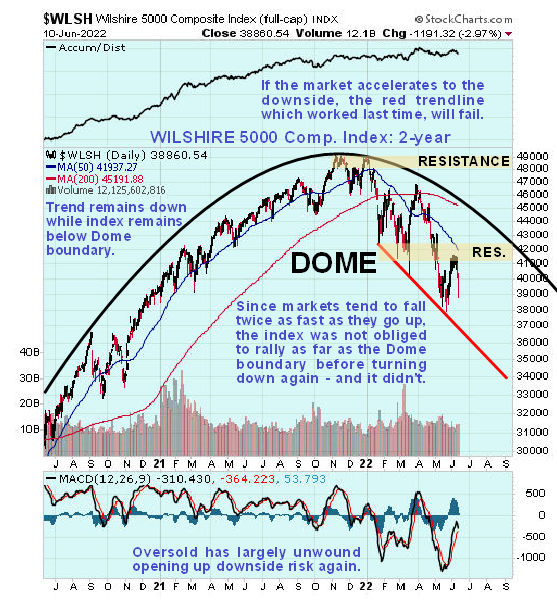
On the 2-year chart for the Wilshire 5000 we can see that the market is now in ragged retreat beneath the giant Distribution Dome shown and for practical purposes it can be considered to be a bearmarket as long as it remains below the Dome boundary. A very important point to note is that, since markets tend to fall twice as fast as they go up, this index is not obliged to rally up to the Dome boundary again and may contrinue to accelerate to the downside. Note the now very bearish alignment of the moving averages.
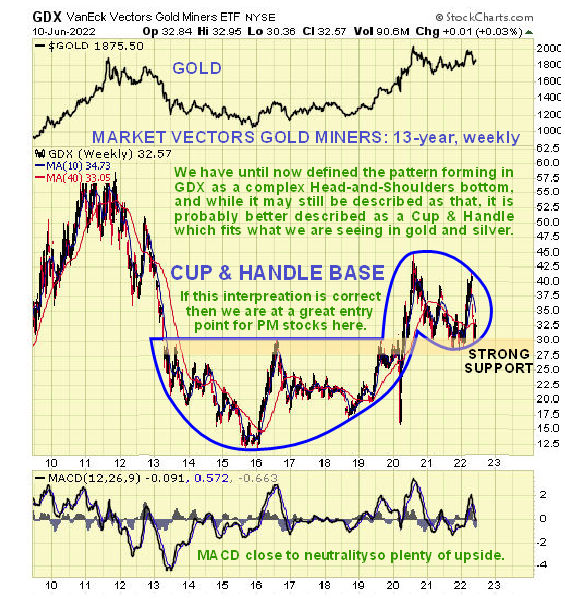
So how does the long-term 13-year chart for the Market Vectors Gold Miners (GDX) look now? It couldn’t look better as this ETF, which is good barometer of gold stocks generally, looks like it is in the very late stages of a giant Cup & Handle base, which can also be classified as a giant complex Head-and-Shoulders bottom, and is also at strong support near to the lower boundary of the Handle of the pattern, meaning that, if this interpretation is correct, we are at an excellent point to buy. Don’t be thrown by this chart saying that it only rose 0.03%, it is a weekly chart, and GDX actually rose 4.7% Friday, putting in a big “bullish engulfing pattern” at a time when the broad market dropped hard, so that GDX looks like it put in a Double Bottom late last week with its mid-May lows.
Read Full Story »»»
 DiscoverGold
Gold Inching Towards The Finish Line
By: Jim Curry | June 12, 2022
Recapping Last week
Following an early-week consolidation to the downside, Gold saw both its high and low for last week registered in Friday's session, with the low made in early-day trading with the tag of 1826.50 - followed by a spike back to new highs for the swing with the late-day tag of 1879.60. For the five day period, Gold gained approximately 25 points, a decent gain from the prior weekly close.
Gold Market, Short-Term
For the very short-term, the analysis presented in our Gold Wave Trader report favored the most recent short-term correction to come from the combination of 10 and 20-day cycles, which saw the 20-day moving average acting as the magnet to the recent downward phase of these waves.
The chart below shows the smaller 10-day cycle:
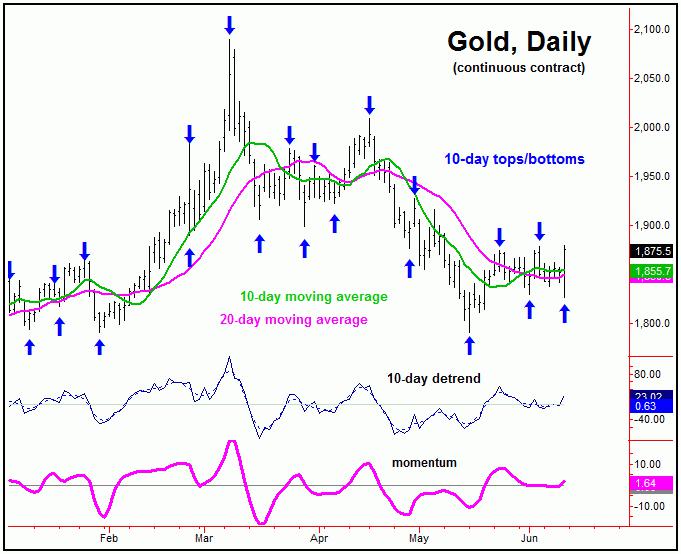
In terms of patterns, the correction phase of these 10 and 20-day waves was expected to end up as a countertrend affair - holding above the prior swing low of 1791.20 - which was the last trough for our larger 20-day component.
With Friday's late-day reversal back to new highs for the swing, our 10 and 20-day trough had to have formed early-Friday, and with that the combination of these waves is now seen as heading back to the upside.
Gold Closing in on the Finish Line
From the comments made in past articles, the last low of significance for Gold was expected to come from our larger 72-day cycle, which was registered back in mid-May - and which is shown again on the chart below:
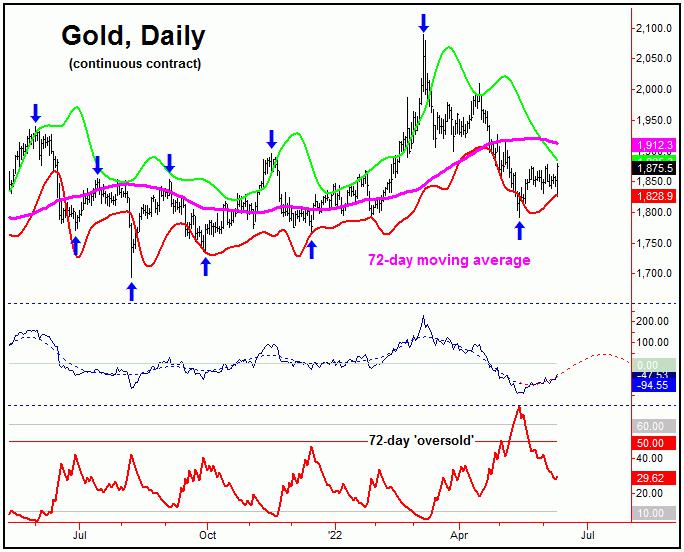
With the position of the 72-day cycle projected higher into July, the probabilities favored the most recent short-term decline with the 10 and 20-day cycles to end up as a countertrend affair - which it was able to do.
In terms of patterns, a countertrend decline with the 10 and 20-day cycles was then expected to give way to higher highs on the next upward phase of those two waves, before topping the larger 72-day component. With Friday's late-day action, we now have that higher high, and thus are now working on our next key price peak for the metal - expected to come from this same 72-day cycle.
In terms of time, the overall assumption has been that the upward phase of the 72-day wave would hold up into the early-July timeframe or later - simply based upon (1) a statistical analysis of this wave, in regards to time, and (2) the position of our detrend's projected path for this cycle.
Stepping back, from whatever high that does form with our 72-day cycle in the coming weeks, the probabilities will favor another larger percentage decline into what looks to be the Autumn of this year, one which seems likely to drop back below the 1791 swing bottom, the late-May trough.
That move down should end up as the next mid-term low for Gold, coming from the bigger 310-day cycle - which is shown again on our next chart:
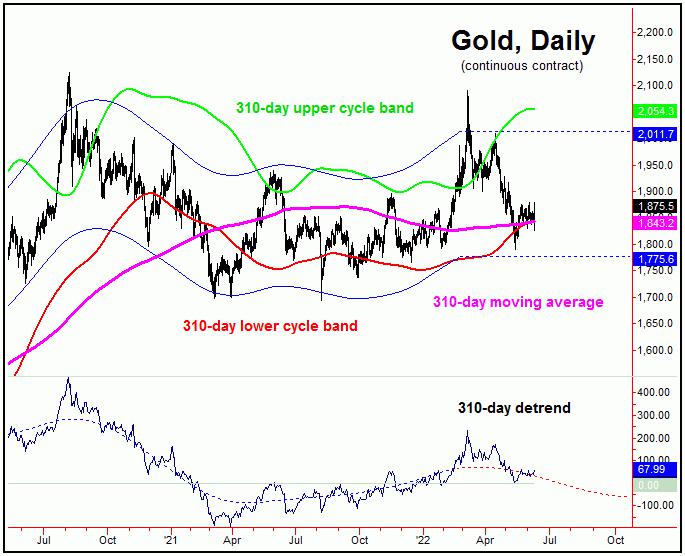
Going further with the above, the next move down into our 310-day cycle bottom should end up as the next mid-term low for Gold. What follows should be an much larger percentage rally on the next swing up with this 310-day component, with the average rallies with this cycle having been around 25% from trough-to-peak.
With the above said and noted, we are watching some key technical signals in the days/weeks ahead, in the anticipation of the next 72-day cycle top forming. From there, as mentioned, another sharp decline phase is expected to follow with this component, ideally taking the metal back to or below the May trough into the Autumn of this year - then to be on the lookout for the next mid-term low to form. Stay tuned.
Read Full Story »»»
 DiscoverGold
NY Gold Futures »» Weekly Summary Analysis
By: Marty Armstrong | June 11, 2022
NY Gold Futures closed today at 187550 and is trading up about 2.56% for the year from last year's settlement of 182860. This price action here in June is reflecting that this has been still a bearish reactionary trend on the monthly level.
ECONOMIC CONFIDENCE MODEL CORRELATION
Here in NY Gold Futures, we do find that this particular market has correlated with our Economic Confidence Model in the past. The Last turning point on the ECM cycle low to line up with this market was 2015. The Last turning point on the ECM cycle high to line up with this market was 2020 and 2011 and 1996.
MARKET OVERVIEW
NEAR-TERM OUTLOOK
The historical perspective in the NY Gold Futures included a rally from 2015 moving into a major high for 2020, the market has been consolidating since the major high with the last significant reaction low established back in 2015. The market is still holding above last year's low. The last Yearly Reversal to be elected was a Bullish at the close of 2020.
This market remains in a positive position on the weekly to yearly levels of our indicating models.
Solely focusing on only the indicating ranges on the Daily level in the NY Gold Futures, this market remains moderately bullish currently with underlying support beginning at 187230 and overhead resistance forming above at 187860. The market is trading closer to the resistance level at this time.
On the weekly level, the last important low was established the week of June 6th at 182650, which was down 13 weeks from the high made back during the week of March 7th. This was a key week for at least a temporary low. We have seen the market drop sharply for the past week penetrating the previous week's low and yet it recovered to close above the previous week's close of 185020. We are still trading above the Weekly Momentum Indicators so we have not undermined critical support as of yet.
INTERMEDIATE-TERM OUTLOOK
YEARLY MOMENTUM MODEL INDICATOR
Our Momentum Models are declining at this time with the previous high made 2020 while the last low formed on 2021. However, this market has rallied in price with the last cyclical high formed on 2020 and thus we have a divergence warning that this market is starting to run out of strength on the upside.
Critical support still underlies this market at 175200 and a break of that level on a monthly closing basis would warn that a sustainable decline ahead becomes possible. Immediately, the market is trading within last month's trading range in a neutral position.
 DiscoverGold
 Jack Chan: Gold Price Exclusive Update
By: Jack Chan | June 11, 2022
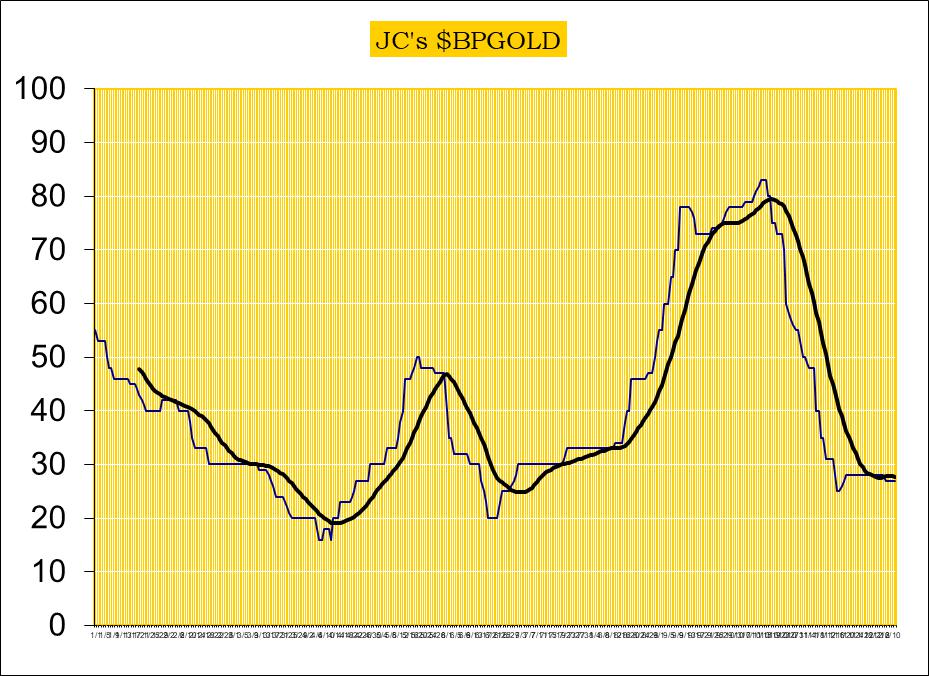
Our proprietary cycle indicator is down, but bottoming.
To public readers of our updates, our cycle indicator is one of the most effective timing tool for traders and investors. It is not perfect, because periodically the market can be more volatile and can result in short term whipsaws. But overall, the cycle indicator provides us with a clear direction how we should be speculating.
Investors
During a major buy signal, investors can accumulate positions by cost averaging at cycle bottoms, ideally when prices are at or near the daily 200ema.
During a major sell signal, investors should be hedged or in cash.
Traders
Simply cost average in at cycle bottoms when prices are at or near the daily 200ema; and cost average out at cycle tops when prices are above the daily 50ema.
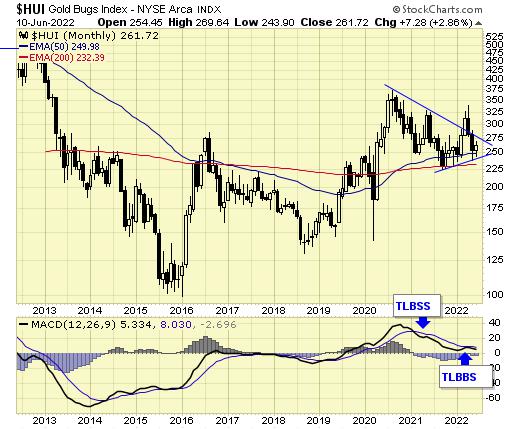
Gold sector is on long term BUY signal, suggesting that the correction since 2020 has been completed.
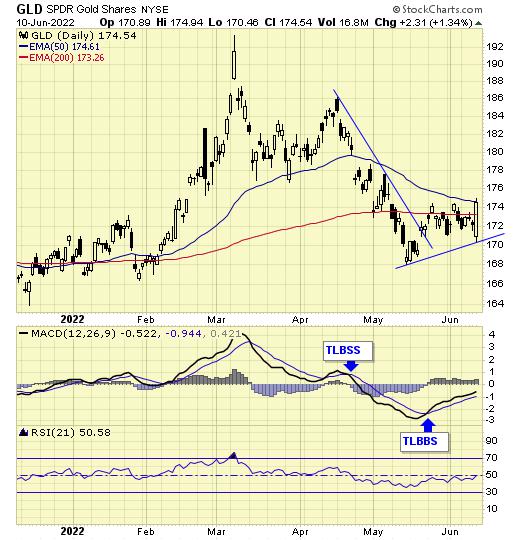
GLD is on short term buy signal.
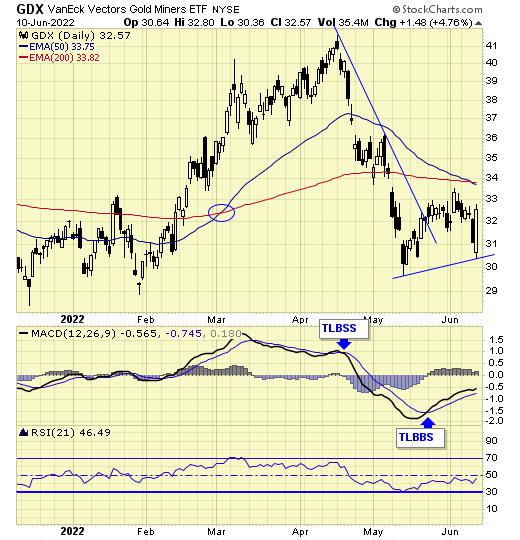
GDX is on short term buy signal.
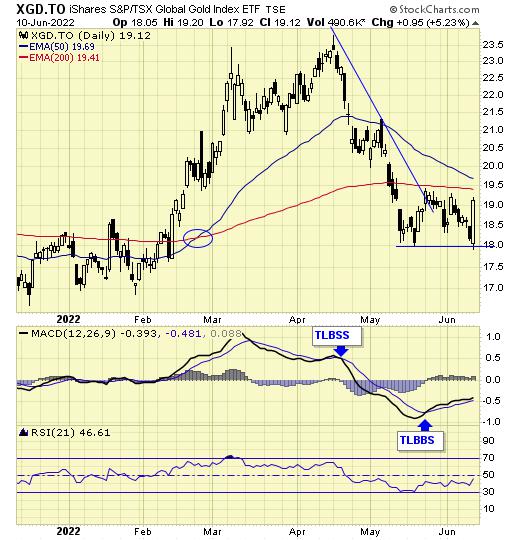
XGD.to is on short term buy signal.
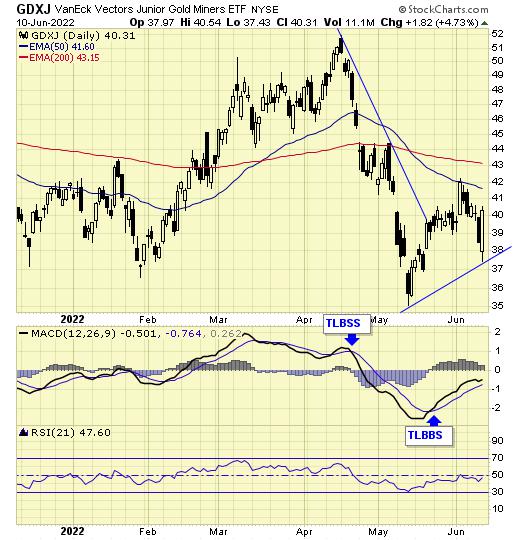
GDXJ is on short term buy signal.
Analysis
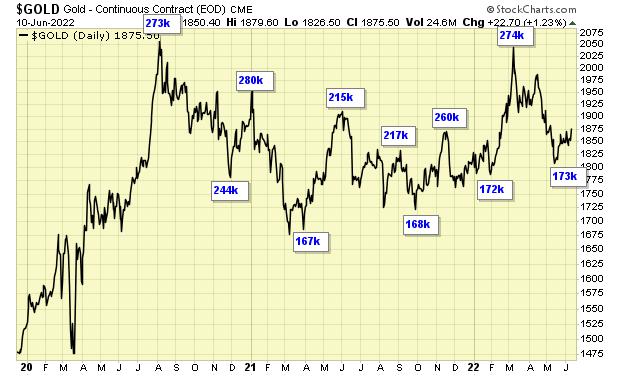
Speculation rising from level of previous bottoms.
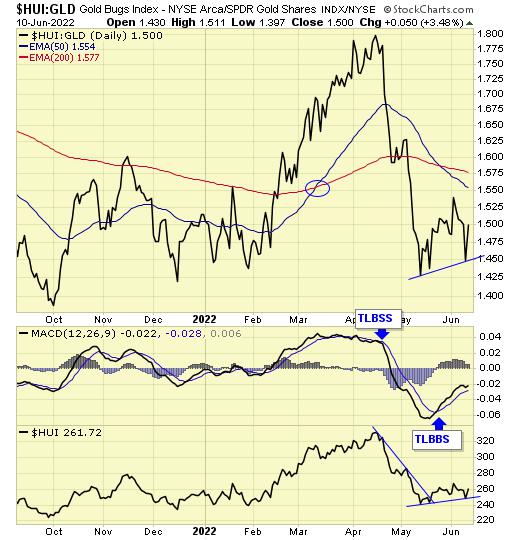
Our ratio is on buy signal.
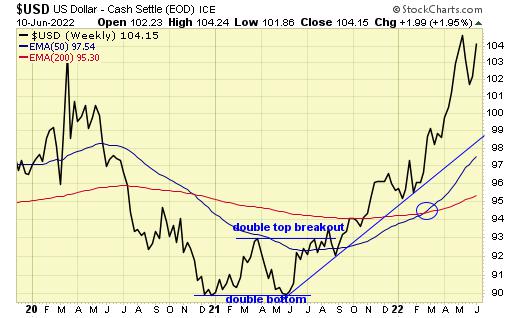
Trend is up for the dollar.
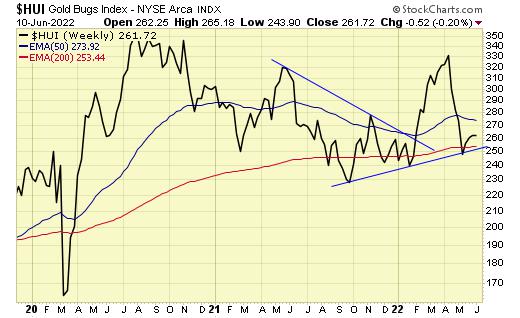
$HUI is holding support.
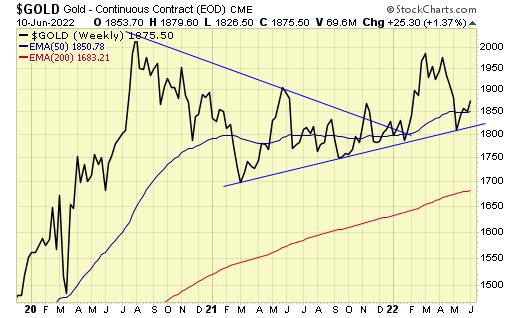
Gold is holding support.
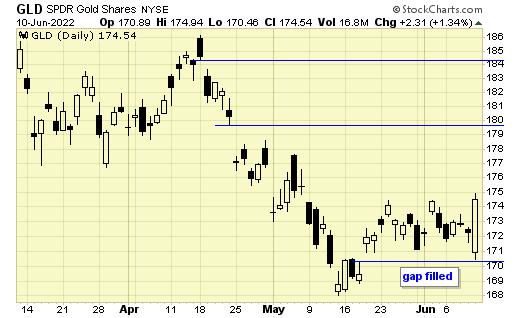
Downside gap is now filled.
The are two upside gaps to be filled in coming days.
Summary
Long term – on BUY signal.
Short term – on buy signals.
Gold sector cycle is down but bottoming.
Speculation has reached level of previous bottoms, expect overall higher prices.
$$$ We are holding a core position and will continue to accumulate positions.
Read Full Story »»»
 DiscoverGold
Gold & Stock Market Turmoil: Key Tactics Now
By: Morris Hubbartt | June 11, 2022
Super Force Signals (SFS) is being rebranded as Super Gold Signals (SGS at https://supergoldsignals.com), to reflect the growing global importance of gold.
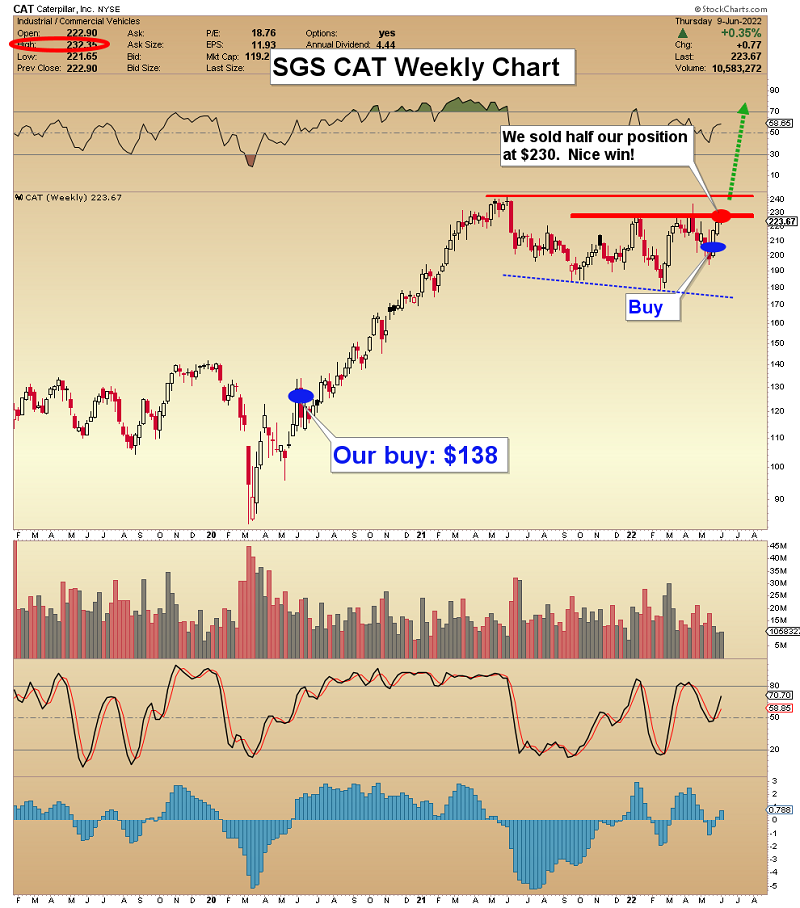
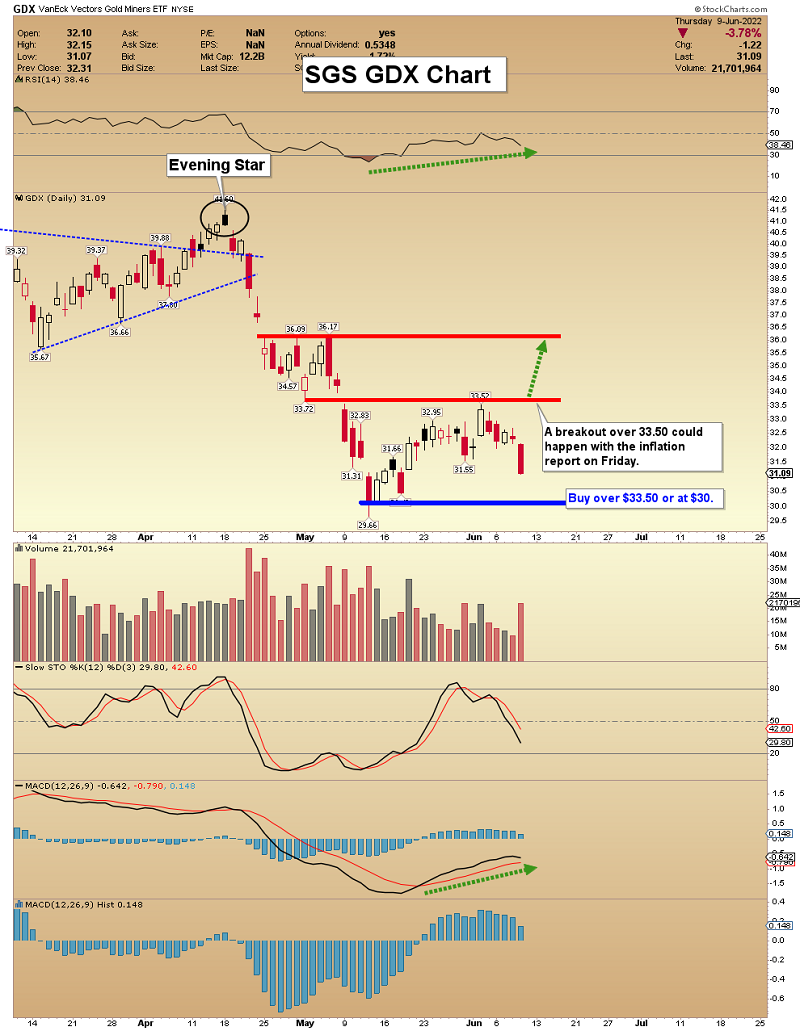
SG60 Key Charts, Signals, & Video Analysis
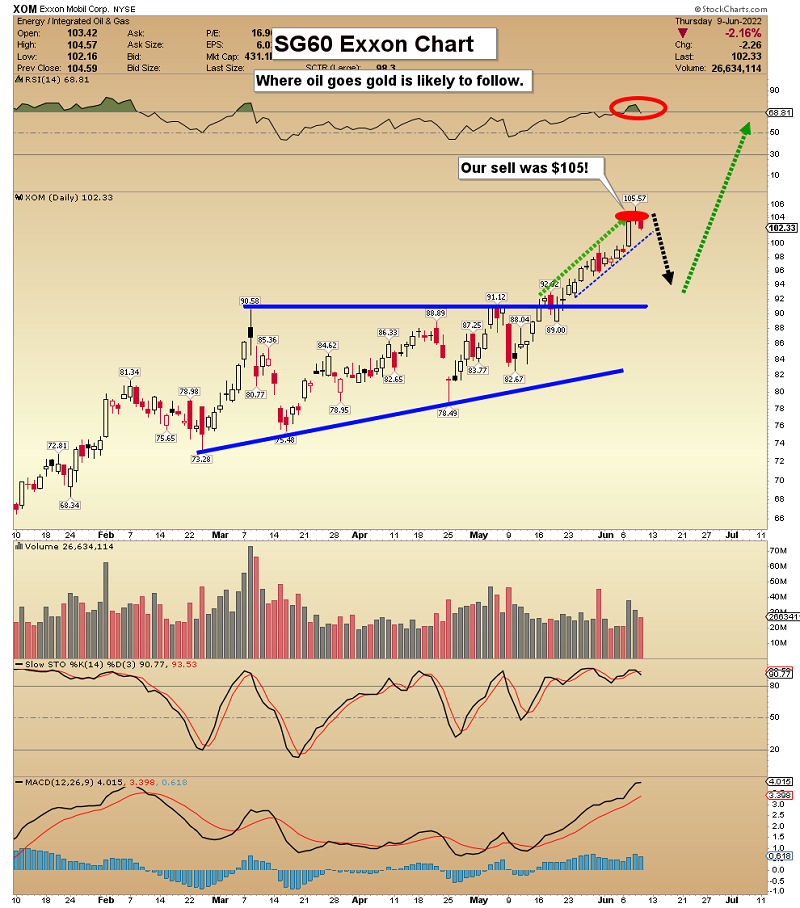
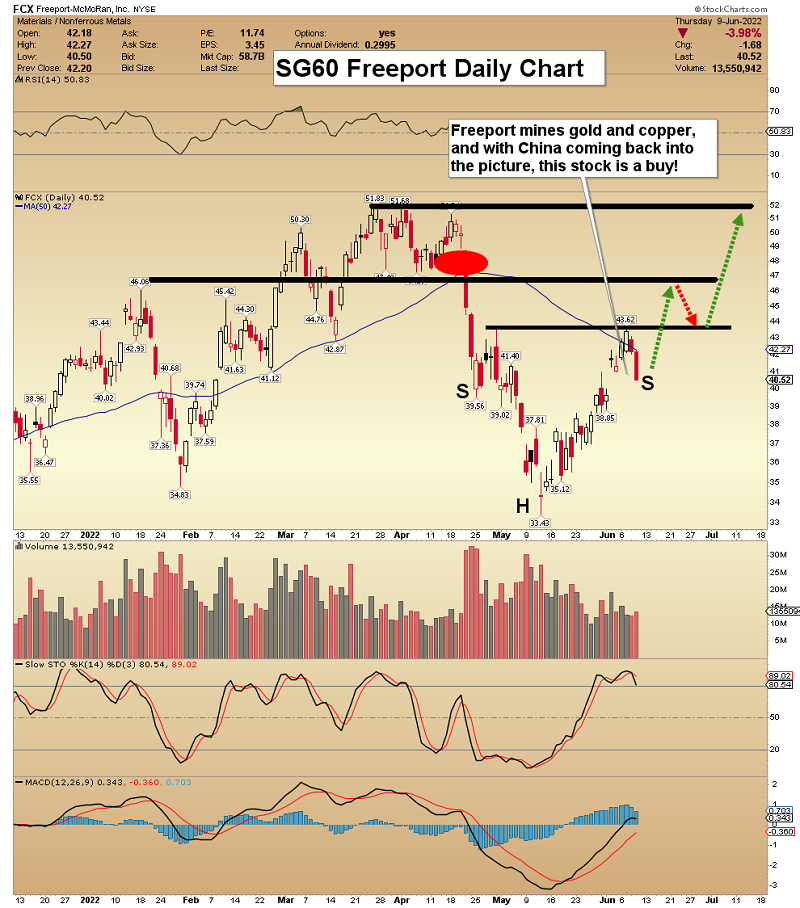
SGT Key Charts, Signals, & Video Analysis
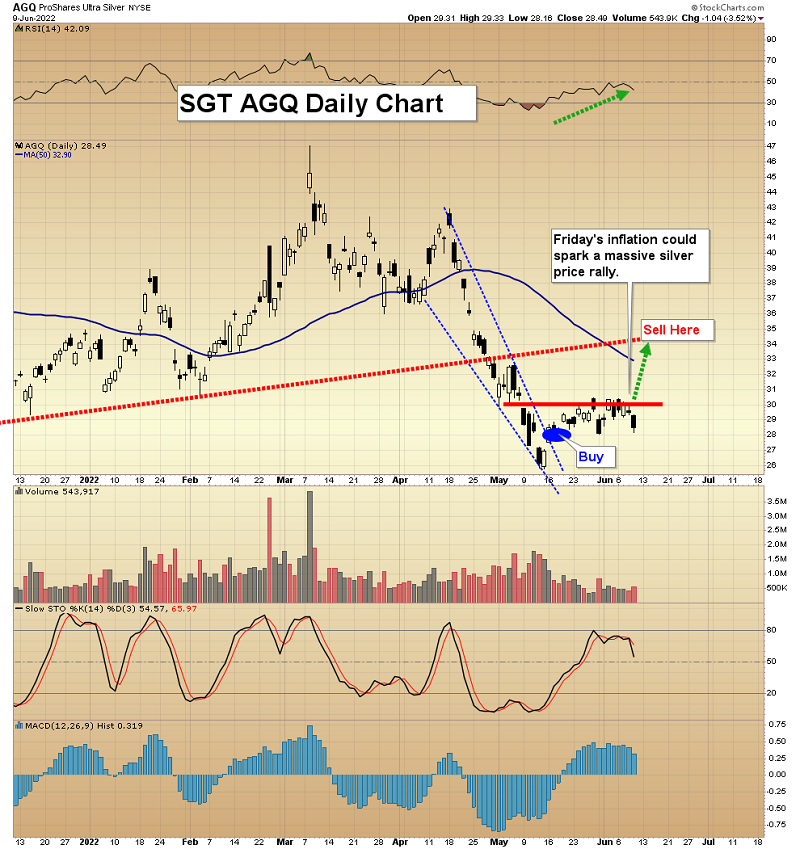
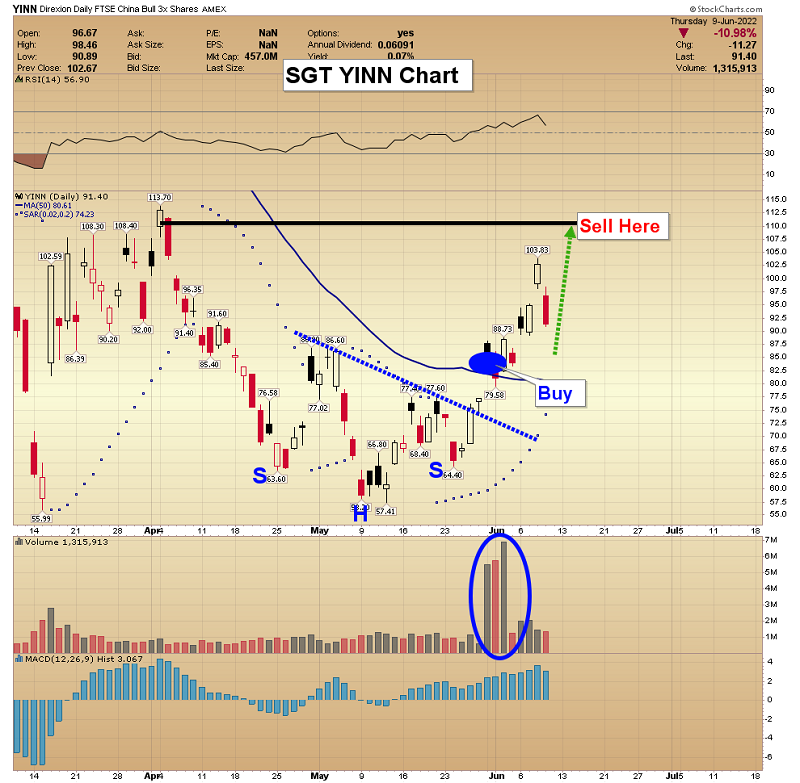
Inflation is out of control and gold has not gained serious traction... yet! All our gold portfolios are in the black and SGT is the hot shot of the pack. SGT is mostly leveraged ETFs trading, with alerts by email or text. With markets grinding, the service is a must-have for many gold investors. SGT at $99 a month is a good price, but with all this inflation, I'm offering a 14month SGT subscription for just $249! Please send me an email if you want the offer. Thank-you!
SGJ Key Charts, Signals, & Video Analysis
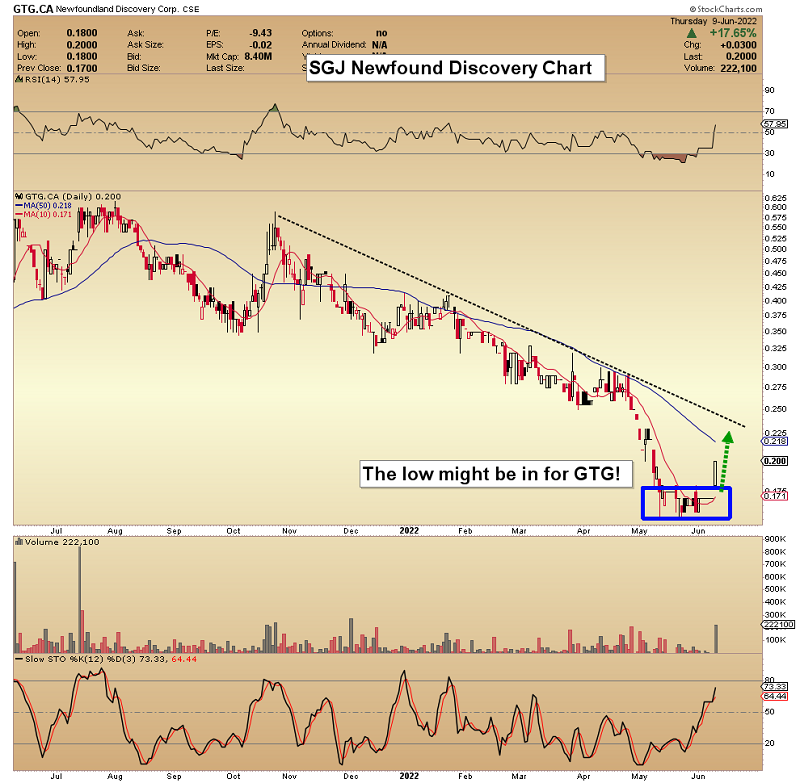
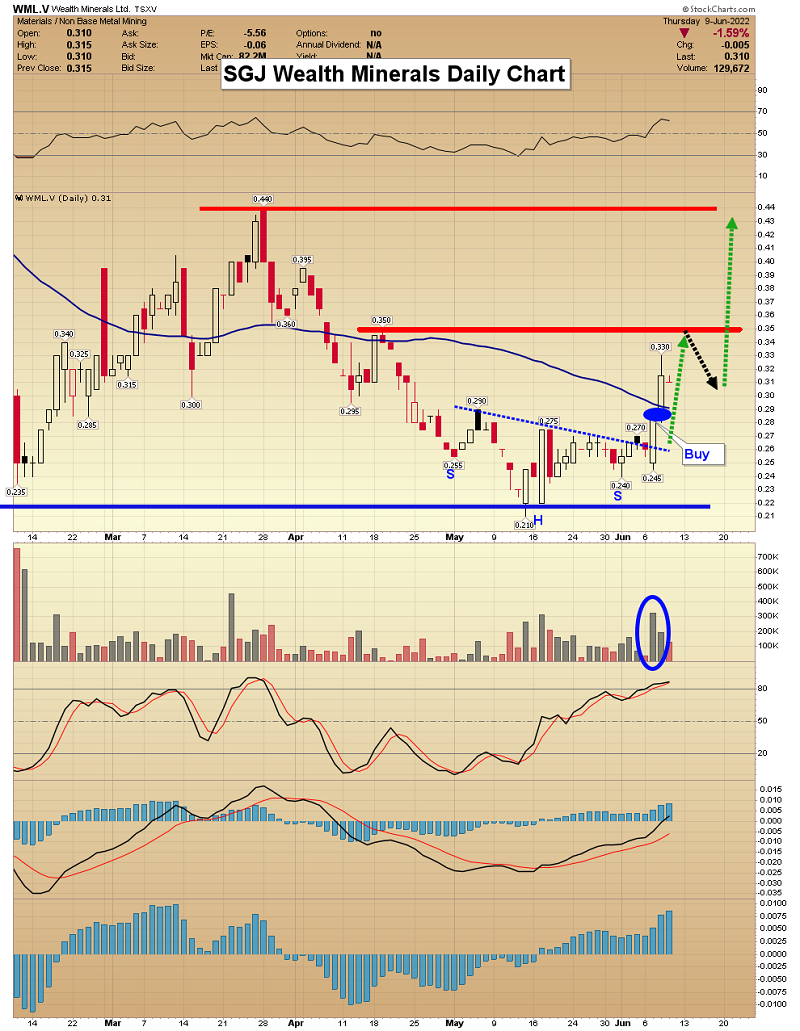
Read Full Story »»»
 DiscoverGold
COT - Commitments of Traders in Metals Futures Market Reports
By: Software North | June 10, 2022
Gold

Silver

Read Full Story »»»
 DiscoverGold
metals and miners will bring in Trillions more dollars and some of crypto, and make multi trillions for those that do.
I know I did, maxing out, when gold blew threw 1850, I did a typical about face and bought with both fists gdx. I have another much smaller account to contribute on monday or tuesday, whenever the funds are made available. Sometimes you feel you don't know whether you are coming or going. The next stop is a major one, and that is POG 1900. All of the majors in this index are locked and loaded, with excellent balance sheets. It all falls to the bottom line now for all of them. The second biggest component of gdx, which is Barrack, second to NEM, says they make 1.5 billion annually per 100 move in the price of gold. If this darn thing can hold 1850, which is thought to be major barrier/support...........it could get scary.
Friday may have been the most important day for gold miners in quite a few years, since gold broke through 1360 about 3 years ago...............maybe the plane is ready to move up to new highs. but first get through 1900. There is so much cash sitting now on the sideline, that if just a small bit of that goes into GDX, the thing could double overnight.
another important factor is crypto. ....I have said for years that GOLD and the miners won't really get their mojo back until crypto largely fails. and it is.
GDXJ: While Focusing on Details, Don’t Miss the Great Downturn!
By: Przemyslaw Radomski | June 10, 2022
• If history is to repeat itself to some extent, junior miners have a chance to make minor corrections. However, is it worth leaving short positions now?
Junior Miners Technical Analysis
Let’s take a look at what happened in junior mining stocks.

In last Friday’s (June 3) Gold & Silver Trading Alert, I commented on Thursday’s rally in the following way:
The price of the GDXJ ETF – a proxy for junior miners – moved sharply higher yesterday, and this got many people excited. High volume confirms that. It’s natural for most investors and traders to view rallies as bullish, but let’s keep in mind that most traders tend to lose money… It’s not that simple. After all, the best shorting opportunities are at the tops, which – by definition – can only be formed after a rally.
The particularly interesting thing about high volume readings in the GDXJ ETF is that they quite often mark local tops. Remember the late-April – early-May consolidation? It ended when GDXJ finally rallied on high volume. That was the perfect shorting opportunity, not a moment to panic and exit the short position.
The GDXJ-based RSI indicator is also quite informative right now. It moved well above 50, but it’s not at 70 yet. Why would that be important? Because that’s when many of the previous corrections ended.
When one digs deeper, things get even more interesting. You see, when we consider corrections that started after the RSI was very oversold (after forming a double bottom below 30), it turns out that in all those cases, the tops formed with the RSI between 50 and 70. I marked those situations with blue ellipses on the above chart.
So, while it’s easy to “follow the action,” it’s usually the case that remaining calm and analytical leads to bigger profits in the end.
Also, let’s use yesterday’s move as something useful. If this single-day move higher made you really uncomfortable and almost made you run for the hills, it might be a sign that the size of the position that you have is too big. It’s your capital and you can do with it what you wish, but if the above were the case, it might serve as food for thought.
The big trend (as well as the reasons for it) remains down, which means that the enormous profit potential remains intact.
Last Friday’s and this week’s declines confirm the above. The high-volume rally marked the top – those who got excited at that time likely bought exactly or very close to the top, instead of shorting at that time. Fortunately, you were prepared.
After taking profits off the table and closing short positions on May 12, we immediately entered long positions (it turned out that it happened right at the bottom), and we then took profits from that long position on May 26. Next, we returned to short positions. These positions are already profitable, but it seems that they will be much more profitable soon. Why?
Why – GDXJ ETF Price Forecast
Most importantly, because history rhymes, we’re likely to see a repeat of 2012-2013 or the 2008 decline. So far, the current slide is in tune with the 2008 performance.
However, let’s not dig into the long-term details yet. While we’re close to the short-term chart, let’s focus on what it features. For your convenience, here it is once again.

The recent April-May decline doesn’t have to be repeated to the letter, but we could see something similar nonetheless. After all, that decline is the most recent analogy to what we’re about to see in the GDXJ (a massive decline).
Based on the above, I marked two cases from the precious decline (the initial decline and the entire decline) and I copied them to the current situation, assuming that the recent top is indeed the starting point of the next bid decline (which seems likely in my view).
It turns out that junior miners might need to decline to or slightly below the May lows before we see even a moderate corrective upswing.
Will I want to trade this correction? Probably not. If we see a correction from below $35, it might be small – only a bit over $36, so it might be way too risky to trade this quick rebound. The downside (the bigger orange rectangle) is much bigger than the above, and it would be a much bigger waste to miss this move in order to try to catch a relatively small move.
Besides, there’s also a chance that we won’t see any meaningful correction, just like what happened in 2020.

Back in March 2020, after the corrective upswing, mining stocks fell like a stone in water. While the current price moves are less volatile, they are still somewhat similar (note the marked areas on the above chart).
Moreover, please note that the GDXJ failed to break back above the red and green resistance lines, which by itself is also a bearish indication.
The next short-term upswing is quite likely here, and (while I can’t make any promises with regard to performance), in my opinion, the profits on our short positions are likely to increase tremendously before we exit them.
Read Full Story »»»
 DiscoverGold
trunkmonk, I just posted this on a baby biotech board; it may be of some value. FYI......
tootalljones
Friday, June 10, 2022 8:32:56 AM
Re: tootalljones post# 360495
Post#
362838
of 362843
We are living in a bear world you guys. About a week ago I posted when anavex popped back up to 9, that the rally was over and it would see new lows (below 7) by the month of august.
Looks like I was slightly off: I should have said July (June perhaps this very month perhaps?). When you look at Seeking Alpha, a fine financial community with hundreds of fund managers as members, many of whom wrote articles on this or that, what you see these days is one word they are all now starting to use: RECESSION.
Why is this a problem, and why does it affect AVXL?
regardless of the internal progress or developments of Dr. Missiling and his workforce? .
Because the last two recessions were very severe, the two most brutal since the Great Depression. I am talking about 2001 and 2008. The Fund Industry wants no part of that any longer for one reason only: they will lose their customers. So these guys are selling. Let the crazy lady who runs ARK high tech fund lose all of her client's money as she rides her tech fund down from 150 to 20 bucks. Just because she is a crazy lady from Caliland, does not mean you have to follow her down, because she is still getting paid, even if Ark goes to 5 bucks. It is not her money.
Don't listen to Dalio and Buffett, who claim to stay in for the longer term, with Ray Blow It out your AZZ Dalio saying on his speed dial ten times a day, "cash is trash," to keep the customers in equities till they lose it all. He ain't losing it all, he is a billionaire...don't let the financial industry mind control and destroy your finances, because they will if they can.
So don't be a fool, ESPECIALLY IF YOU ARE AN OLDER INVESTOR....because in these severe recessions due to all the last 20 years of radical financial engineering by the government, you will be parted from your money.
The funds are selling now, and asking questions later. Do not be the last one at the party to leave, this has been a 12 year bull market, the longest in american history and valuations are still at stratospheric levels. And the american consumer, who is the fat slob on steroids running the american economy, is now shutting down. ...SHUTTING DOWN...look at Target and Walmart most recent reports. And the Americans are still debt engorged, in every way imaginable.
Don't be a fanatic or an ideologue.
A man only makes so much money in his lifetime. Put your dreams aside for now. Discretion is the better part of valor, as Shakespeare wrote. Don't be a Cali Crazy or you will be at their mercy.
Protect yourself at all times in the ring, an old and true boxing adage. In other words, don't expect the ref to protect you. At all times protect yourself in the ring, even on the clinch and the break. Don't expect good sportsmanship.
People will kill you over a dollar, trust me, I have tried well over 300 court cases.
People don't give a damn. I have had many emails from this board of appreciation over the past 7 months from older guys, thanking me from saving their behinds. This recession might be here already and it might just be getting started. My prediction for AVXL is an eventualy share price of $2.30, that is just my guess. Don't listen to the crazies or avxl fanatics on this board.
If I didn’t know better today would be the day to buy all the gold silver and miners u possibly can.
$Geodan thanks; GLBXF-Globex Gets Big Royalties For Free, A Deep Value
Stock For The Commodity Super Cycle
https://ceo.ca/@geodan/globex-gets-big-royalties-for-free-a-deep-value-stock-for-the-commodity-super-cycle
This is an article wrote Thursday that is on CEO.CA . It is one of the best value
stocks have ever seen. Like iHub CEO is free to read and post on. Here is how
article starts:
Globex is a mining royalty company and a mine and mining claim wheeler/dealer
with high growth, and deep value, and that is in the right place at the right time.
Globex often gets a 3% GMR, or Gross Metal Royalty, not the more normal 1%
NSR. Since they sell the properties for a profit, those massive royalties are for free.
A 3% GMR is extremely valuable, if a mine they sell produces $2 billion in sales at
a 10% profit ($200 million) Globex will get $60 million or 30% of the profits yet has
no risk nor investment. If a client miner sells $2 billion of minerals and loses $50
million, Globex will still make the $60 million in profits.
They have over 200 mining properties and dozens of royalties yet are at a dirt-
cheap valuation of Allen EV/EBITDA of 1.55, ROCE of 1,926%, Current Ratio of
131 and with Sales Growth of 335%.
Due to having so many deals in place Globex will be a legitimate drilling results
news machine on steroids. They pay nothing for the drilling yet benefit greatly
when results are good. If 15 clients drill in a year Globex gets the news flow from
all of them.
There is only one other deep-value company I know of that gets mining royalties
for free.
That is GoldSpot. I have a large position in both and think both are outstanding
investments.
Globex has high insider ownership and a long record of avoiding dilution and
wasteful spending.
RE: NYBob, you have been in this a while. Drop by the article and post.
https://ceo.ca/@geodan/globex-gets-big-royalties-for-free-a-deep-value-stock-for-the-commodity-super-cycle Love to see you there, it is free.
Globex is a mining royalty company and a mine and mining claim wheeler/dealer
with high growth, and deep value, and that is in the right place at the right time.
Globex often gets a 3% GMR, or Gross Metal Royalty, not the more normal 1%
NSR. Since they sell the properties for a profit, those massive royalties are for
free.
A 3% GMR is extremely valuable, if a mine they sell produces $2 billion in sales at
a 10% profit ($200 million) Globex will get $60 million or 30% of the profits yet
has
no risk nor investment. If a client miner sells $2 billion of minerals and loses $50
million, Globex will still make the $60 million in profits.
They have over 200 mining properties and dozens of royalties yet are at a dirt-
cheap valuation of Allen EV/EBITDA of 1.55, ROCE of 1,926%, Current Ratio of
131 and with Sales Growth of 335%.
Due to having so many deals in place Globex will be a legitimate drilling results
news machine on steroids. They pay nothing for the drilling yet benefit greatly
when results are good. If 15 clients drill in a year Globex gets the news flow from
all of them.
There is only one other deep-value company I know of that gets mining royalties
for free.
That is GoldSpot. I have a large position in both and think both are outstanding
investments.
Globex has high insider ownership and a long record of avoiding dilution and
wasteful spending.
Underground drilling nearing completion at Globex Mining (TSX:GMX) royalty property Mining
TSX:GMX $64.89M
https://www.globexmining.com/presentation.htm
https://www.globexmining.com/properties.php
https://www.globexmining.com
Simon Druker
https://stockhouse.com/companies/quote?symbol=t.gmx
$In GOD We Trust - Real Money - AU Safety 6000yrs ![]() )
)

https://www.kitconet.com/images/quotes_7a.gif?1493417496003


https://www.kitco.com/images/live/silver.gif?0.8344882022363285
Gold & Silver is the only REAL Legal Tender -
by The Founding Fathers for your -
Rights, Liberty and Freedom -
http://www.biblebelievers.org.au/monie.htm
GOLD STANDARD; THE REAL LEGAL MONEY:
https://www.cs.mcgill.ca/~rwest/wikispeedia/wpcd/wp/g/Gold_standard.htm#:~:text=Advocates%20of%20a%20variety%20of,basis%20for%20a%20monetary%20system.
https://www.usdebtclock.org/
https://www.worldometers.info/coronavirus/country/us/
https://www.whatdoesitmean.com/index.htm
God Bless.
$TM GCM Mining Corp. Plant - The Era of Transformation
60 views Premiered 13 hours ago
Construction of the new polymetallic plant for recovery of zinc, lead, gold and silver
from the tailings into concentrate at Segovia was completed in 2021, generating our
first production of concentrates to be sold in 2022.
The plant creates shared value by creating revenue and reducing our environmental
impact by recovering lead and zinc, returning the final tailings to our
Maria Dama processing plant for purification, and then pumping them to
the El Chocho tailings storage.
https://www.youtube.com/watch?v=bgoX9HNj5kI


Updated Gold Bull Analogs
By: Jordan Roy-Byrne | June 9, 2022
If you follow my work, you know I love studying market history and employing analogs. Market moves of the past can inform the future.
It has been a while since I’ve updated the analogs for Gold.
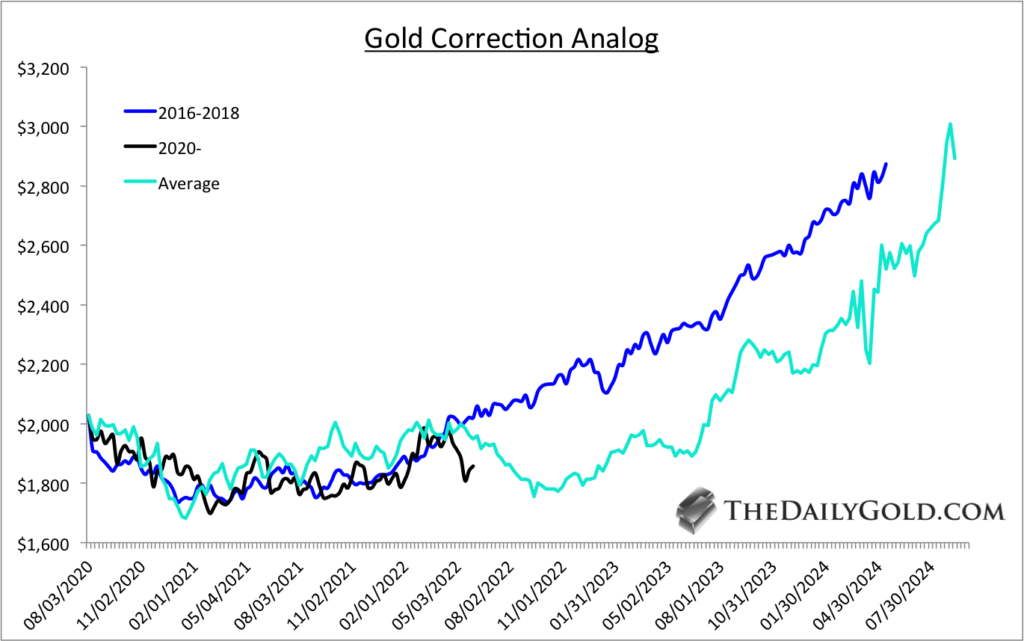
Gold was tracking the average of all bull market corrections and the ensuing rebounds until the recent decline below $1900.
As a result, the best historical comparison is the 2016 to 2018 correction. That correction ended a few months before the Fed’s last rate hike in that cycle, and later Gold broke above 6-year resistance when the Fed cut interest rates.
The average and the 2016-2018 analog put Gold around $3000 in two years.
The best comparison from a bird’s eye view perspective continues to be the 1996 to 2005 period as it applies to the last nine years.
Gold exploded in late 2005 after an 18-month-long consolidation that was part of an irregular cup and handle pattern.
The current cup and handle pattern is larger, fits the textbook parameters, and is more bullish. However, it could take more time to complete.
The outcome is likely to be similar as a breakout past $2100 would lead to a vertical move.
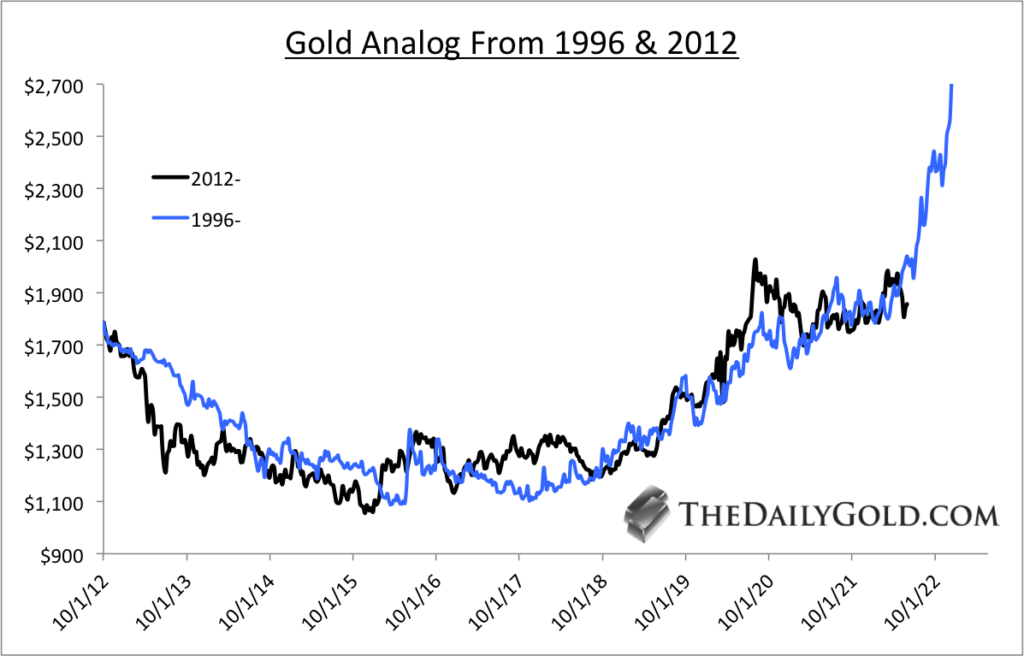
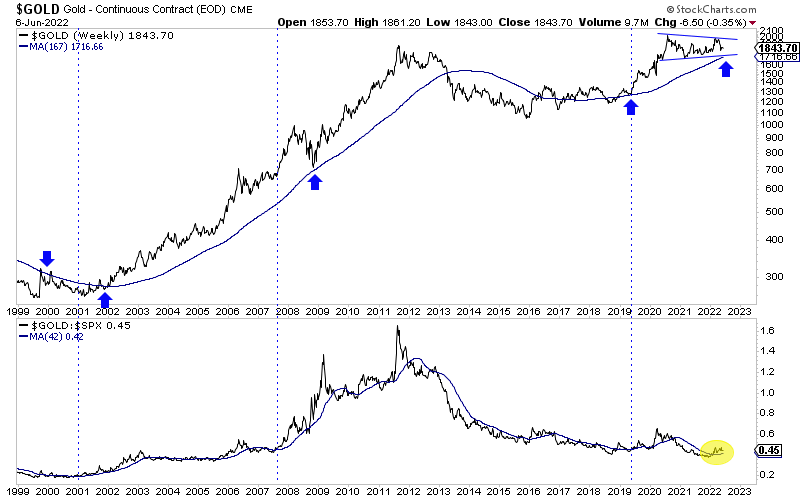
Gold appears to be trading in a very bullish consolidation pattern. It could test even the low $1700s and remain in a very bullish consolidation.
The Gold to S&P 500 ratio is trending higher and above an upward sloping 200-day moving average. See the yellow.
The blue vertical lines show the start of Fed rate cut cycles. The Fed shifting its policy later this year could be the trigger for the significant breakout in Gold.
Investors may have a few more months to accumulate high-quality juniors at very good values.
I continue to be laser-focused on finding quality juniors with at least 5 to 7 bagger potential over the next few years.
Read Full Story »»»
 DiscoverGold
$GDX broke below the May 31 low and will likely close below its 20 DMA
By: CyclesFan | June 9, 2022
• $GDX broke below the May 31 low and will likely close below its 20 DMA. This means that June 2 was the daily cycle high. The daily cycle low may happen as early as June 27.Since GDX is a PM complex leader, gold and silver are likely to follow in breaking below their June 1 low.

Read Full Story »»»
 DiscoverGold
La bot amies lifting their leg on gold. Looks like they marked 1845. Same old stuff, day before critical need to know data.
I would rather buy Barrick at its current 20 bucks rather than 30 where it will be by this february, which ain't that long from now.
If the price of gold scoots higher, and it must (the only question is when, since we have been waiting and consolidating for a good while now), then Barrick should double, as it offers terrific short and long term quality, at a "reasonable price," as Taylor Dart says. POG is consolidating but given the money printing and the coming Geo Political storm and major reordering of the West and its Regimes including America, and its laughable financials, this whole monkey world should start coming down soon enough, and Barrick will double.
It might follow oil, as historically they move in sync. and then it is Katie bar the door....see ya at 60 bucks a share, with gold at 2400 an ounce. seems very doable. My prediction for this next move in gold is around 2700, which puts Barrick well over 80 bucks a share, given its short and long term production and brownfield projects.
Third, this guy who is the best gold analyst for any specific company lb for lb on earth, says that Barrick has an enviable short and longer term rich pipeline here:
https://seekingalpha.com/article/4507492-barrick-gold-attractive-yield-reasonable-price
Fourth: Barricks has a guy who is transforming the company and so far is worth of his reputation as the best in the business, Mark Bristow, and I like the idea of having the best management player in the entire industry. Buffett always says perhaps the most important thing he looks for is the quality of management. He also says buy simple businesses that an idiot can understand because some day an idiot will end up running the business, but Bristow seems to me to be very sharp indeed.
Fifth, And this guy, who won the national stock investing championship and is a superior value investor, says Barrick should make a play for Donlin, which is a very advanced project in alaska, which has a federal permit, and where it already owns half of a 40 million ounce deposit, by far the largest deposit in north america. He says now is the time to pick it up dirt cheap, whereby for perhaps a 25 percent permium, they steal 20 million ounces from their partner NG, which is being given away. Also, the partnership is now doing a very substantial drilling campaign to add millions of ounces to an already vast, pretty rich deposit. Excluding NAK, which will never ever get permitted in the next 5 to 8 years, the Donlin project with some improvement of ounces (5 to 10 million?), is surely one of the top couple advanced projects on earth. In fact I cannot think of anything that compares. This alone would be an unimaginable company maker for a company which has a massive rich pipeline already, but nothing would compare to them grabbing the other half of Donlin. https://seekingalpha.com/article/4515212-barrick-should-acquire-novagold-remaining-50-percent-of-donlin
|
Followers
|
149
|
Posters
|
|
|
Posts (Today)
|
0
|
Posts (Total)
|
5686
|
|
Created
|
06/29/08
|
Type
|
Free
|
| Moderators DiscoverGold trunkmonk | |||

http://www.vaneck.com/index.cfm?cat=3192&tkr=GDX&LN=3-02
The Gold Miners ETF seeks to replicate as closely as possible, before fees and expenses, the price and yield performance of the NYSE Arca Gold Miners Index. The Index provides exposure to publicly traded companies worldwide involved primarily in the mining for gold, representing a diversified blend of small-, mid- and large-capitalization stocks. As such, the Fund is subject to the risks of investing in this sector.
| ||||||||||||||||||||||||||||||||||||||||||||||||||||||||||||||||||||||||||||||||||||||||||||||||||||||
| DAILY |
| WEEKLY |

| Volume | |
| Day Range: | |
| Bid Price | |
| Ask Price | |
| Last Trade Time: |
