


| Followers | 681 |
| Posts | 141519 |
| Boards Moderated | 35 |
| Alias Born | 03/10/2004 |
Sunday, June 12, 2022 2:28:28 PM
By: Clive Maund | June 12, 2022
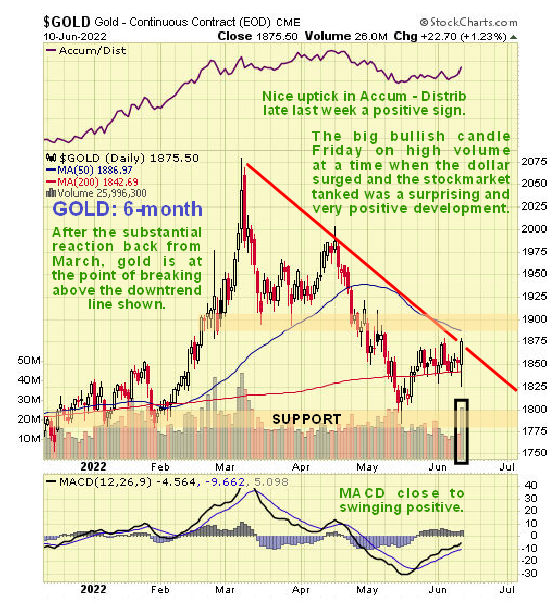
It was certainly an interesting day in the markets on Friday and more than that it was an encouraging day for investors in the Precious Metals sector, because gold actually rose at a time when the broad stockmarket fell hard and the dollar rose sharply at the same time.
On its latest 6-month chart we can see how, despite dropping vertically early in the day, gold went on to recover and then advance further on the strongest upside volume since early March to close well up on the day. In the circumstances this is very bullish. We can also see how this action brought it to the point of breaking out of the downtrend in force from early March.
On the 4-year chart we can see that gold is now in position to advance away from the quite strong support at the apex of the Symmetrical Triangle that it broke out of in February and March. Given the clear breakout from this Triangle it is surprising that gold reacted back as far as it did, but significantly it did not break below the support at the apex of the Triangle and thus, so far at least, it has not suffered technical damage as a result of this reaction. The Accumulation line continues to march higher in its uptrend suggesting that another important uptrend will soon develop in gold, and there is certainly scope for it with the MACD indicator being close to neutrality.

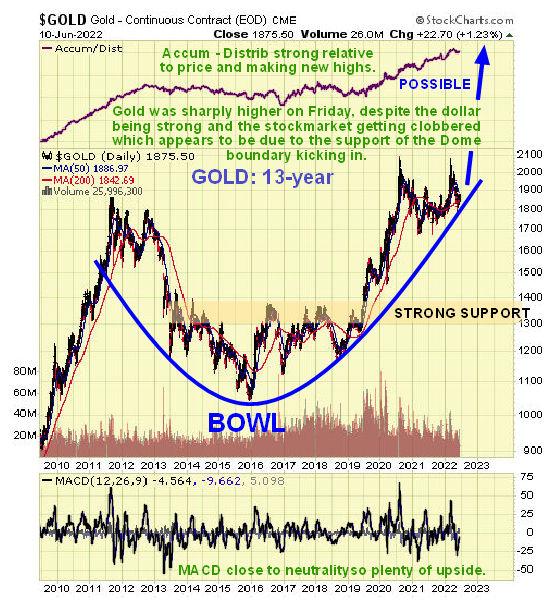
We can see why gold would break ranks here and advance on its 13-year chart, which reveals that the lengthy consolidation pattern from the August 2020 highs has allowed time for the boundary of the giant Bowl pattern shown to catch up to the price, the better to propel it higher. Note here that the pattern may also be described as a Cup & Handle that corresponds to the Cup & Handle that we have have delineated on the long-term silver chart, with the Handle being the consolidation pattern that has built out from the August 2020 high, but as we have a fit with our Bowl pattern, and adding the Cup & Handle on the chart would create clutter, we can leave it at thew Bowl pattern for now. What is certainly clear is that after having consolidated for almost 2 years now and inflation rapidly gathering pace, we could see a really big upleg from here, such that the $2000 level quickly disappears in the rear view.
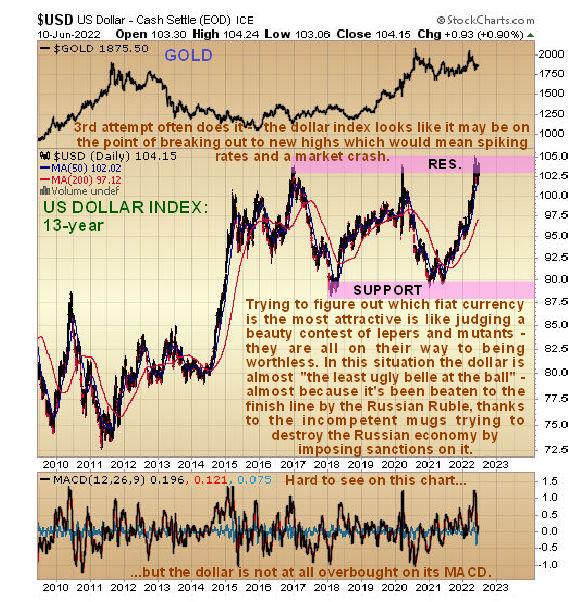
With the debt market getting ever closer to blowing to smithereens and the stockmarket inching towards an all-out crash in consequence it would seem that the dollar and gold are “brothers in arms” near-term as safe havens, even if the dollar is destined to end up in the ditch along with all other fiat. For now though the dollar is “the least ugly belle at the ball” because of its universality and the long habit of fleeing into it at times of crisis. Least ugly that is with the exception of the Russian Ruble. The malicious attempt to sabotage the Russian economy by the West by means of sanctions and the outright theft of its foreign assets is backfiring spectacularly which is why the Ruble is doing so well. Russia’s demands with respect to the Ukraine were perfectly reasonable – it did not want Ukraine joining NATO and then having loads of missiles pointed at it from the eastern Ukrainian border and the Russian speaking population of Eastern Ukraine being victimized by Ukraine’s Nazi thugs. Because these reasonable demands were not met, Russia had no option but to use force. The reason for the pathological hatred of Russia by NATO and the Western powers is not entirely clear but is thought to be related to geriatric old politicians who can’t get over the fact that the Soviet Union no longer exists, and also due to what psychologists call “projection” – the need to have someone to hate and victimize, apart from their own citizens of course. Russia’s attitude has been pragmatic throughout and it has said “OK, if you don’t want our gas and oil, minerals and wheat etc, there are plenty of other buyers in Asia etc who do. The globalist leaders in Brussels clearly have zero concern for their own citizens and are entirely preoccupied with the priorities of the World Economic Forum and Agenda 2030 etc, which means that, having alienated Russia and destroyed mutually beneficial relationships with it, Europe is destined to become even more of an economic basket case with its citizens set to freeze in the dark next Winter.
When we look at the long-term 13-year chart for the dollar index, we see that it is on the point of breaking out upside from the gigantic trading range that it has been stuck in since 2015 – this is the 3rd attempt at this and it is often the 3rd attempt that does it. If the debts markets blow up and stockmarkets tank there will clearly be an awful lot of funk money fleeing into cash and this time probably gold.
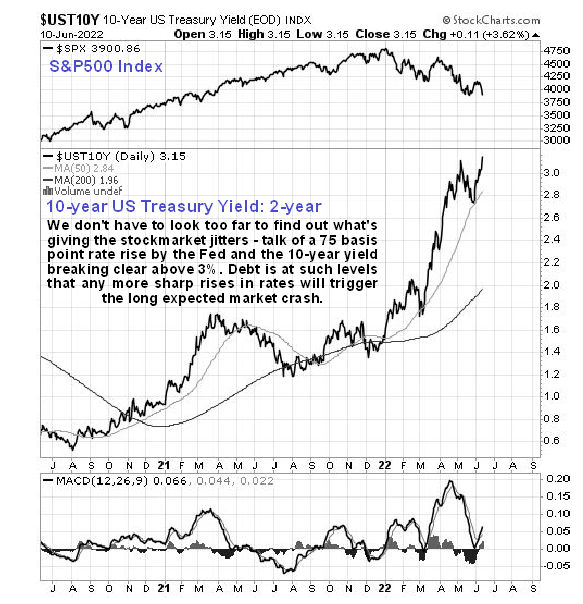
With inflation ramping up spectacularly, interest rates are grudgingly playing catchup and limping along behind. The rises in rates that we are likely to see will not be enough to contain inflation, which thanks to rabid money creation is fast heading in the direction of hyperiflation, but will be enough to implode the debt markets and crash global stockmarkets and burst housing bubbles. On our 2-year chart for the 10-year US Treasury Yield we can quickly see why stockmarkets got clobbered this Spring – the yield broke out at the start of the year and rose sharply. Now, after a pause that has allowed markets to unwind their oversold conditions, it looks like it is set to march higher again and Friday’s rise to new highs and talk of the Fed raising rates by 75 basis points this coming week is what the stockmarket to drop hard on Friday. So if the 10-year yield continues to advance from here, we can expect markets to tank.
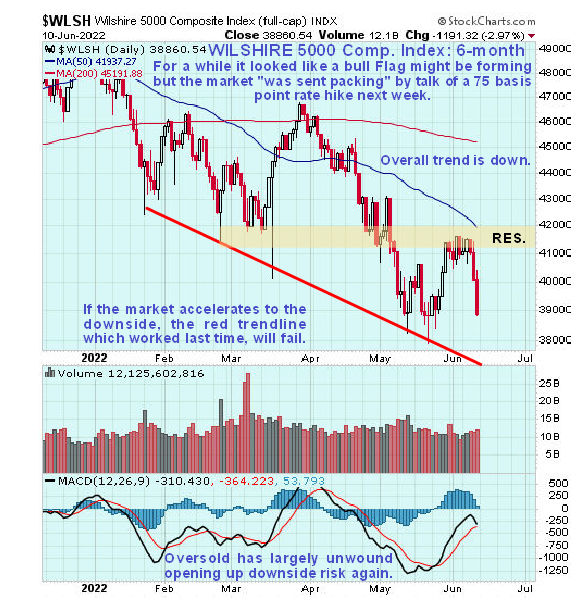
On the 6-month chart for the Wilshire 5000 index we can see how the market started to head south again on Thursday and Friday and looks like it is headed to the red trendline as a mínimum short-term downside objective.
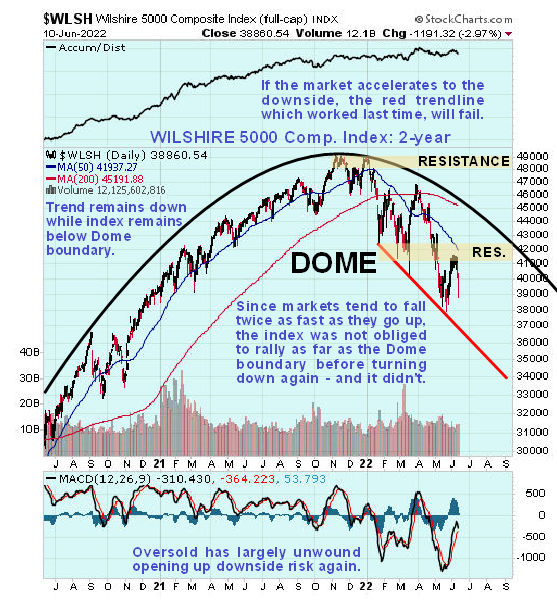
On the 2-year chart for the Wilshire 5000 we can see that the market is now in ragged retreat beneath the giant Distribution Dome shown and for practical purposes it can be considered to be a bearmarket as long as it remains below the Dome boundary. A very important point to note is that, since markets tend to fall twice as fast as they go up, this index is not obliged to rally up to the Dome boundary again and may contrinue to accelerate to the downside. Note the now very bearish alignment of the moving averages.
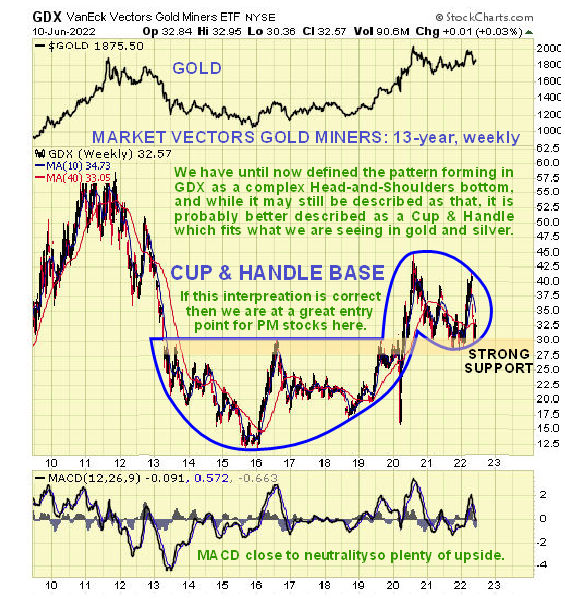
So how does the long-term 13-year chart for the Market Vectors Gold Miners (GDX) look now? It couldn’t look better as this ETF, which is good barometer of gold stocks generally, looks like it is in the very late stages of a giant Cup & Handle base, which can also be classified as a giant complex Head-and-Shoulders bottom, and is also at strong support near to the lower boundary of the Handle of the pattern, meaning that, if this interpretation is correct, we are at an excellent point to buy. Don’t be thrown by this chart saying that it only rose 0.03%, it is a weekly chart, and GDX actually rose 4.7% Friday, putting in a big “bullish engulfing pattern” at a time when the broad market dropped hard, so that GDX looks like it put in a Double Bottom late last week with its mid-May lows.
Read Full Story »»»
 DiscoverGold
Information posted to this board is not meant to suggest any specific action, but to point out the technical signs that can help our readers make their own specific decisions. Caveat emptor!
• DiscoverGold
Recent GDX News
- YieldMax GDXY Name Change • GlobeNewswire Inc. • 01/25/2024 04:22:00 PM
- Surging S&P 500 Breadth • ValueWalk • 07/19/2023 03:16:37 PM
- S&P 500 Corrects In Breadth • ValueWalk • 07/18/2023 03:08:49 PM
- If The USDX Fell So Much, Why Didn’t Gold Truly Soar? • ValueWalk • 07/17/2023 05:16:20 PM
- USD’s Decline That’s… Bearish For Gold?! • ValueWalk • 07/12/2023 02:38:08 PM
- S&P 500 Late Day Reversal Worry • ValueWalk • 07/10/2023 03:17:34 PM
- Massive Gaming Celebrates Global Launch of House of Blackjack with USDC Earning Race • ValueWalk • 07/10/2023 02:44:17 PM
- Breathers In Mining Stocks Are Not Real Rallies • ValueWalk • 07/06/2023 05:20:55 PM
- S&P 500 Character Changes • ValueWalk • 07/06/2023 03:10:06 PM
- S&P 500 – As Bullish As It Gets • ValueWalk • 07/03/2023 04:01:21 PM
- The Great Gold Migration: How Asia Is Dominating The Global Gold Landscape • ValueWalk • 06/30/2023 05:07:35 PM
- S&P 500 Dip Buying And Tame PCE • ValueWalk • 06/30/2023 03:34:13 PM
- The Bullish Reversal In Gold Is Coming • ValueWalk • 06/29/2023 04:00:44 PM
- Insufficient S&P 500 Rotations • ValueWalk • 06/27/2023 02:41:42 PM
- Failing S&P 500 Rotations • ValueWalk • 06/23/2023 03:09:19 PM
- Countdown to S&P 500 Downleg • ValueWalk • 06/19/2023 01:49:20 PM
- Now THAT Was The Game-Changer For The Price Of Gold! • ValueWalk • 06/15/2023 04:40:35 PM
- S&P 500 Manages To Recover Initial Decline • ValueWalk • 06/15/2023 03:30:07 PM
- S&P 500 Manages To Recover From Tech-Driven Decline • ValueWalk • 06/15/2023 03:30:07 PM
- S&P 500 Withstands The Initial Selling – No Hike Tomorrow • ValueWalk • 06/13/2023 03:15:19 PM
- Roadmap For Mining Stocks – Courtesy Of The Stock Market • ValueWalk • 06/06/2023 03:17:49 PM
- Stocks To Still Extend S&P 500 Upswing • ValueWalk • 06/05/2023 03:31:02 PM
- AI, Stocks, And Gold Stocks – Connected After All • ValueWalk • 05/31/2023 03:29:15 PM
- Could Gold Miners Finally Stop Sliding?! • ValueWalk • 05/26/2023 08:42:37 PM
Avant Technologies Engages Wired4Tech to Evaluate the Performance of Next Generation AI Server Technology • AVAI • May 23, 2024 8:00 AM
Branded Legacy, Inc. Unveils Collaboration with Celebrity Tattoo Artist Kat Tat for New Tattoo Aftercare Product • BLEG • May 22, 2024 8:30 AM
"Defo's Morning Briefing" Set to Debut for "GreenliteTV" • GRNL • May 21, 2024 2:28 PM
North Bay Resources Announces 50/50 JV at Fran Gold Project, British Columbia; Initiates NI 43-101 Resources Estimate and Bulk Sample • NBRI • May 21, 2024 9:07 AM
Greenlite Ventures Inks Deal to Acquire No Limit Technology • GRNL • May 17, 2024 3:00 PM
Music Licensing, Inc. (OTC: SONG) Subsidiary Pro Music Rights Secures Final Judgment of $114,081.30 USD, Demonstrating Strength of Licensing Agreements • SONGD • May 17, 2024 11:00 AM

