


| Followers | 687 |
| Posts | 142406 |
| Boards Moderated | 35 |
| Alias Born | 03/10/2004 |
Thursday, June 09, 2022 4:37:24 PM
By: Jordan Roy-Byrne | June 9, 2022
If you follow my work, you know I love studying market history and employing analogs. Market moves of the past can inform the future.
It has been a while since I’ve updated the analogs for Gold.
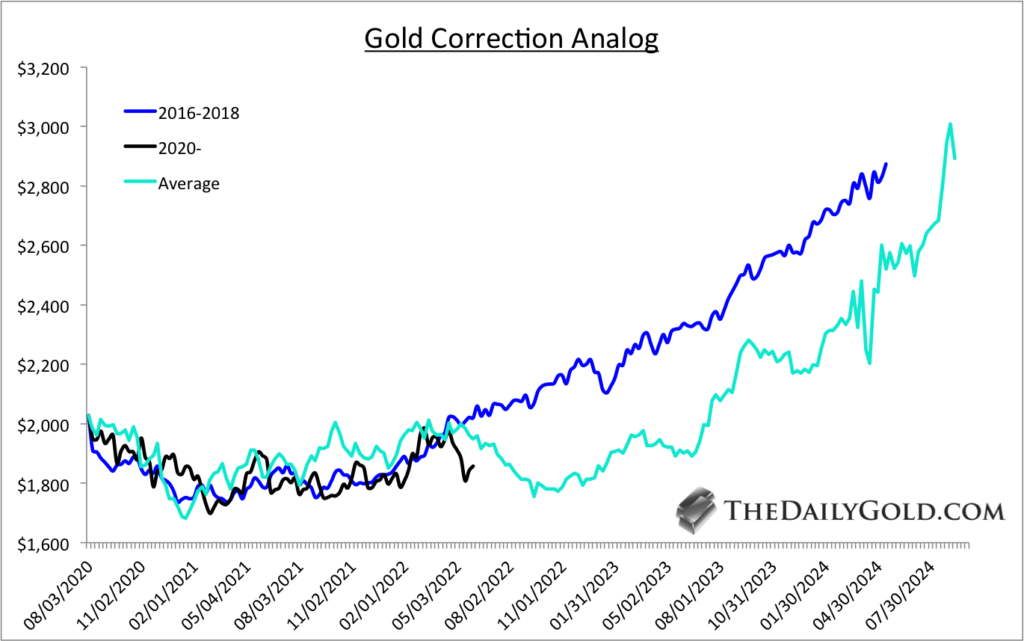
Gold was tracking the average of all bull market corrections and the ensuing rebounds until the recent decline below $1900.
As a result, the best historical comparison is the 2016 to 2018 correction. That correction ended a few months before the Fed’s last rate hike in that cycle, and later Gold broke above 6-year resistance when the Fed cut interest rates.
The average and the 2016-2018 analog put Gold around $3000 in two years.
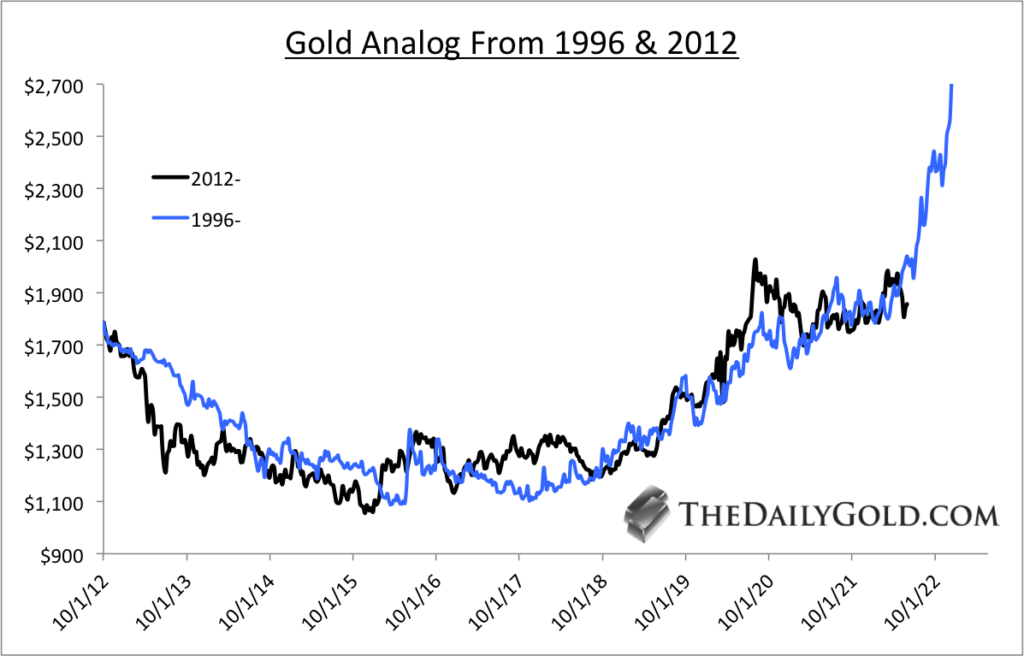
The best comparison from a bird’s eye view perspective continues to be the 1996 to 2005 period as it applies to the last nine years.
Gold exploded in late 2005 after an 18-month-long consolidation that was part of an irregular cup and handle pattern.
The current cup and handle pattern is larger, fits the textbook parameters, and is more bullish. However, it could take more time to complete.
The outcome is likely to be similar as a breakout past $2100 would lead to a vertical move.
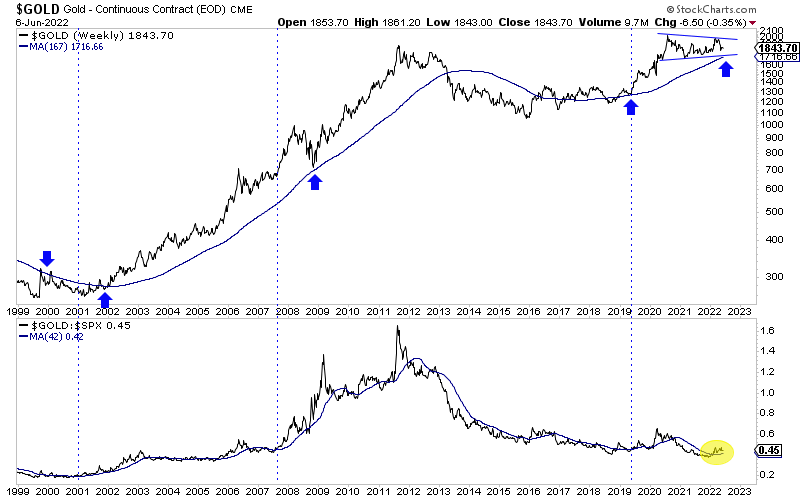
Gold appears to be trading in a very bullish consolidation pattern. It could test even the low $1700s and remain in a very bullish consolidation.
The Gold to S&P 500 ratio is trending higher and above an upward sloping 200-day moving average. See the yellow.
The blue vertical lines show the start of Fed rate cut cycles. The Fed shifting its policy later this year could be the trigger for the significant breakout in Gold.
Investors may have a few more months to accumulate high-quality juniors at very good values.
I continue to be laser-focused on finding quality juniors with at least 5 to 7 bagger potential over the next few years.
Read Full Story »»»
 DiscoverGold
Information posted to this board is not meant to suggest any specific action, but to point out the technical signs that can help our readers make their own specific decisions. Caveat emptor!
• DiscoverGold
Recent GDX News
- YieldMax GDXY Name Change • GlobeNewswire Inc. • 01/25/2024 04:22:00 PM
- Surging S&P 500 Breadth • ValueWalk • 07/19/2023 03:16:37 PM
- S&P 500 Corrects In Breadth • ValueWalk • 07/18/2023 03:08:49 PM
- If The USDX Fell So Much, Why Didn’t Gold Truly Soar? • ValueWalk • 07/17/2023 05:16:20 PM
- USD’s Decline That’s… Bearish For Gold?! • ValueWalk • 07/12/2023 02:38:08 PM
- S&P 500 Late Day Reversal Worry • ValueWalk • 07/10/2023 03:17:34 PM
- Massive Gaming Celebrates Global Launch of House of Blackjack with USDC Earning Race • ValueWalk • 07/10/2023 02:44:17 PM
- Breathers In Mining Stocks Are Not Real Rallies • ValueWalk • 07/06/2023 05:20:55 PM
- S&P 500 Character Changes • ValueWalk • 07/06/2023 03:10:06 PM
Freedom Holdings Corporate Update; Announces Management Has Signed Letter of Intent • FHLD • Jul 3, 2024 9:00 AM
EWRC's 21 Moves Gaming Studios Moves to SONY Pictures Studios and Green Lights Development of a Third Upcoming Game • EWRC • Jul 2, 2024 8:00 AM
BNCM and DELEX Healthcare Group Announce Strategic Merger to Drive Expansion and Growth • BNCM • Jul 2, 2024 7:19 AM
NUBURU Announces Upcoming TV Interview Featuring CEO Brian Knaley on Fox Business, Bloomberg TV, and Newsmax TV as Sponsored Programming • BURU • Jul 1, 2024 1:57 PM
Mass Megawatts Announces $220,500 Debt Cancellation Agreement to Improve Financing and Sales of a New Product to be Announced on July 11 • MMMW • Jun 28, 2024 7:30 AM
VAYK Exited Caribbean Investments for $320,000 Profit • VAYK • Jun 27, 2024 9:00 AM

