 News
News  Market Data
  Discover

Support: 888-992-3836
Copyright © 2023 InvestorsHub Inc.


Register for free to join our community of investors and share your ideas. You will also get access to streaming quotes, interactive charts, trades, portfolio, live options flow and more tools.
** This board is CLOSED to posting **
 DiscoverGold
Today marks 20 year anniversary of exemplary work service on this board. Chichi2 was a source of inspiration and positivity and with his knowledge, contribution, and dedication to the board he made these 20 years colorful, fun, and full of success.
The board will permanently be closed after today.
Thank you to ALL posters and followers for the high level of service that you provided. Wishing you more successes and best wishes always!
DiscoverGold
US Equity Fund Inflows $6.2 Billion; Taxable Bond Fund Inflows $2 Billion
By: Refinitiv | July 6, 2023
• FUND FLOW REPORTS FOR THE WEEK ENDED 07/05 ARE NOW AVAILABLE.
For the week ended 07/05/2023 ExETFs - All Equity funds report net outflows totaling -$7.130 billion, with Domestic Equity funds reporting net outflows of -$5.897 billion and Non-Domestic Equity funds reporting net outflows of -$1.233 billion...ExETFs - Emerging Markets Equity funds report net outflows of -$0.420 billion...Net inflows are reported for All Taxable Bond funds of $1.973 billion, bringing the rate of inflows for the $2.971 trillion sector to $2.166 billion/week...International & Global Debt funds posted net outflows of -$0.001 billion...Net inflows of $1.620 billion were reported for Corp-Investment Grade funds while High Yield funds reported net outflows of -$0.283 billion...Money Market funds reported net inflows of $15.564 billion...ExETFs - Municipal Bond funds report net outflows of -$0.655 billion.
Read Full Story »»»
DiscoverGold
Money managers Increased their exposure to the US Equity markets since last week...
DiscoverGold
NAAIM Exposure Index
July 6, 2023 
The NAAIM Number
83.11
Last Quarter Average
63.74
»»» Read More…
Stellar NASDAQ 1st Half Dampens July and Q3 Performance
By: Almanac Trader | July 6, 2023
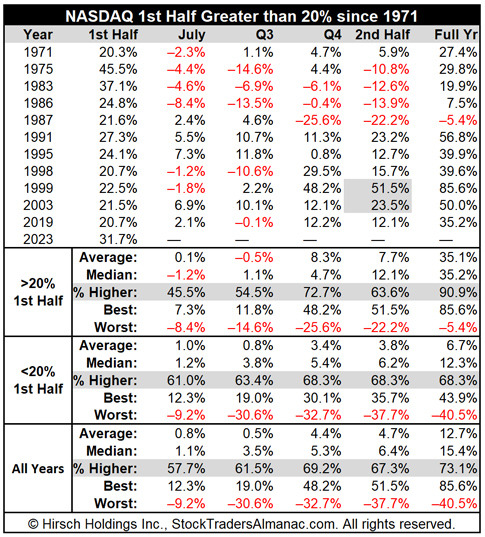
NASDAQ finished the first half of 2023 with a stellar 31.7% gain. This is NASDAQ’s third best first half ever. Only 1975 and 1983 were better. In the following table we compiled all years since 1971 when NASDAQ was up 20% or more in the first half. Reviewing the table, we observed only two times out of the past eleven where the second half of the year was better than the first half (1999 and 2003). July and Q3 were also below average following a 20%+ first half gain while Q4 was better than average.
This reinforces our existing tepid outlook for Q3. Today’s much stronger than anticipated jobs data has increased expectations for another Fed interest rate hike and added more uncertainty as to when the Fed will eventually pause. Increasing uncertainty is likely to lead to more volatility and a sideways to possibly lower market during the historically weak third quarter.
Read Full Story »»»
DiscoverGold
NASDAQ Composite Index (COMP): Summary Analysis
By: Marty Armstrong | July 6, 2023
NASDAQ Composite Index Cash closed today at 1379165 and is trading up about 31% for the year from last year's settlement of 1046648. The market opened quite weak below the previous session's low 1377341 reaching 1376425 intradaylower making it an outside reversal to the downside as it exceeded the previous high and penetrated the previous low yet closed within that previous trading range. Our projected support for tomorrow's closing lies at 1374678. Therefore, this closed lower and it was weak going into the close.
Clearly, this market is still above the critical support point at this time, which lies at 1360849. Initial support lies at 1371736. This market has exceeded intraday 2 of three projected resistance points and it has closed below 2 others. Our underlying pivot providing some support lies at 1374678. At present, the projected extreme resistance stands at 1393006.
Additionally, our central point cyclical study models also ended in a bearish mode for the closing warning that the upward momentum is subsiding. We did close below the previous session's Intraday Crash Mode support indicator at 1376517 settling at 0 which alerted us to a further decline was likely going into the instant session. The Intraday Crash indicator for the next session will be 1375658. Now since we closed back above this indicator in the current trading session, then holding above this indicator for the next session will imply the decline is subsiding. The Secondary Intraday Crash Mode support lies at 1341026 which we are trading above at this time. A breach of this level with a closing below will signal that a sharp decline is possible.
Intraday Projected Crash Mode Points
Today...... 0
Previous... 1376517
Tomorrow... 1375658
This market has not closed above the previous cyclical high of 1386406. Obviously, it is pushing against this resistance level.
MARKET OVERVIEW
NEAR-TERM OUTLOOK
The historical perspective in the NASDAQ Composite Index Cash included a rally from 2009 moving into a major high for 2021, the market has been in a bearish trend since the high moving into the low in 2022 for a declining trend during that year. The last Yearly Reversal to be elected was a Bullish at the close of 2022. However, the market has been unable to exceed that level intraday since then.
This market remains in a positive position on the weekly to yearly levels of our indicating models. Nevertheless, it closed last year on the weak side down from 2021. Pay attention to the Monthly level for any serious change in long-term trend ahead.
The perspective using the indicating ranges on the Daily level in the NASDAQ Composite Index Cash, this market remains moderately bullish currently with underlying support beginning at 1361853.
On the weekly level, the last important high was established the week of June 12th at 1386406, which was up 13 weeks from the low made back during the week of March 13th. We have seen the market rally thus far reaching this week 1384450.
INTERMEDIATE-TERM OUTLOOK
YEARLY MOMENTUM MODEL INDICATOR
Our Momentum Models are declining at this time with the previous high made 2021 while the last low formed on 2022. However, this market has rallied in price with the last cyclical high formed on 2021 and thus we have a divergence warning that this market is starting to run out of strength on the upside.
Interestingly, the NASDAQ Composite Index Cash has been in a bullish phase for the past 8 months since the low established back in October 2022.
Critical support still underlies this market at 1340400 and a break of that level on a monthly closing basis would warn that a sustainable decline ahead becomes possible. Immediately, the market is trading within last month's trading range in a neutral position.
DiscoverGold
" 'n I thank you, Theo " .. !!
Thanks for your contributions! 
Today, I respectfully bow out now and make way for DG to take the board home.
It was an honor to be here ...
Is the Market Still Overvalued?
By: Jennifer Nash | July 5, 2023
Here is a summary of the four market valuation indicators we update monthly.
• The Crestmont Research P/E ratio (more)
• The cyclical P/E ratio using the trailing 10-year earnings as the divisor (more)
• The Q ratio, which is the total price of the market divided by its replacement cost (more)
• The relationship of the S&P composite price to a regression trendline (more)
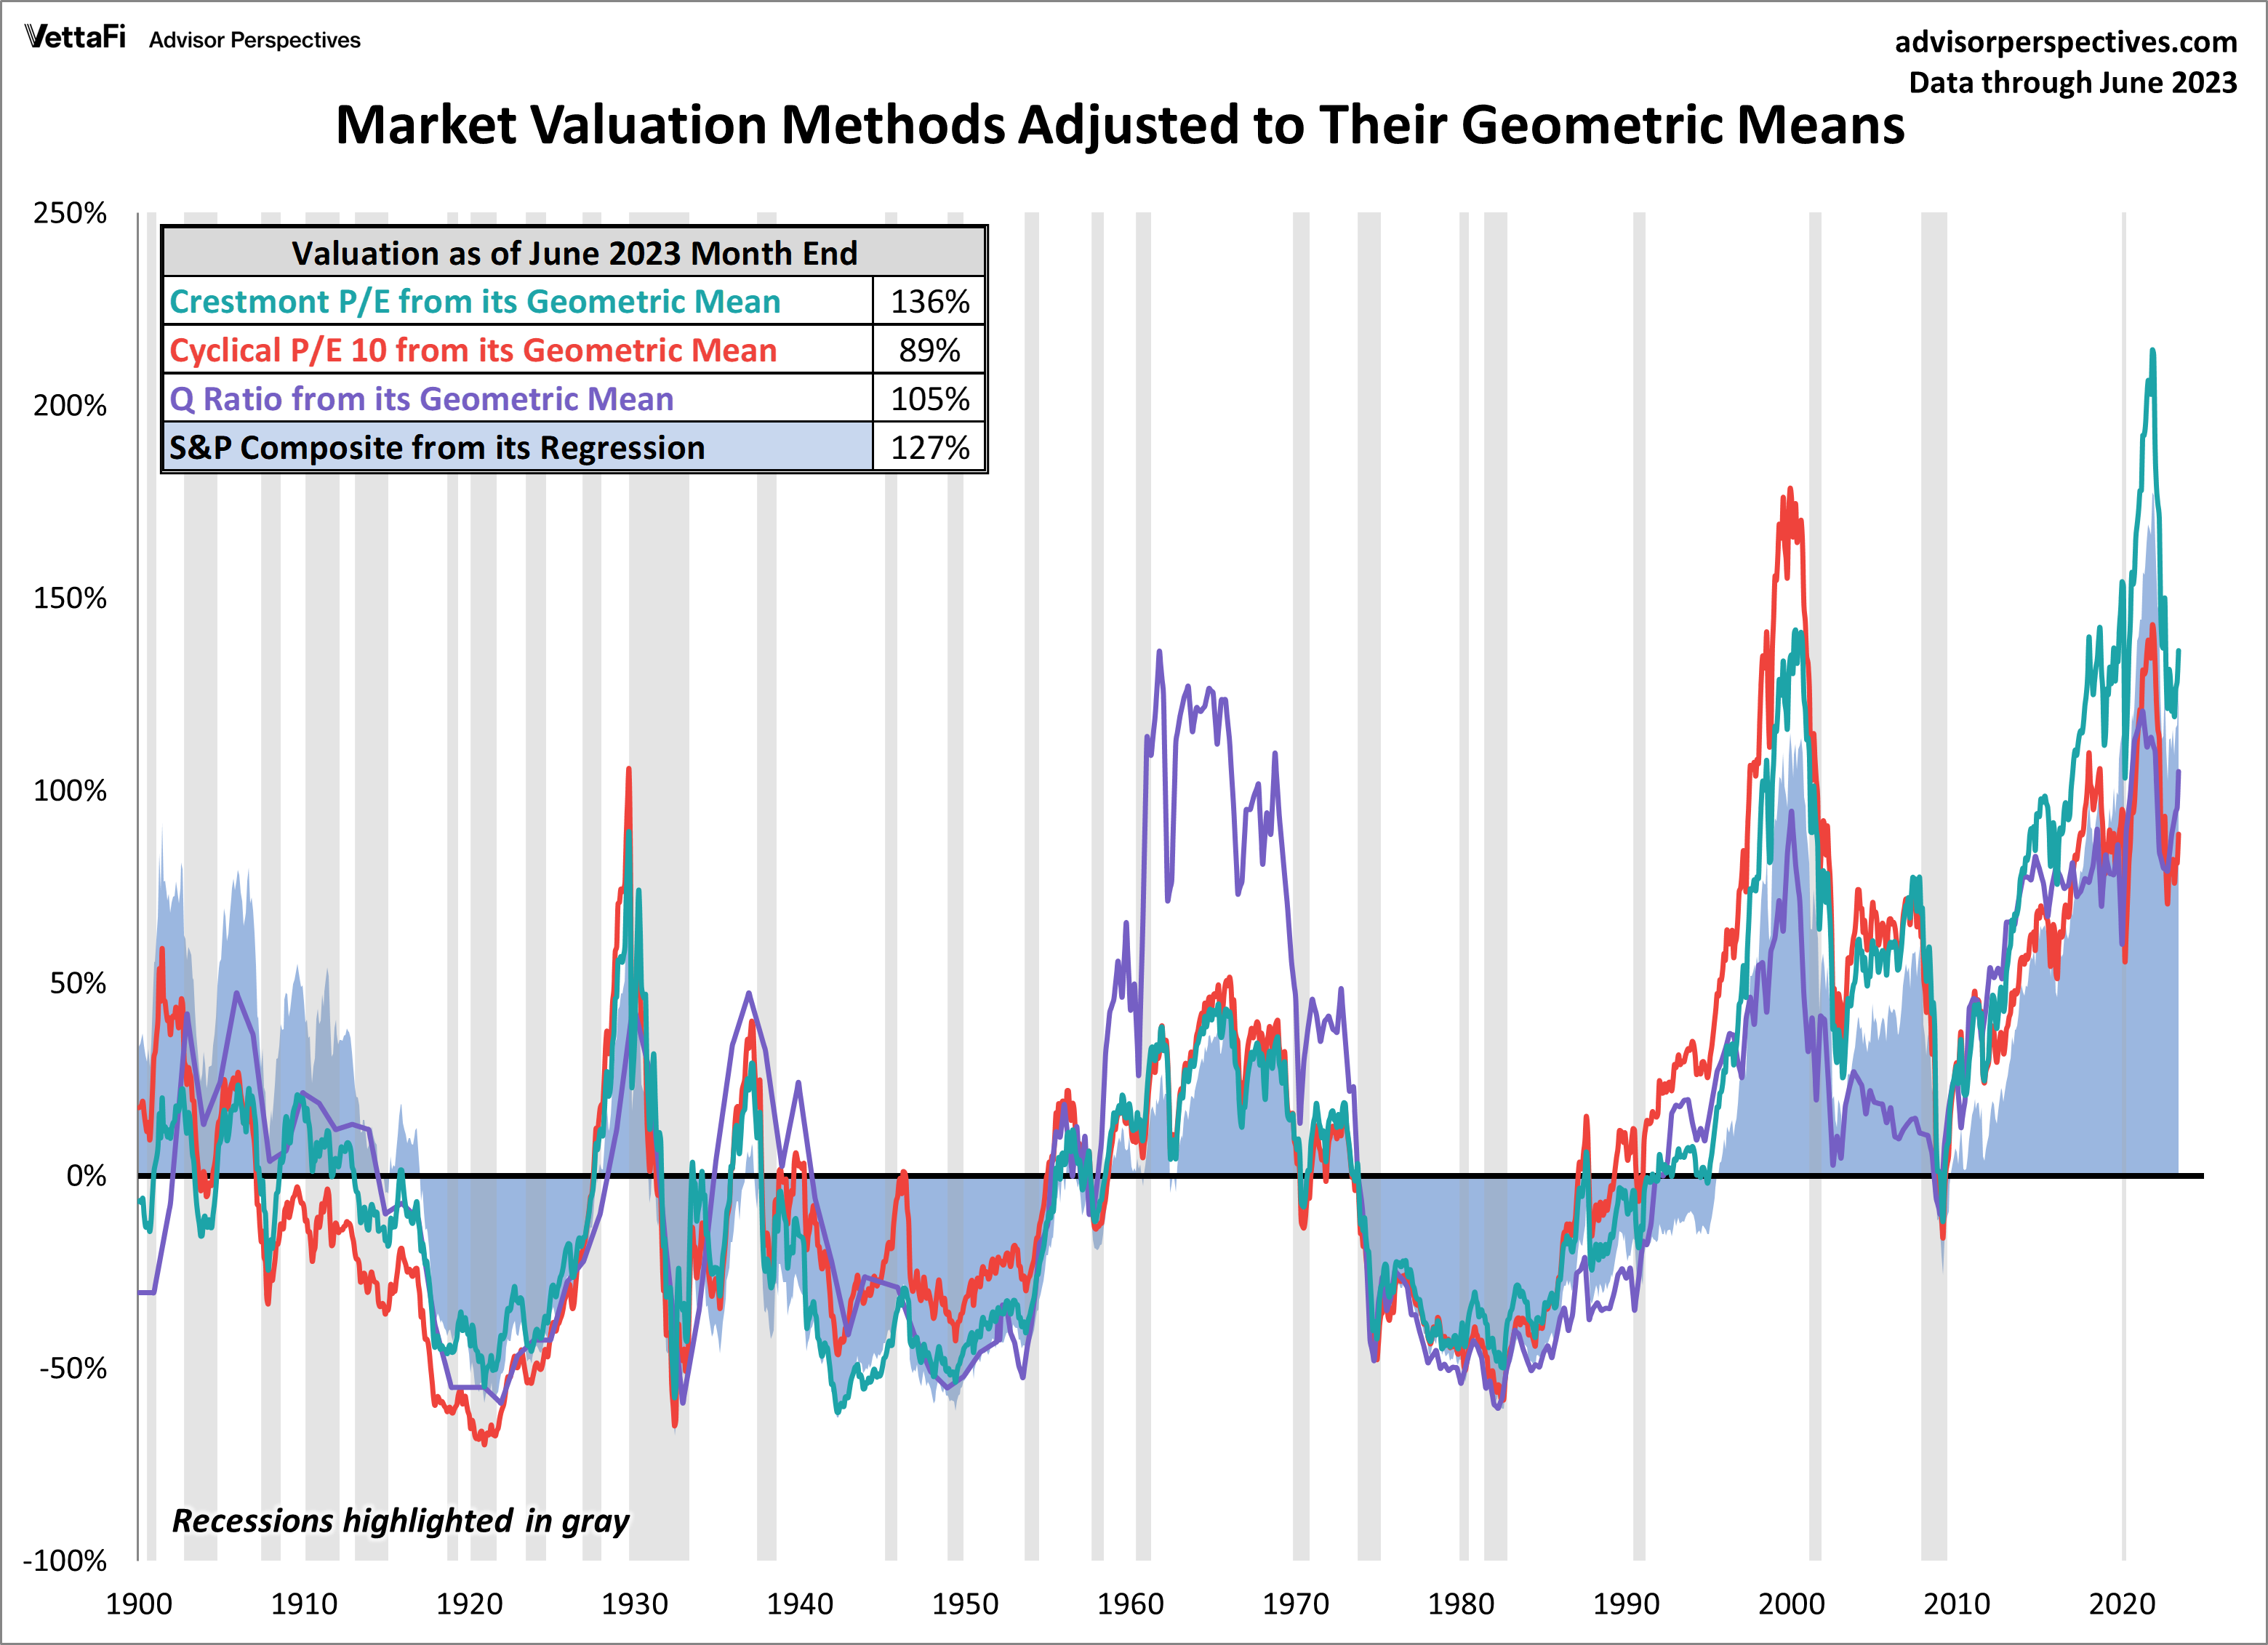
To facilitate comparisons, we've adjusted the two P/E ratios and Q ratio to their arithmetic means and the inflation-adjusted S&P composite to its exponential regression. Thus the percentages on the vertical axis show the over/undervaluation as a percent above mean value, which we're using as a surrogate for fair value. Based on the latest S&P 500 monthly data, the market is overvalued somewhere in the range of 72% to 127%, depending on the indicator, up from last month's 65% to 117%.
We've plotted the S&P regression data as an area chart type rather than a line to make the comparisons a bit easier to read. It also reinforces the difference between the line charts — which are simple ratios — and the regression series, which measures the distance from an exponential regression on a log chart.

The chart below differs from the one above in that the three of our market valuation indicators, Crestmont P/E, P/E10, and Q-Ratio, are adjusted to their geometric mean rather than their arithmetic mean (which is what most people think of as the "average"). The geometric mean increases our attention to outliers. In our view, the first chart does a satisfactory job of illustrating these four approaches to market valuation, but we've included the geometric variant as an interesting alternative view for the two P/Es and Q ratios. In this chart, the range of overvaluation would be in the range of 89% to 136%, up from last month's 81% to 129%.
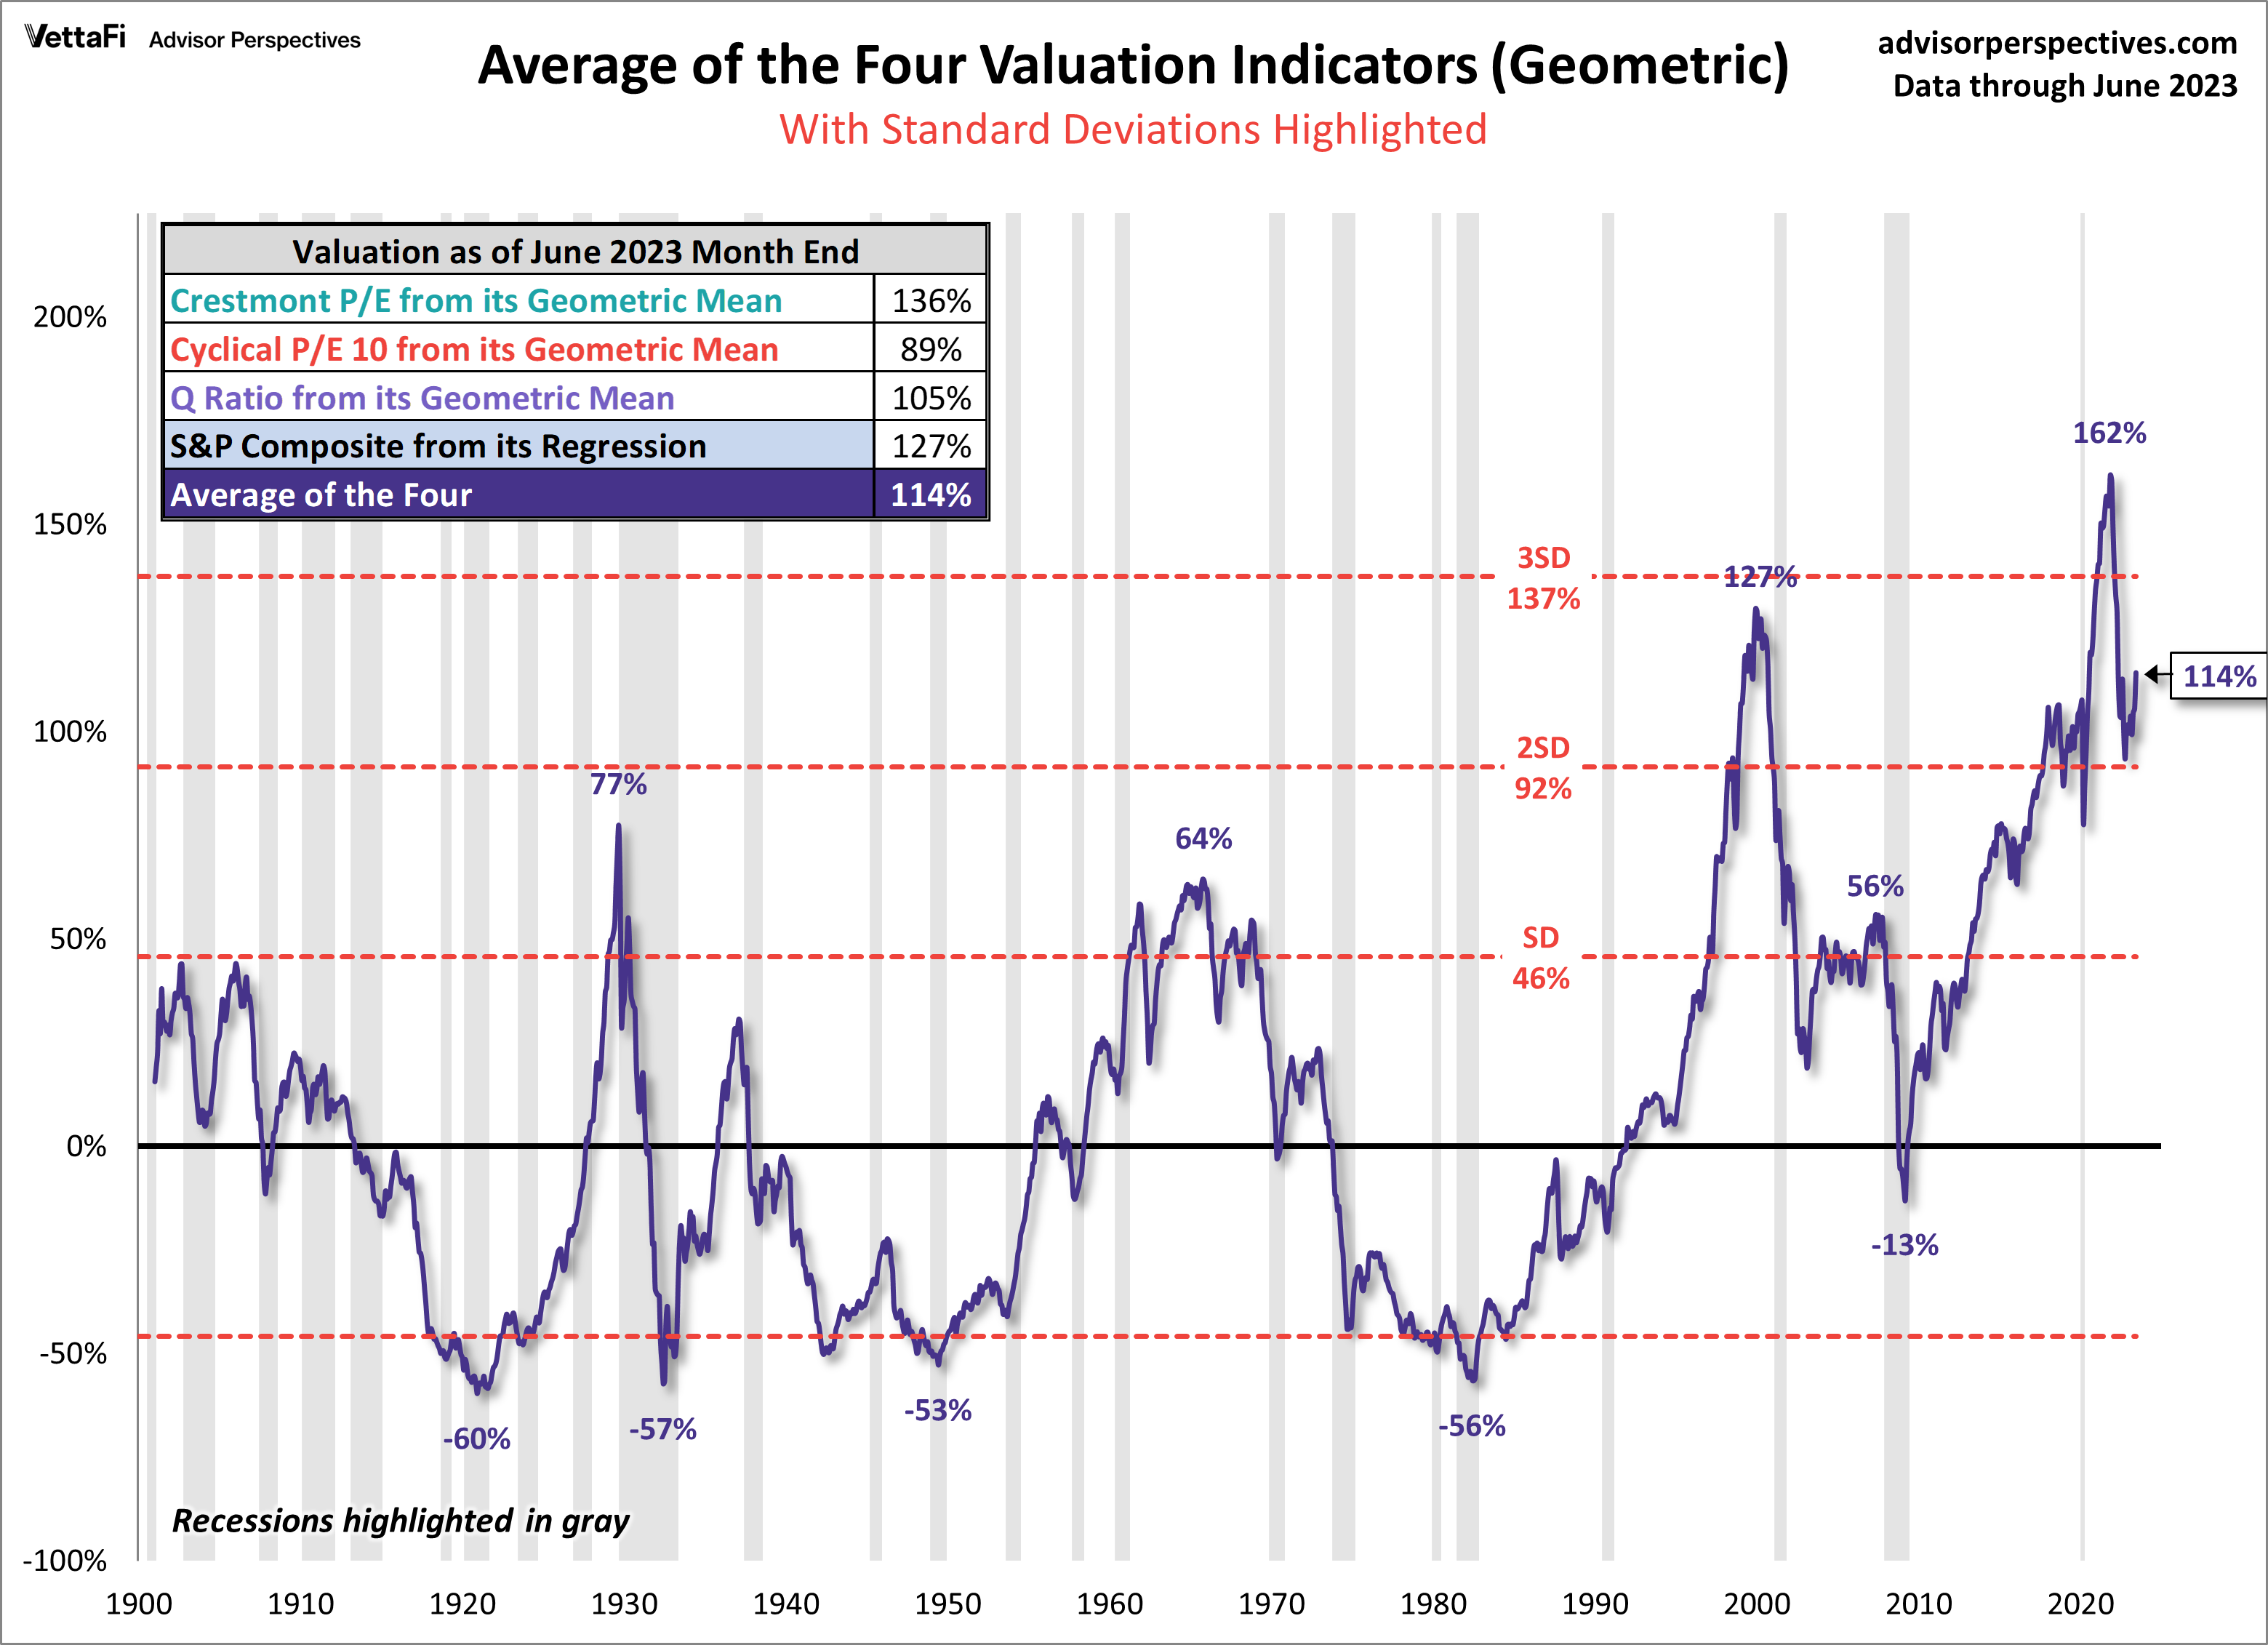
The average of the four valuation indicators
The next chart gives a simplified summary of valuations by plotting the average of the four arithmetic series (the first chart above) along with the standard deviations above and below the mean.
At the end of June, the average of the four is 100% — up from 92% the previous month.

Here is the same chart, this time with the geometric mean and deviations. The latest value of 114% is up from 106% last month.
As we've frequently pointed out, these indicators aren't useful as short-term signals of market direction. Periods of over- and under-valuation can last for many years. But they can play a role in framing longer-term expectations of investment returns. For more on that topic, see our monthly update: Market Valuation, Inflation, and Treasury Yields: Clues from the Past.
Market Valuation and Actual Subsequent 10-Year Total Returns
Many of our readers have requested we reproduce a chart by John Hussman that inverts the S&P 10-year total returns. Hussman says “the most reliable correlation between valuations and subsequent returns is on a 12-year horizon, which is the point where the autocorrelation profile of valuations typically hits zero.” The correlation of valuations Hussman uses for comparison are at about 90%.
You will notice that nominal returns are used – this is a direct result of a sort of Fisher-effect in which inflation ends up being washed out of the calculation. The nominal growth rate of the economy is highly correlated with the level of interest rates, but also negatively correlated with market valuations, all over the same time period.
Here are the geometric average of the four again and the recreated Hussman charts together. Please again note that the Hussman returns chart is inverted.

Points of ‘secular’ undervaluation such as 1922, 1932, 1949, 1974 and 1982 typically occurred about 50% below historical mean valuations, and were associated with subsequent 10-year nominal total returns approaching 20% annually. By contrast, valuations similar to 1929, 1965 and 2000 were followed by weak or negative total returns over the following decade. That’s the range where we find ourselves today. Of course, we also won’t be surprised if the S&P 500 ends up posting weak or negative total returns in the 2007-2017 decade, which would require nothing but a run-of-the-mill bear market over the next couple of years. - John Hussman
Read Full Story »»»
DiscoverGold
Moderna strikes deal to develop mRNA drugs in China >>
https://www.cnbc.com/2023/07/05/moderna-strikes-deal-to-develop-mrna-drugs-in-china-.html
Stocks Under Pressure On Weak Chinese Economic News
By: Barchart | July 5, 2023
Morning Markets
September E-Mini S&P 500 futures (ESU23) this morning are down -0.52%, and Sep Nasdaq 100 E-Mini futures (NQU23) are down -0.61%.
U.S. stock index futures this morning are moderately lower. Global stocks are under pressure today after weaker-than-expected news on China’s services industry sparked concerns about the outlook for the global economy. The China Caixin Jun services PMI fell -3.2 to a 5-month low of 53.9, weaker than expectations of 56.2.
Today's June 13-14 FOMC meeting minutes will be scrutinized to see how hawkish policymakers will remain after they held rates steady but said that inflation has proved stickier than expected. Since last month's policy meeting, mostly positive U.S. economic data has priced out rate cuts this year and pushed the terminal rate up slightly.
The Wall Street Journal announced the U.S. is preparing to curb Chinese companies access to cloud-computing services to train AI models, including those provided by Amazon.com and Microsoft.
The markets are discounting the odds at 83% for a +25 bp rate hike at the next FOMC meeting on July 25-26. The markets are anticipating a peak funds rate of 5.42% by November, which is +34 bp higher than the current effective federal funds rate of 5.08%.
Global bond yields are mixed. The 10-year T-note yield is up +2.4 bp at 3.878%. The 10-year German bund yield is down -0.1 bp at 2.452%, and the 10-year UK Gilt yield is up +2.9 bp at 4.444%.
Overseas stock markets are lower. The Euro Stoxx 50 is down -0.77%. China’s Shanghai Composite Index today closed -0.69%. Japan’s Nikkei Stock Index today closed -0.25%.
The Euro Stoxx 50 today is moderately lower and followed losses in Asian markets. Mining stocks and metals producers are declining on industrial metals concerns from China after weaker-than-expected news on China’s service sector. Also, signs of weakness in the Eurozone economy are undercutting stocks after the Eurozone S&P Jun composite PMI was revised lower to show the steepest pace of contraction in 6 months. On the positive side, European government bond yields declined after Eurozone May PPI fell by the most in 2-1/2 years and after the ECB’s monthly inflation expectations survey showed inflation expectations declined.
The Eurozone S&P Jun composite PMI was revised lower by -0.4 to 49.9 from the initially reported 50.3, the steepest pace of contraction in 6 months.
Eurozone May PPI fell -1.5% y/y, weaker than expectations of -1.3% y/y and the biggest decline in 2-1/2 years.
The ECB's monthly inflation expectations survey showed inflation expectations for the next 12 months fell to 3.9% in May from 4.1% in April, but inflation expectations for the next 3 years were unchanged at 2.5% from April.
China’s Shanghai Composite closed moderately lower. Concerns about the fading recovery in the Chinese economy are weighing on Chinese stocks after today’s news showed the China Caixin Jun services PMI fell more than expected to a 5-month low. Also, property stocks retreated after defaulted developer Shimao Group Holdings Ltd failed to find a buyer for a $1.8 billion project at a forced auction, even at a heavy discount. The slump in China’s real estate market continues to weigh on the country’s economic prospects after a brief rebound from the ending of Covid restrictions has faded, with home sales resuming declines and property investment worsening. Goldman Sachs Group recently raised its projected default rate for Chinese high-yield property dollar bonds, and China Vanke Co, the country’s second-largest developer by sales, said the home market is “worse than expected.”
The China Caixin Jun services PMI fell -3.2 to a 5-month low of 53.9, weaker than expectations of 56.2.
Japan’s Nikkei Stock Index today posed modest losses as it consolidated just below last month’s 33-year high. Concerns that China’s post-Covid economic recovery is faltering is weighing on stocks on fears it will slow the global economy. The weakness in stocks sparked some safe-haven buying of the yen, which sparked the selling of Japanese exporter stocks. Strength in Japanese semiconductor stocks limited losses in the overall market after Goldman Sachs raised price targets on several companies due to an attractive outlook.
The Japan Jibun Bank Jun services PMI was revised downward by -0.2 to 54.0 from the initially reported 54.2.
Pre-Market U.S. Stock Movers
STMicroelectronics NV (STM) dropped more than -2% in pre-market trading after China imposed restrictions on exporting gallium and germanium, two metals crucial to parts of the chip industry.
Freeport-McMoRan (FCX) and ArcelorMittal (MT) slid more than -2% in pre-market trading as mining stocks dropped after copper and iron ore prices fell more than -1% as the latest negative economic news from China and the Eurozone fueled concerns over the demand outlook for industrial metals.
United Parcel Service (UPS) tumbled more than -2% in pre-market trading on strike concerns after talks between the company and the Teamsters union fell apart this morning.
Conagra Brands (CAG) slid more than -1% in pre-market trading after Jeffries downgraded the stock to hold from buy, citing concerns about near-term volume growth potential.
U.S. Steel (X) fell more than -2% in pre-market trading after BXP Paribas Exane downgraded the stock to neutral from outperform.
Rivian Automotive (RIVN) climbed more than +5% in pre-market trading after it said it began delivering electric vans to Europe for Amazon.com, its first commercial shipments outside of the U.S.
MP Materials (MP) jumped more than +5% in pre-market trading after China announced it would restrict exports of rare earth specialty materials germanium and gallium.
Netflix (NFLX) gained more than +1% in pre-market trading after Goldman Sachs upgraded the stock to neutral from underperform, saying management has executed its password-sharing crackdown more efficiently than expected.
BioMarin Pharmaceutical (BMRN) climbed more than +4% in pre-market trading after BMO Capital Markets upgraded the stock to outperform from market perform with a price target of $102.
Today’s U.S. Earnings Reports (7/5/2023)
Burke & Herbert Financial Serv (BHRB), Gencor Industries Inc (GENC), NEXTracker Inc (NXT), SilverBow Resources Inc (SBOW), TuSimple Holdings Inc (TSP), Waldencast Plc (WALD).
Read Full Story »»»
DiscoverGold
Upgrades/Downgrades - Equity ratings changes direct from brokerage firms
By: Chichi2 | July 5, 2023
• Equity ratings changes direct from brokerage firms.
https://www.briefing.com/calendars/updown?Filter=All
Read Full Story »»»
DiscoverGold
UPS, Teamsters accuse each other of walking away >
https://www.cnbc.com/2023/07/05/teamsters-says-ups-has-walked-away-from-negotiations.html
$19 billion in trade stranded on water >
https://www.cnbc.com/2023/07/05/canadas-port-labor-negotiations-on-hold-19-billion-in-trade-stranded.html
Fireworks cause $59 million of property damage yearly >
https://www.cnbc.com/2023/07/04/fireworks-damage-your-insurance-policy-might-cover-that.html
DJIA has declined 9 of last 12 on day after July 4th
By: Almanac Trader | July 3, 2023

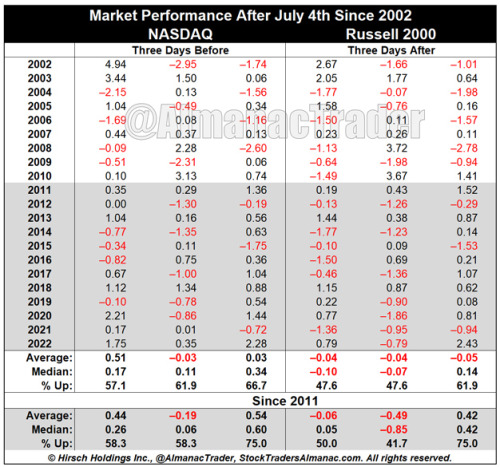
Trading ahead of the July 4th Independence Day holiday has historically been stronger than the day(s) after the holiday. This has become more pronounced in recent years and was the case again this year. However, over the past twelve years since 2011, trading after Independence Day has softened notably. DJIA has declined nine times in 12 years on the day after. S&P 500 has slipped seven times. Average performance remains fractionally positive. NASDAQ and Russell 2000 have been modestly better.
Read Full Story »»»
DiscoverGold
The Best/Worst Performing Stocks in the S&P 500 this year...
By: Charlie Bilello | July 3, 2023
• The best performing stocks in the S&P 500 this year...

• The worst performing stocks in the S&P 500 this year...

Read Full Story »»»
DiscoverGold
S&P 500 opens little changed in shortened session to kick off the second half: Live updates
This is a developing news story. Please check back for updates:
https://www.cnbc.com/2023/07/02/stock-market-today-live-updates.html
NYAD Recovers and Gathers Upside Momentum
By: Joe Duarte | July 2, 2023
Three weeks before the Fed's next meeting, investors who have missed the AI/tech rally have thrown caution to the wind.
That urgency to catch up has led to an encouraging improvement in the market's breadth and a marginal new high in the S&P 500 index (SPX). The combination is likely setting the market up for what could be an impressive upward thrust. See below for full details.
And if June is any sign of what July may be, the bulls will be ruling the roost. Here are some grounding facts:
• The S&P 500 index (SPX) has returned an average of 3.3% in the month of July from 2012-2022.
• SPX rallied 9% in July 2022.
Of course, there are no guarantees that history will repeat. But it pays to be always ready. So, which sectors are likely to benefit? I have some thoughts just below.
Bond Yields Survive Yield Scare
I would not be surprised if the Fed joined the other global central banks that have raised interest rates in the last few weeks. However, from a trading standpoint, the action in bonds is more important, as bond yields have largely disagreed with the Fed's perception of the economy since late in 2022.
What I mean, of course, is that even as the Fed raised interest rates after October 2022, bond yields have fallen since then, setting up a divergence.
Certainly, there has been some volatility in yields. For example, the U.S. Treasury's Ten Year Note yield (TNX) bounced higher on 6/29/23, as a surprising upward revision of U.S. GDP to the 2% growth rate raised the odds of a rate hike at the upcoming FMOC meeting in mid-July. Yet, the flattening out of the Fed's favorite indicator, the PCE inflation gauge on 6/20/23, calmed things down.
That leaves the resistance band between 3.6-3.85% as the area to monitor. If TNX rises above 3.85%, we may see a move toward 4%, which would be very negative for stocks; especially the interest rate-sensitive homebuilders and real estate investment trusts (REITS).
The Fine Print in Housing Stats: Supply, Supply, Supply
As would be expected, as TNX flirted with 3.85%, there was a pullback in the homebuilder stocks. But as we've learned over the recent past, the correlation between the direction of bond yields and the action in the homebuilder stocks is nearly 100%. As a result, when bond yields, as I described above, hit resistance at 3.85% and turned lower, the homebuilder stocks regained their upward trend.
Overall, the housing sector continues to deliver mixed news. For example:
• New home sales recently rose - bullish for homebuilders.
• Existing home sales are flattening out – neutral for brokers.
• Pending home sales fell – not what you may be thinking.
The quiet part is all three stats above have two things in common – low supply and steady-to-rising demand. So new home sales are rising because builders are building enough of them to sell to enough people who are looking for housing. Existing home sales are flat because no one wants to sell a house with a 3% mortgage and buy a new one with a 6% mortgage. And, of course, if no one wants to sell their house, then you get a fall in pending home sales.
The bottom line remains unchanged. Low supply of steady demand favors the homebuilders.
Overall pending home sales fell 2.7% month to month. And if you're wondering how each U.S. region fared in the pending home sales data here you go:
• The Northeast delivered a 12.9% increase.
• The South registered a 4.4% decrease.
• The Midwest dropped by 5.3%.
• The West's sales dropped by 6.1% (a 62% decrease since 2001).
Moreover, the National Association of Realtors noted that there are still three pending offers per sale.

Mortgage rates ticked up last week along with bond yields. Homebuilder stocks pulled back slightly before recovering. Several homebuilders will be reporting earnings in July, near the date of the Fed's next meeting.
For an in-depth look at the news and trends in the housing and real estate market, check out my new publication, Joe Duarte's Real Estate Weekly, here. You'll find crucial and detailed real estate market updates in an easy to follow and highly accessible format. This crucial information complements the stock picks at Joe Duarte in the Money Options.com. For more details on how to trade the bullish housing megatrend, check out my latest video here.
Oil Service Makes its Move
The bullish action in stocks on June 30 might be at least partially related to window dressing. That's where portfolio managers who missed the rally play catch up in order to show their clients that they own stocks in groups which are rising. What that means is that the bullish action may or may not remain in some of the more extended sectors of the market, such as AI.
On the other hand, some portfolio managers use the cover of window dressing as a stealthy way to put money to work in sectors which offer value. As a result, while everyone is looking at the hot sectors, such as AI, it pays to look at sectors which have underperformed in the first half.
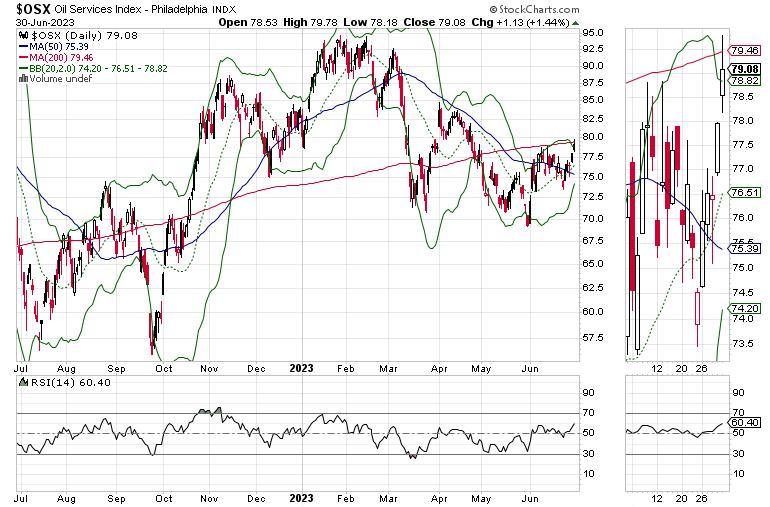
One of them is oil service. As the price chart illustrates, the Philadelphia Oil Service Index (OSX) is showing some bullish characteristics. Note the broaching of the 200-day moving average after the recent double bottom it carved out over the last three months.
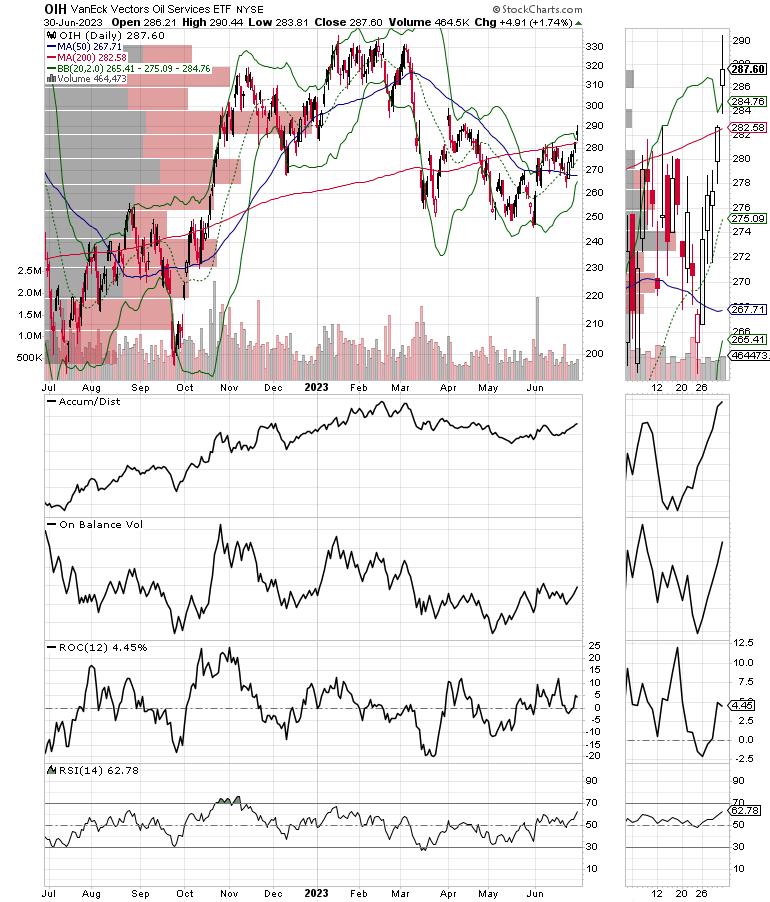
Moreover, its accompanying ETF, the Van Eck Vectors Oil Service ETF (OIH), is looking even better. You can see that in the fact that OIH has crossed above its 200-day moving average, marking what looks to be the start of a bullish reversal.
In addition, you can see that the Accumulation/Distribution indicator (ADI) has begun to move higher as the On Balance Volume (OBV) indicator has bottomed out. Together, these two indicators confirm the emerging price trend in OIH as money moves in.
I have several oil service stocks in my Joe Duarte in the Money Options portfolios which are worth considering. One of them just broke out to a new high. You can check it out with a FREE trial to my service here.
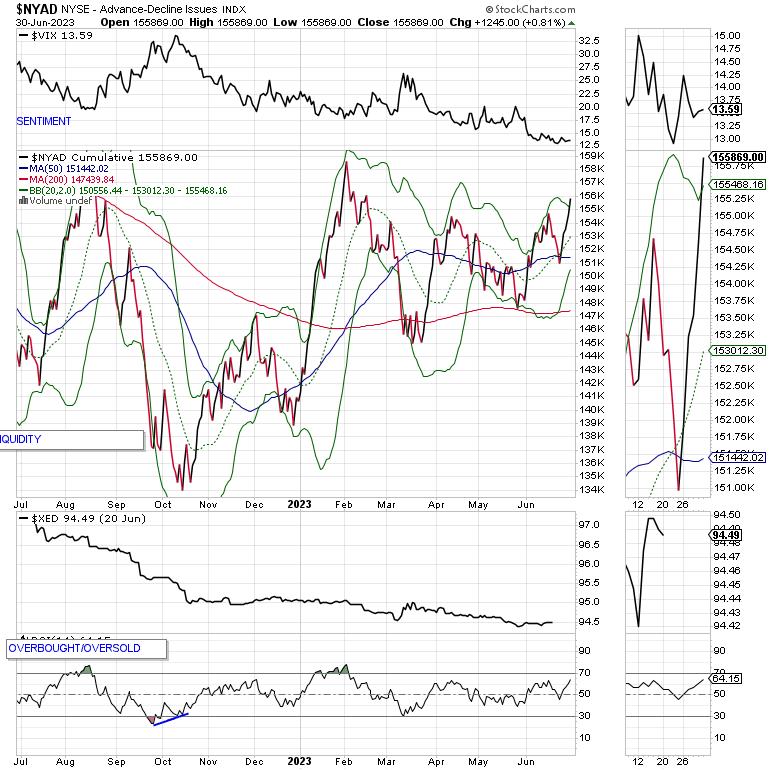
NYAD Recovers and Gathers Upside Momentum
In a bullish development, the New York Stock Exchange Advance Decline line (NYAD) turned on a dime last week and moved decidedly higher, breaking above short-term resistance. This comes after a short lived dip below the 50-day moving average.
The Nasdaq 100 Index (NDX) also turned around, finding support at its the 20-day moving average. ADI and OBV have turned short-term negative.
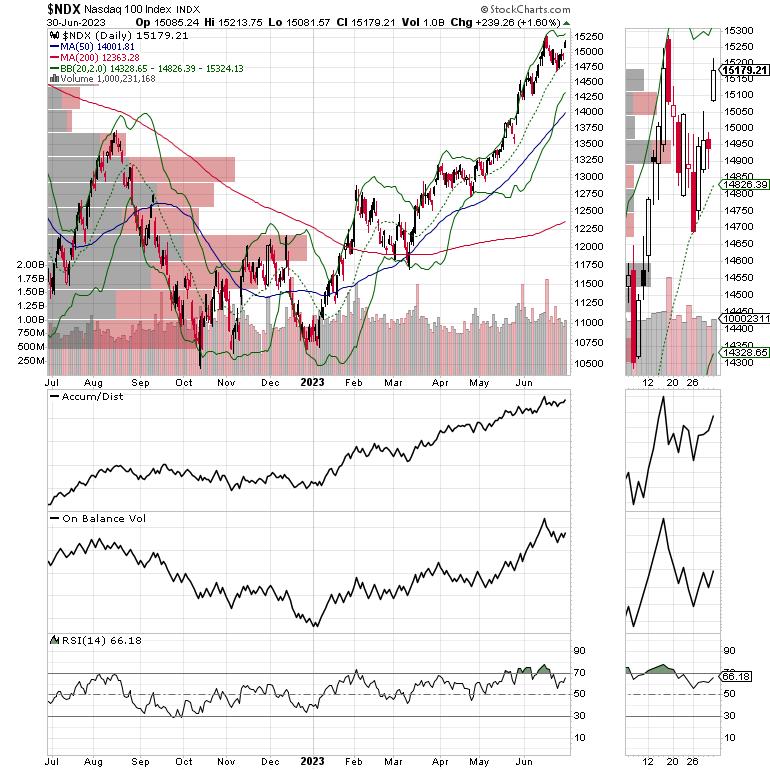
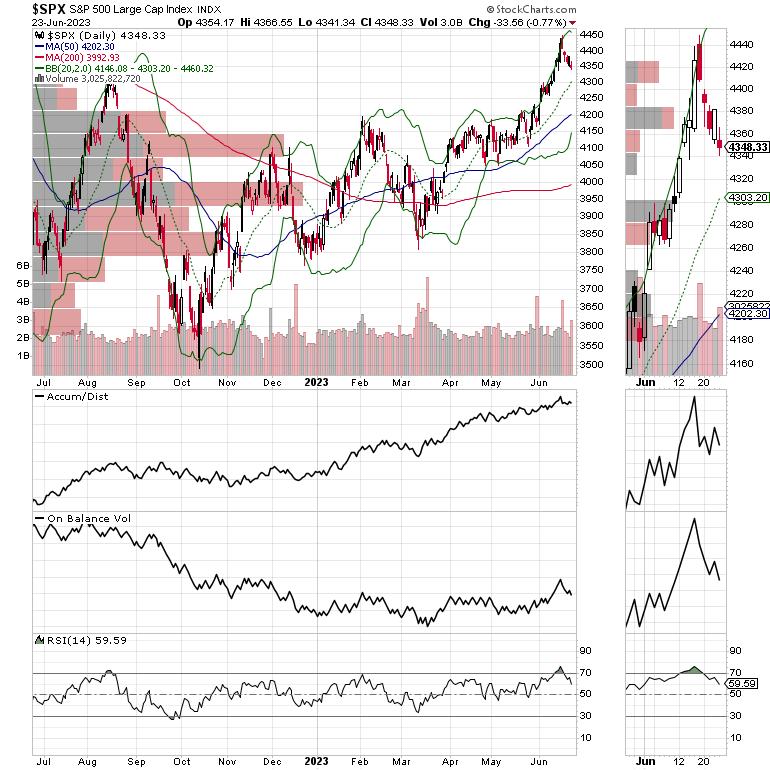
The S&P 500 (SPX) made a new high since the October bottom in stocks. As with NDX, SPX found support at its 20-day moving average. This is a bullish development. Both ADI and OBV stabilized.
VIX Is Likely to Bounce
After its recent new lows, the CBOE Volatility Index (VIX) is poised to rise, as July often marks a bottom. On the other hand, VIX is at such a low level that it could take a while before the negative effects of a rising VIX affect the bullish action in stocks.
When the VIX rises, stocks tend to fall, as rising put volume is a sign that market makers are selling stock index futures to hedge their put sales to the public. A fall in VIX is bullish, as it means less put option buying, and it eventually leads to call buying, which causes market makers to hedge by buying stock index futures. This raises the odds of higher stock prices.
Liquidity Remains Stable
The Eurodollar Index (XED) remains rangebound, which is relatively bullish. A move below 94 would be very bearish.
A move above 95 will be a very bullish development. Usually, a stable or rising XED is very bullish for stocks.
Read Full Story »»»
DiscoverGold
Microsoft Corp. $MSFT Seeing if it can hold over 340 for a move back to ATH's.
By: Options Mike | July 1, 2023
• $MSFT Seeing if it can hold over 340 for a move back to ATH's.

Read Full Story »»»
DiscoverGold
Here's how every Dow Jones stock performed in the first half of 2023
By: Evan | July 2, 2023
• Here's how every Dow Jones stock performed in the first half of 2023
Salesforce $CRM +59.3%
Apple $AAPL +49.3%
Microsoft $MSFT +42%
Intel $INTC +26.5%
American Express $AXP +17.9%
Visa $V +14.3%
McDonald's $MCD +13.2%
Walmart $WMT +10.9%
Boeing $BA +10.9%
Cisco $CSCO +8.6%
JPMorgan $JPM +8.5%
$DOW +5.7%
Merck $MRK +4%
The Dow Jones Index$DIA +3.8%
Disney $DIS +2.8%
Caterpillar $CAT +2.7%
Procter & Gamble $PG +0.1%
Home Depot $HD -1.7%
Honeywell $HON -3.2%
$IBM -5%
Coca-Cola $KO -5.3%
Verizon $VZ -5.6%
Nike $NKE -5.7%
Goldman Sachs $GS -6.1%
Johnson & Johnson $JNJ -6.3%
Travelers $TRV -7.4%
UnitedHealth $UNH -9.3%
Chevron $CVX -12.3%
Amgen $AMGN -15.5%
3M $MMM -16.5%
Walgreens $WBA -23.7%
Read Full Story »»»
DiscoverGold
Nasdaq 100 Total Returns (2000-2023)…
By: Charlie Bilello | July 2, 2023
• Nasdaq 100 Total Returns…
2000: -37%
'01: -33%
'02: -38%
‘03: +50%
'04: +11%
'05: +2%
'06: +7%
'07: +19%
'08: -42%
'09: +55%
'10: +20%
'11: +4%
'12: +18%
'13: +37%
'14: +19%
'15: +10%
'16: +7%
'17: +33%
'18: +.04%
'19: +39%
'20: +49%
'21: +27%
'22: -32%
2023 YTD: +39%
Read Full Story »»»
DiscoverGold
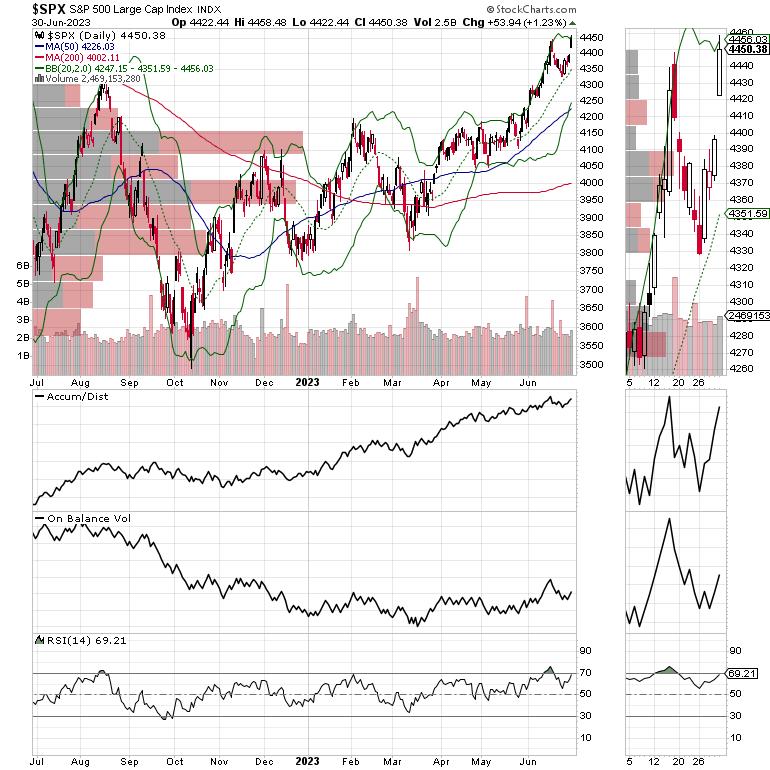
S&P 500 Index (SPX) »» Weekly Summary Analysis
By: Marty Armstrong | July 1, 2023
S&P 500 Cash Index opened above the previous high and closed above it as well warning of a bullish posture right now. This market is above all our indicators at this time reflecting it is moving higher over recent activity. It closed today at 445038 and is trading up about 15% for the year from last year's settlement of 383950.
At present, this market has been rising for 8 months going into July suggesting that this has been a bull market trend on the monthly time level.
ECONOMIC CONFIDENCE MODEL CORRELATION
Here in S&P 500 Cash Index, we do find that this particular market has correlated with our Economic Confidence Model in the past. Our next ECM target remains Tue. May 7, 2024. The Last turning point on the ECM cycle low to line up with this market was 2020 and 2009 and 2002. The Last turning point on the ECM cycle high to line up with this market was 2022 and 2007 and 2000.
MARKET OVERVIEW
NEAR-TERM OUTLOOK
The historical perspective in the S&P 500 Cash Index included a rally from 1974 moving into a major high for 2022, the market has pulled back for the current year. The last Yearly Reversal to be elected was a Bullish at the close of 2020 which signaled the rally would continue into 2022. However, the market has been unable to exceed that level intraday since then. This overall rally has been 2 years in the making.
This market remains in a positive position on the weekly to yearly levels of our indicating models. Nevertheless, it closed last year on the weak side down from 2021. Pay attention to the Monthly level for any serious change in long-term trend ahead.
Solely focusing on only the indicating ranges on the Daily level in the S&P 500 Cash Index, this market remains in a bullish position at this time with the underlying support beginning at 440015.
On the weekly level, the last important high was established the week of June 26th at 445848, which was up 15 weeks from the low made back during the week of March 13th. So far, this week is trading within last week's range of 445848 to 432808. Nevertheless, the market is still trading upward more toward resistance than support. A closing beneath last week's low would be a technical signal for a correction to retest support.
The broader perspective, this current rally into the week of June 26th reaching 445848 has exceeded the previous high of 421291 made back during the week of May 15th. Right now, the market is above momentum on our weekly models hinting this is still bullish for now as well as trend, long-term trend, and cyclical strength. Looking at this from a wider perspective, this market has been trading up for the past 5 weeks overall.
INTERMEDIATE-TERM OUTLOOK
YEARLY MOMENTUM MODEL INDICATOR
Our Momentum Models are declining at this time with the previous high made 2021 while the last low formed on 2022. However, this market has rallied in price with the last cyclical high formed on 2022 and thus we have a divergence warning that this market is starting to run out of strength on the upside.
After closing above last year's low of 366271.
Interestingly, the S&P 500 Cash Index has been in a bullish phase for the past 8 months since the low established back in October 2022.
Critical support still underlies this market at 423300 and a break of that level on a monthly closing basis would warn that a sustainable decline ahead becomes possible. Immediately, the market is trading within last month's trading range in a neutral position.
DiscoverGold First Trading Day of July – S&P 500 Up 12 Straight
By: Almanac Trader | June 30, 2023
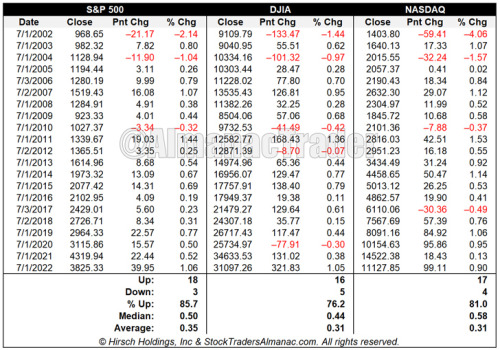
Over the past 21 years from 2002-2022 July’s first trading has the second-best record up 85.7% of the time on the S&P 500 with an average gain of 0.35%. Only August’s third to last trading day has a better record up 19 of 21 with an average gain of 0.57%.
DJIA’s first trading day of July has produced gains 76.2% of the time with an average gain of 0.31%. NASDAQ splits the middle up 81.0% (0.31% average gain) of the time. July’s first trading day is the third best performing first trading day of all twelve months based upon DJIA points gained with DJIA gaining a cumulative 1668.15 points since 1998.
Looking back even further to 1989, S&P 500 has advanced 88.2% of the time (up 30 times in 34 years) with an average gain of 0.50%. DJIA has advanced 28 times in the same 34 years (82.4%) and NASDAQ has risen in 26 of those years (76.5%) with an average advance of 0.34% in all years. No other day of the year exhibits this amount of across-the-board strength, which makes a solid case for declaring the first trading day of July the most bullish day of the year over the past 34 years.
Read Full Story »»»
DiscoverGold
US Equity Fund Inflows $2.8 Billion; Taxable Bond Fund Outflows -$2.5 Billion
By: Refinitiv | June 29, 2023
• FUND FLOW REPORTS FOR THE WEEK ENDED 06/28 ARE NOW AVAILABLE.
For the week ended 06/28/2023 ExETFs - All Equity funds report net outflows totaling -$4.236 billion, with Domestic Equity funds reporting net outflows of -$3.583 billion and Non-Domestic Equity funds reporting net outflows of -$0.653 billion...ExETFs - Emerging Markets Equity funds report net outflows of -$0.102 billion...Net outflows are reported for All Taxable Bond funds of -$2.467 billion, bringing the rate of inflows for the $2.967 trillion sector to $2.680 billion/week...International & Global Debt funds posted net outflows of -$0.098 billion...Net inflows of $0.919 billion were reported for Corp-Investment Grade funds while High Yield funds reported net outflows of -$0.730 billion...Money Market funds reported net outflows of -$2.415 billion...ExETFs - Municipal Bond funds report net outflows of -$0.106 billion.
Read Full Story »»»
DiscoverGold
Money managers Reduced their exposure to the US Equity markets since last week...
DiscoverGold
NAAIM Exposure Index
June 29, 2023
The NAAIM Number
75.93
Last Quarter Average
63.74
»»» Read More…
Click on "In reply to", to see The NAAIM Number from prior weeks
Historically, July tends to be a positive month for the S&P 500 in the third year of the US presidential cycle
By: Isabelnet | June 29, 2023
• S&P 500
Historically, July tends to be a positive month for the S&P 500 in the third year of the US presidential cycle.

Read Full Story »»»
DiscoverGold
Avoid This Sector 4th of July Week
By: Schaeffer's Investment Research | June 28, 2023
• A list of historic SPX returns during the Independence Day holiday
• Plus, a list of historically outperforming stocks
If you’re looking to put on some positions before the 4th of July, this article may inspire some ideas. The table below shows the holiday week has been bullish over the past 50 years. The average return during the week of July 4th for the S&P 500 Index (SPX) was 0.4%, more than double the typical weekly return. In the next section, I break down how stocks behaved when the 4th of July lands on a Tuesday. Finally, I list the best and worst stocks during the holiday week over the last 10 years, which shows one sector you may want to avoid.

WEEK RETURN DEPENDING ON THE DAY OFF
This year, the 4th of July lands on a Tuesday which has been the best-case scenario for the S&P 500 over the past 50 years. When markets were closed on Tuesday, July 4th, the index gained an average of 0.84% for the week. Also, the standard deviation of returns shows very low volatility around that average.

The table below shows the individual July 4th weeks where Tuesday was the holiday. You can see how the stock market performed each day beginning with the Friday leading into the week (that would be this coming Friday). Monday has been a bullish day, gaining 0.4% on average with five of six days positive. This is especially bullish considering Monday has been the only weekday averaging a loss going back to 1973. Tuesday, of course, is the day off, then Wednesday has been a bad day for the market. The day after the holiday averaged a loss of 0.42%, with half of the returns negative. To follow, the last two days of these weeks have been bullish, especially Friday.

BEST & WORST STOCKS DURING WEEK OF JULY 4TH
The table below shows the best performing S&P 500 stocks over the past 10 years during the July 4th week. Software companies have performed well during week. Some of the biggest tech stocks have been Netflix (NFLX) (the only stock to be positive every 4th of July week over the past 10 years), Amazon.com (AMZN), Alphabet (GOOGL), and Apple (AAPL).

Finally, the table below is a list of the worst stocks during July 4th week over the past ten years. Oil stocks, which have performed poorly so far in 2023, dominate the list. If you expect oil to reverse at some point, you may want to wait a week before placing a bet.

Read Full Story »»»
DiscoverGold
July Historically Opens Strong, But Fades After Mid-Month
By: Almanac Trader | June 27, 2023
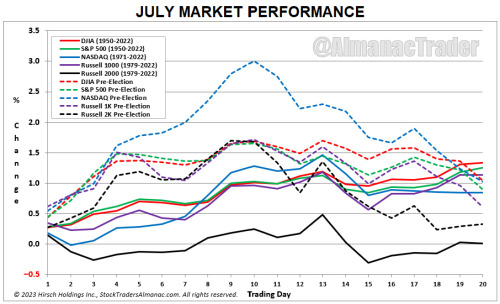
July is the third month of DJIA’s and S&P 500’s “Worst Six Months” and the first month of NASDAQ’s “Worst Four Months.” Dynamic trading often accompanies the first full month of summer as the beginning of the second half of the year brings an inflow of new capital. But by around mid-month, inflows have faded and the market’s performance in July usually peaks. This tends to create a strong open and first half. In all the years examined the major indexes tend to reach a peak around mid-month and then drift sideways to slightly lower for the remainder of the month. In pre-election years since 1950, the mid-month peak and second half declines have more pronounced especially for NASDAQ and Russell 2000.
Read Full Story »»»
DiscoverGold
Fanatics increases its offer to $225 million to acquire PointsBet’s U.S. assets >
https://www.cnbc.com/2023/06/28/fanatics-increases-its-offer-to-225-million-to-acquire-pointsbets-us-assets-.html
Dow Jones Industrials Index (DJIA) »» Summary Analysis
By: Marty Armstrong | June 27, 2023
Dow Jones Industrials closed today at 3371471 and is trading up about 1.71% for the year from last year's settlement of 3314725.
The Dow Jones Industrials is still in a bullish position on yearly level of our model suggesting the trend has not been reversed. The Dow Jones Industrials has been trading within last year's range, but the market is trading above last year's settlement of 3314725 settling currently at 3371471. The Dow Jones Industrials is in a neutral position on the quarterly short-term level of our model while the broader term is neutral to bullish implying that the long-term bull market is still holding. The Dow Jones Industrials is in a neutral position on the monthly short-term level of our model while the intermediate trend is bearish, the long-term is neutral. The Dow Jones Industrials is in bearish position on the daily short-term level of our model while the broader term is neutral to bullish implying that the long-term bull market is still holding. Overall, the posture is generally bullish for now.
At present, this market has been rising for 2 months going into June reflecting that this has been only still, a bullish reactionary trend. As we stand right now, this market has made a new high exceeding the previous month's high reaching thus far 3458868 while it has not broken last month's low so far of 3258656. Nevertheless, this market is still trading above last month's close of 3290827.
Currently, this market has been rising for 13 years going into 2023 suggesting that this has been a bull market trend which was confirmed by electing all four of our model's long-term Bullish Reversals from the key low made back during 2009. Nevertheless, this market has been in a bullish postureGiven the length of this rally, there is a risk of a temprary high. Therefore, some caution is required so focus of the yearly turning points and the monthly timing models.
MARKET OVERVIEW
NEAR-TERM OUTLOOK
The historical perspective in the Dow Jones Industrials included a rally from 2009 moving into a major high for 2022, the market has pulled back for the current year. The last Yearly Reversal to be elected was a Bullish at the close of 2022. However, the market has been unable to exceed that level intraday since then.
This market remains in a positive position on the weekly to yearly levels of our indicating models. Nevertheless, it closed last year on the weak side down from 2021. Pay attention to the Monthly level for any serious change in long-term trend ahead.
From a perspective using the indicating ranges on the Daily level in the Dow Jones Industrials, this market remains neutral with resistance standing at 3387617 and support forming below at 3370878. The market is trading closer to the support level at this time. An opening below this level in the next session will imply a decline is unfolding.
On the weekly level, the last important high was established the week of June 12th at 3458868, which was up 13 weeks from the low made back during the week of March 13th. We have been generally trading down for the past week, which has been a very dramatic move of 2.723% in a stark panic type decline.
Immediately, this decline from the last high established the week of June 12th has been important closing sharply lower as well. Before, this recent rally exceeded the previous high of 3425783 made back during the week of May 1st. Nonetheless, that high was actually lower than the previous high made the week of January 9th suggesting this market has really been running out of sustainable buying for right now. This immediate decline has thus far held the previous low formed at 3142982 made the week of March 13th. Only a break of that low would signal a technical reversal of fortune and of course we must watch the Bearish Reversals. Right now, the market is neutral on our weekly Momentum Models warning we have overhead resistance forming and support in the general vacinity of 3270451. Additional support is to be found at 3300619. From a pointed viewpoint, this market has been trading down for the past week and it finished in a weak position right now warning we need to pay attention.
INTERMEDIATE-TERM OUTLOOK
YEARLY MOMENTUM MODEL INDICATOR
Our Momentum Models are declining at this time with the previous high made 2021 while the last low formed on 2022. However, this market has rallied in price with the last cyclical high formed on 2022 and thus we have a divergence warning that this market is starting to run out of strength on the upside.
After closing above last year's low of 2985630.
Interestingly, the Dow Jones Industrials has been in a bullish phase for the past 7 months since the low established back in October 2022.
Critical support still underlies this market at 3263630 and a break of that level on a monthly closing basis would warn that a sustainable decline ahead becomes possible. Nevertheless, the market is trading above last month's high showing some strength.
DiscoverGold
Amazon $2.6 Million Call • Strike: 150 • Expiration: 11/17/23
By: Cheddar Flow | June 27, 2023
• $AMZN $2.6M OTM Call
Strike: 150
Expiration: 11/17/23
*At the Ask*

Read Full Story »»»
DiscoverGold
Tech Selloff Sets Up NASDAQ’s Midyear Rally
By: Almanac Trader | June 26, 2023
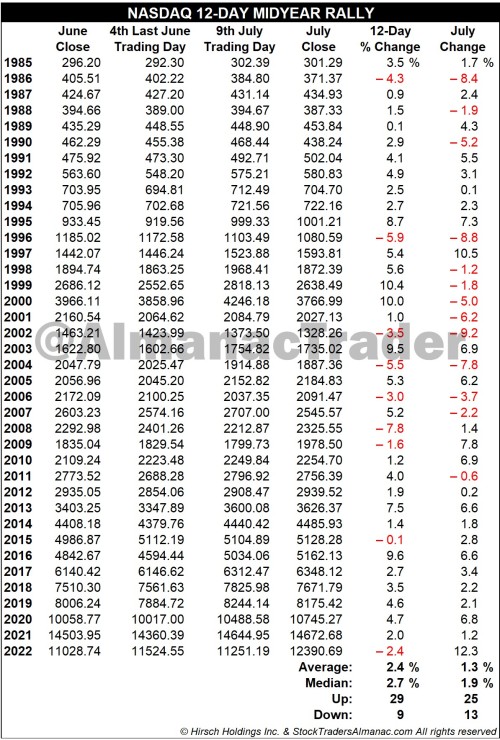
The week after June Triple Witching delivered its expected weakness, but this sets up NASDAQ’s 12-day midyear rally to a T.
In the mid-1980s tech’s influence in the market began to grow and the market’s focus in early summer shifted to the outlook for second quarter earnings of technology companies. In anticipation of positive results, over the last three trading days of June and the first nine trading days in July, NASDAQ typically enjoys a rally. This 12-day run has been up 29 of the past 38 years with an average historical gain of 2.4%. Look for this rally to begin around June 28 and run until about July 14.
After the bursting of the tech bubble in 2000, NASDAQ’s mid-year rally had a spotty track record from 2002 until 2009 with three appearances and five no-shows in those years. However, it has been quite solid over the last thirteen years, up eleven times with two losses. Last year, NASDAQ faltered during the 12-day span, but eventually took off in the second half of July, up 12.3%.
Our strategy is to buy the close on Tuesday June 27 and sell July 14 or take profits on any sizable gain in between.
Read Full Story »»»
DiscoverGold
Lordstown Motors files for bankruptcy protection, sues Foxconn >
https://www.cnbc.com/2023/06/27/lordstown-motors-files-for-bankruptcy-protection-sues-foxconn.html
NYAD Breaks Below 50-day Moving Average
By: Joe Duarte | June 26, 2023
By the time this article hits the presses, there may be a fully developing civil war in Russia.
Two weeks ago in this space, I noted that the AI-fueled rally was due for a pullback. And the Fed and a cadre of central banks gave sellers the excuse to take profits.
And just to make life interesting, the news of major problems in Russia broke over the weekend and are rapidly developing as I go to press. Reports suggest that the leader of Russia's mercenary group, Wagner, is trying to implement a coup against Putin. And Putin is retaliating. The situation seems to be deteriorating rapidly as there are reports of clashes between Wagner fighters and Russia's military in southern Russia.
Let's See What the Fed Does
Fed Chairman Powell, in his recent congressional testimony, warned that the central bank would resume its interest rate hiking cycle as inflation isn't where the central bank wants it. His comments coincided with worse-than-expected inflation news from the UK, which registered 7.1% year-over-year growth in its core inflation measure. The Eurozone's core inflation seems to be slowing as the region is now in a confirmed recession. In the US, Consumer prices remain elevated but are flattening out, while producer prices plunged in the latest report.
So, is Powell just talking? Who knows? But with the situation in Russia rapidly deteriorating, what the Fed and other global central banks do next is anyone's guess. What is most likely is that the events in Russia will increase volatility in the US dollar, gold, crude oil, U.S. Treasury bonds, and, of course, stock index futures.
Of course, these events in Russia couldn't come at a worse time, since the Bank of England, the Swiss National Bank, and the central bank of Norway all raised interest rates on June 22, 2023, with expectations rising for more rate hikes from the European Central Bank and tough talk from the Fed about raising rates two more times in 2023. Furthermore, the rise in US jobless claims continues. This time, California, Connecticut, and New Jersey led the way as tech layoffs may be gathering steam. Existing home sales were flat year-over-year as the usual supply shortage, combined with mortgage rates, continued to have a negative effect. New home sales are not struggling. Meanwhile, the US leading economic indicator fell for the 14th straight month.
This comes as PMI data shows the manufacturing component of global and US PMIs is slowing rapidly, as new orders are drying up and the services sector is showing signs of slowing.
Watching the Bond Market; Global Economy Shows Signs of Slowing as Russian Events Develop
The bond market's reaction to talk of inflation and higher interest rates is, in many ways, more important than what influential people say or do. That's because bonds are the most inflation-sensitive financial instruments available. At the same time, US Treasury bonds are considered the ultimate flight to safety instruments in the world. That notion is about to be tested as the Russian situation develops.
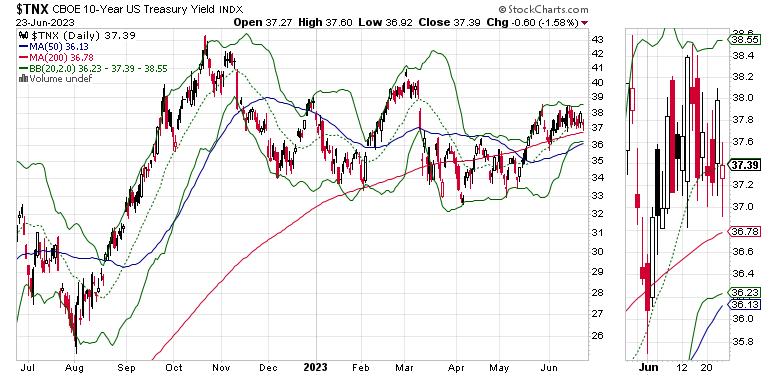
You can see that, although yields initially rose on Powell's testimony and the global rate hikes, by week's end, the 10-year US Treasury Yield index ($TNX) remained well below the highs reached in late 2022. If history is any guide, the Russian events should lead to big money moving into U.S. treasuries and lower yields.
Watch the 3.6% yield zone on the downside and 3.85% on the upside. If treasuries react to this developing crisis as they have in the past, we may see a significant drop in bond yields.
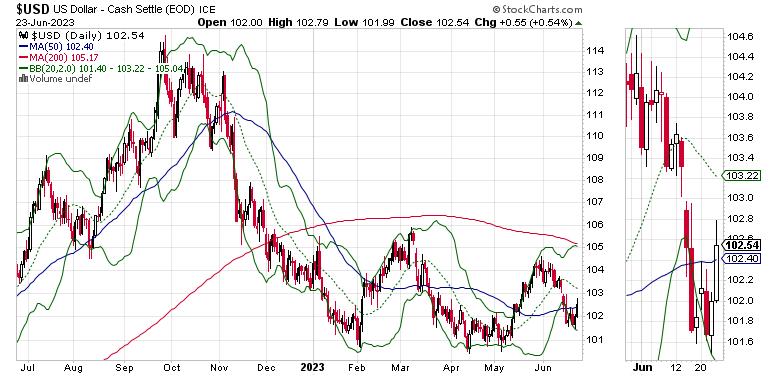
The US Dollar index ($USD) is also worth watching. Keep an eye on the 103-105 trading range. Moves above or below that will be meaningful if they last.
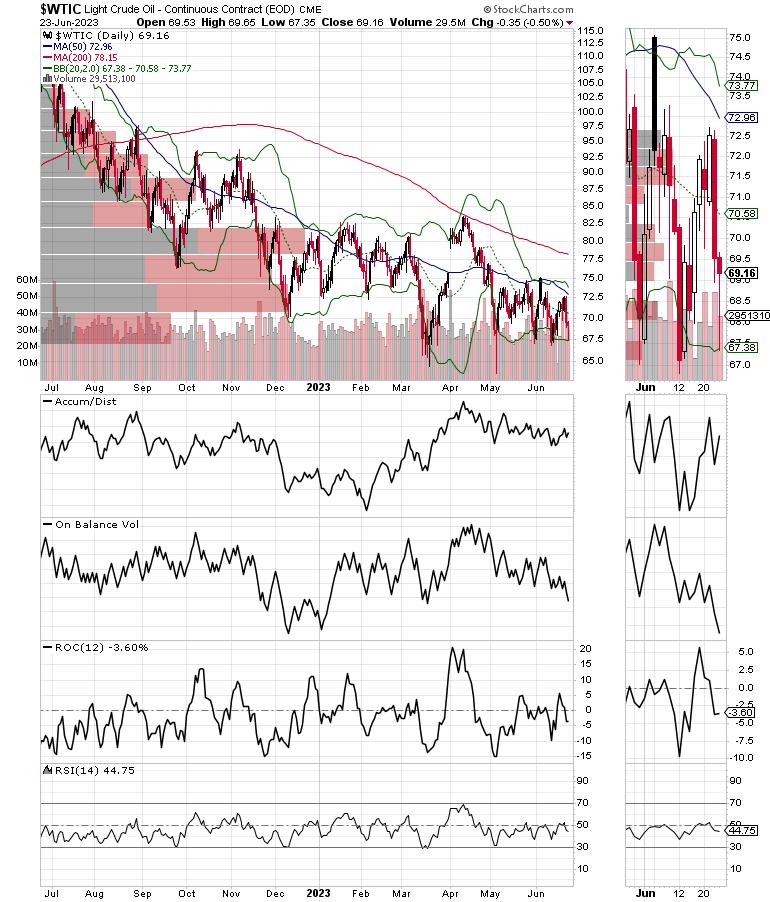
Also watch the action in crude oil ($WTIC) as traders begin to handicap the potential for Russian oil supplies, which have been quietly flooding the world of late, to be disrupted.
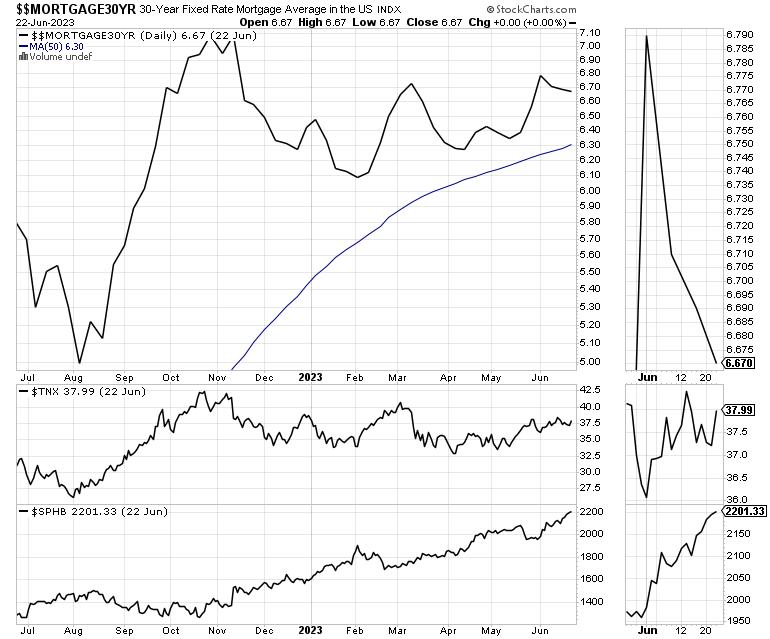
We'll also be watching what happens to mortgage rates and the housing market, especially the homebuilder stocks in the U.S., as the Russian situation develops. Depending on how the markets react, lower yields may have positive effects on home builders and REITs.
That's because with lower bond yields, as the chart above shows, we're already seeing an increase in mortgage activity.
Incidentally, thanks to all the members and followers who have joined my Buy me a Coffee page, where I expect to be very busy in the next few days and send Flash Alerts to subscribers. Meanwhile, you can check out my Weekly Real Estate Roundup here and here. That's where I offer crucial market updates in an easy-to-follow and highly accessible format. This crucial information complements the stock picks at Joe Duarte in the Money Options.com.
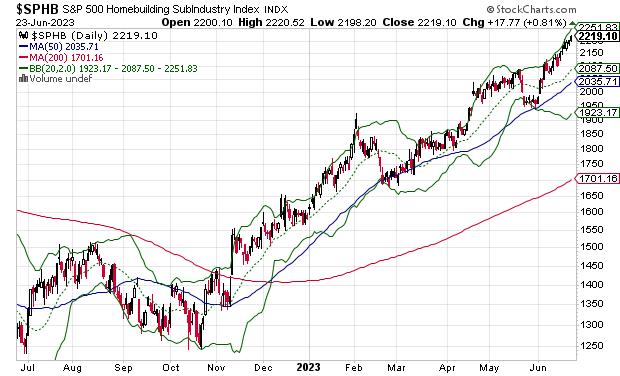
Bullish and Bearish Stock Sectors
It's also important to see how stocks see Mr. Powell's remarks and the Russian developments will be reflected in money flows, especially in a sector-specific manner.
The market's recent leadership, technology and homebuilders went in opposite directions, with the homebuilders ($SPHB) pushing higher due to the long-term demographic megatrends, which continue to exert their bullish influence on the group.
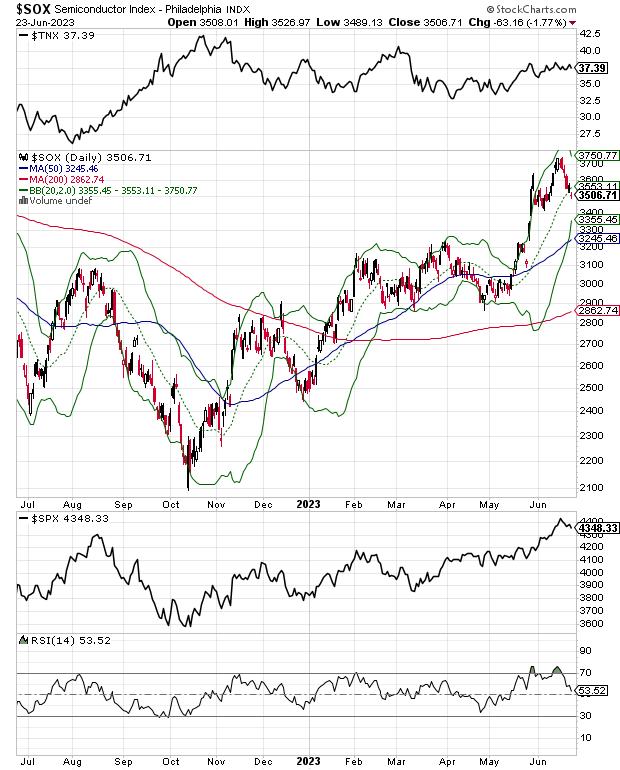
The highly overbought semiconductors ($SOX) continued their pullback, but held at their 20-day moving average (MA) as the crowd who missed the first leg of the rally buy on the dip.
Perhaps the most interesting action was in the retail sector (RLX), where the bargain shopper subsector is getting a bid from investors who are starting to price in a recession.
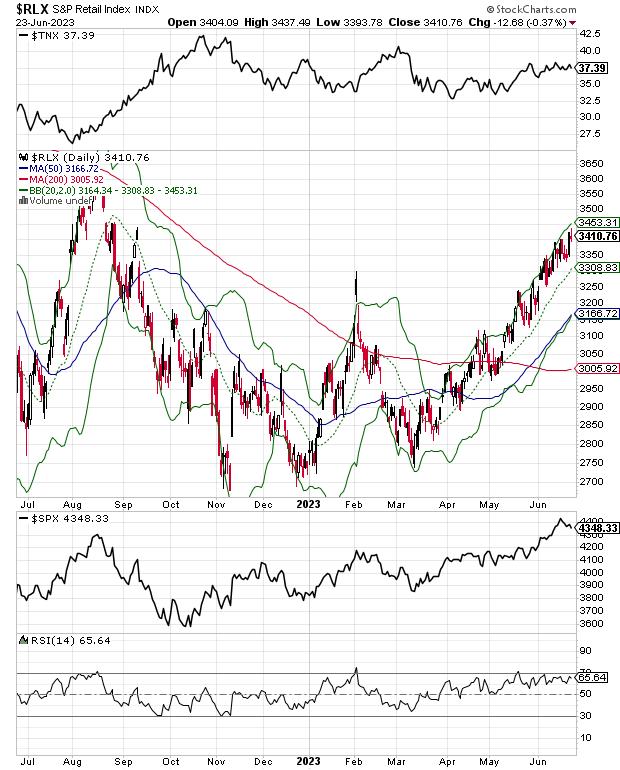
All the above charts show the relationship between the action in TNX and the particular sector of interest.
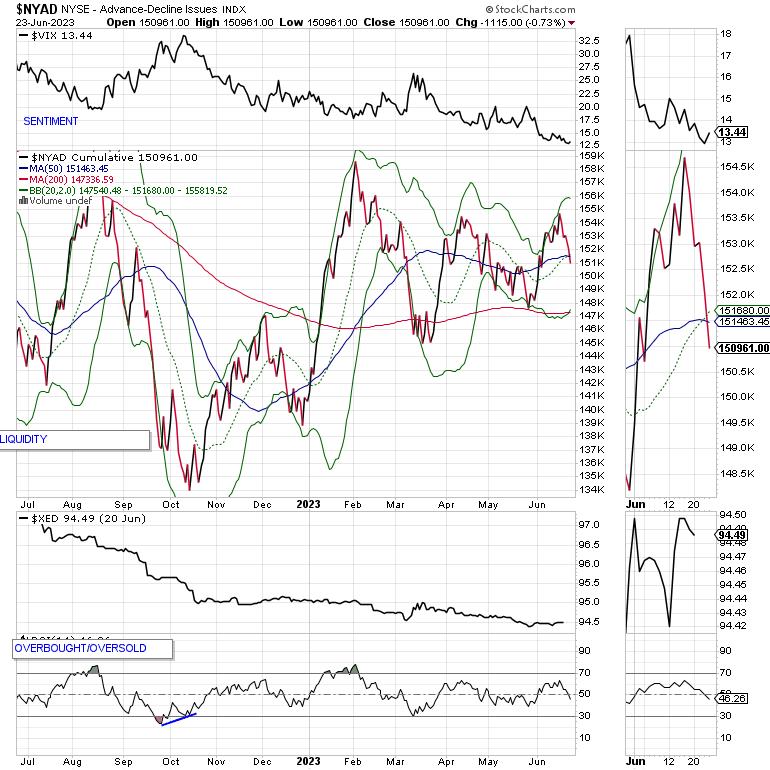
NYAD Breaks Below 50-day Moving Average
The New York Stock Exchange Advance Decline line ($NYAD) finally gave in to selling pressure last week as it broke below its 50-day moving average. NYAD had been hanging in there fairly well, but did not confirm the recent highs on the major indexes delivering a negative divergence. Unless this break below the 50-day MA is repaired soon, we'll have to see what happens at the 200-day MA.
The Nasdaq 100 Index ($NDX) is in correction mode. The first major support is the 20-day MA. The Accumulation Distribution Line and On Balance Volume (OBV) have turned short-term negative.
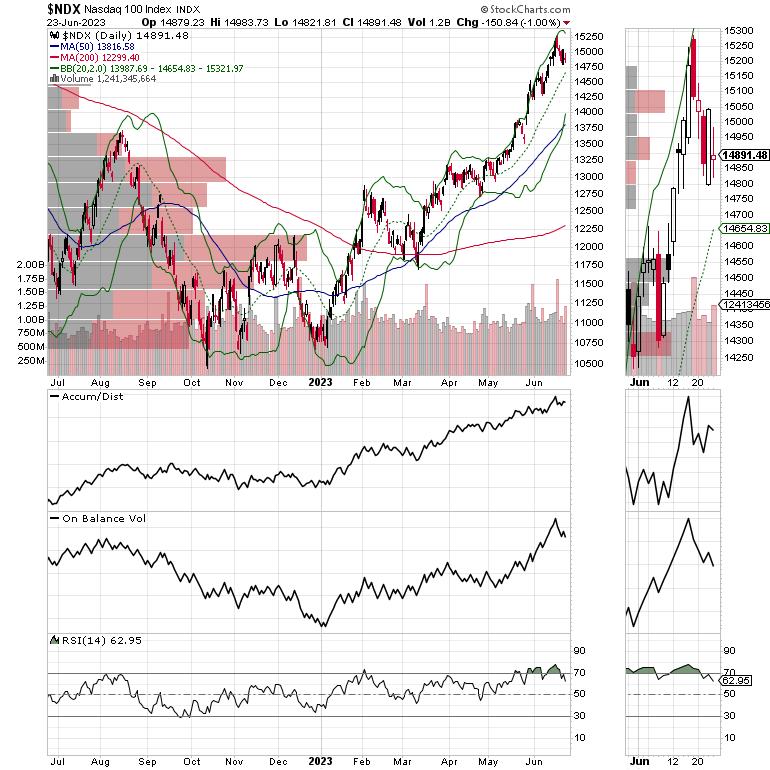
The S&P 500 index ($SPX) is also in a short-term reversal mode. Both Accumulation/Distribution and OBV have turned negative as sellers make a comeback.
VIX Is Likely to Bounce
After its recent new lows, the Cboe Volatility Index ($VIX) is poised to rise as the Russian developments proceed.
When the VIX rises, stocks tend to fall, as rising put volume is a sign that market makers are selling stock index futures to hedge their put sales to the public. A fall in VIX is bullish, as it means less put option buying, and it eventually leads to call buying, which causes market makers to hedge by buying stock index futures. This raises the odds of higher stock prices.
Liquidity May Improve in the Short Term Due to Russian Events
With the Fed on hold, the market's liquidity has been moving sideways, which is a positive. In the short term, we may see an improvement, with traders moving to short-term trading instruments as the Russian situation develops.
The Eurodollar Index ($XED) has been rangebound. A move below 94 would be very bearish. A move above 95 will be a bullish development. Usually, a stable or rising XED is very bullish for stocks.
Read Full Story »»»
DiscoverGold
NVIDIA (NVDA) , One of the Most Accumulated Stocks in 2023
By: Lucas Downey | June 26, 2023
• NVIDIA, Corp. (NVDA) shares are up an impressive 188% in 2023.
Select mega cap growth stocks have rallied hard, in the face of sour sentiment. Big Money footprints tell the real story.
NVIDIA Attracts Big Money Inflows
Want an edge in trading? Follow the Big Money.
What’s Big Money? Said simply, it’s when a stock rises due to institutional demand. Top stocks tend to attract savvy investors.
You see, fund managers are always looking to bet on the next outperforming stocks…the best in class. They spend countless hours sizing up companies, reading reports, speaking to analysts…you name it. When they find a company firing on all cylinders, they pounce in a big way.
The YTD action tells the story. Each green bar signals unusual buying volumes in NVDA shares, pushing the stock higher:
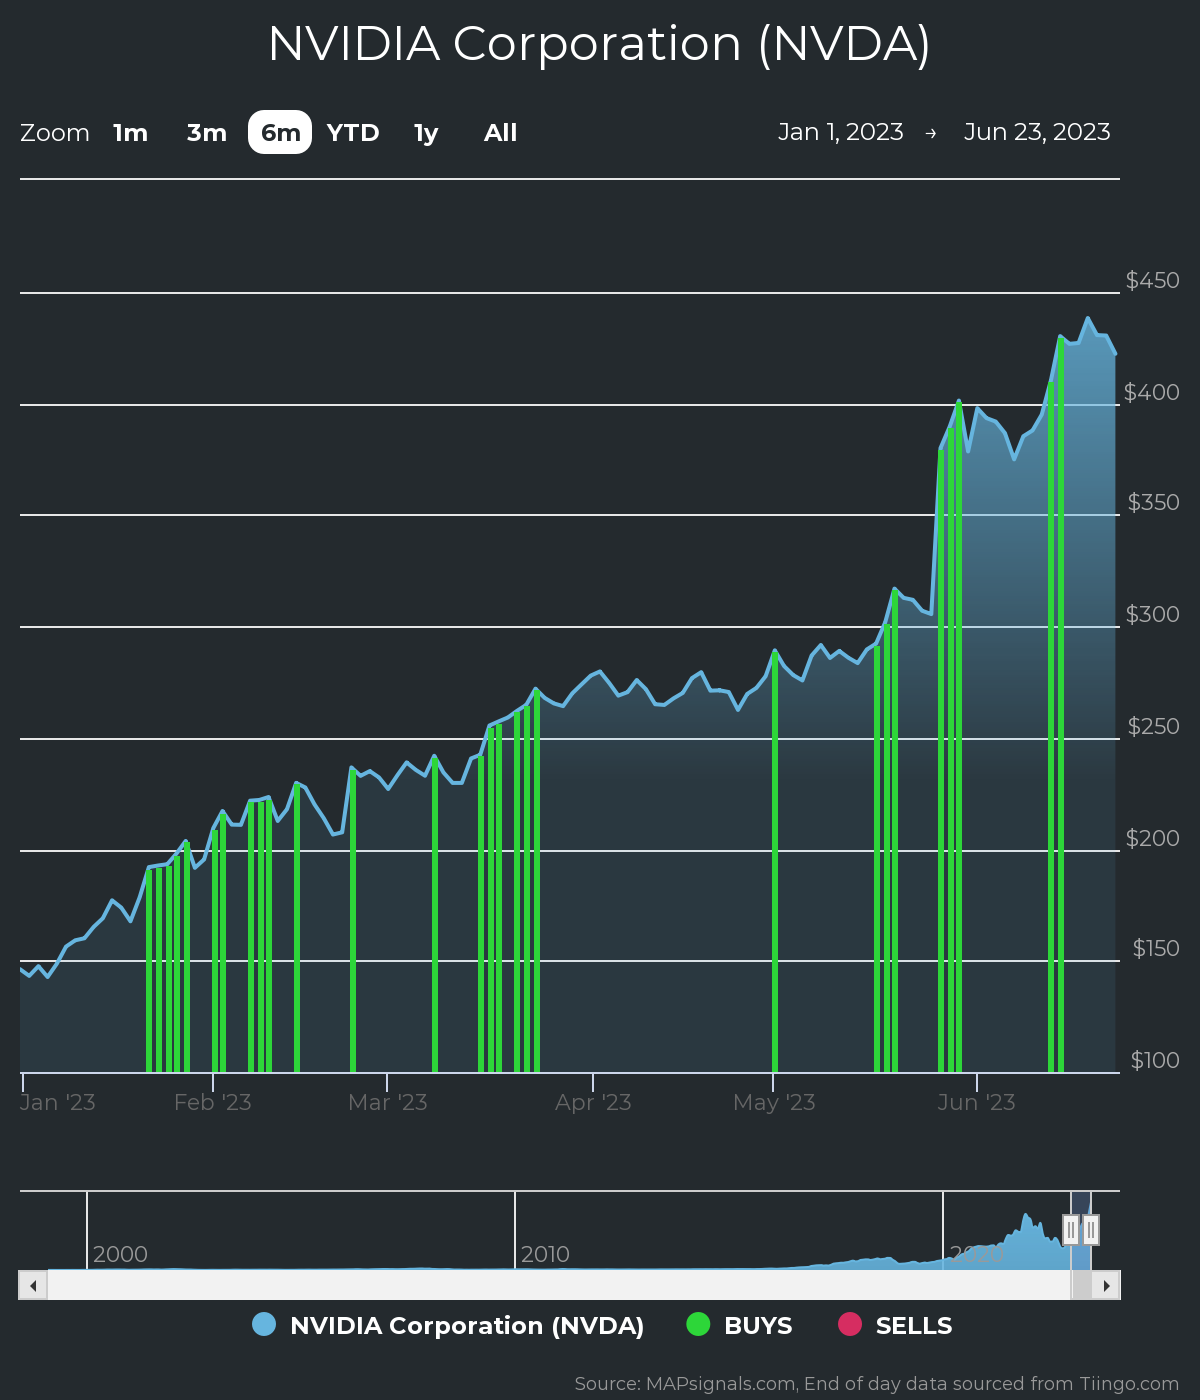
Source: www.mapsignals.com
Very few stocks have charts this strong. Recent green bars suggest strong demand. But, what about the fundamental story?
NVIDIA Fundamental Analysis
Next, it’s a good idea to check under the hood. I want to make sure the fundamental story is healthy too. As you can see, NVDA has had positive sales and earnings growth the past 3 years:
• 3-year sales growth rate (+38.1%)
• 3-year EPS growth rate (+40.2%)
Source: FactSet
Marrying great fundamentals with our proprietary Big Money software has found some big winning stocks over the long-term.
Check this out. NVIDIA has been a top-rated stock at MAPsignals for years. That means the stock has had buy pressure and growing fundamentals. We have a ranking process that showcases stocks like this on a weekly basis.
It’s made the rare Top 20 report numerous times since 2015. The blue bars below show when NVDA was a top pick:
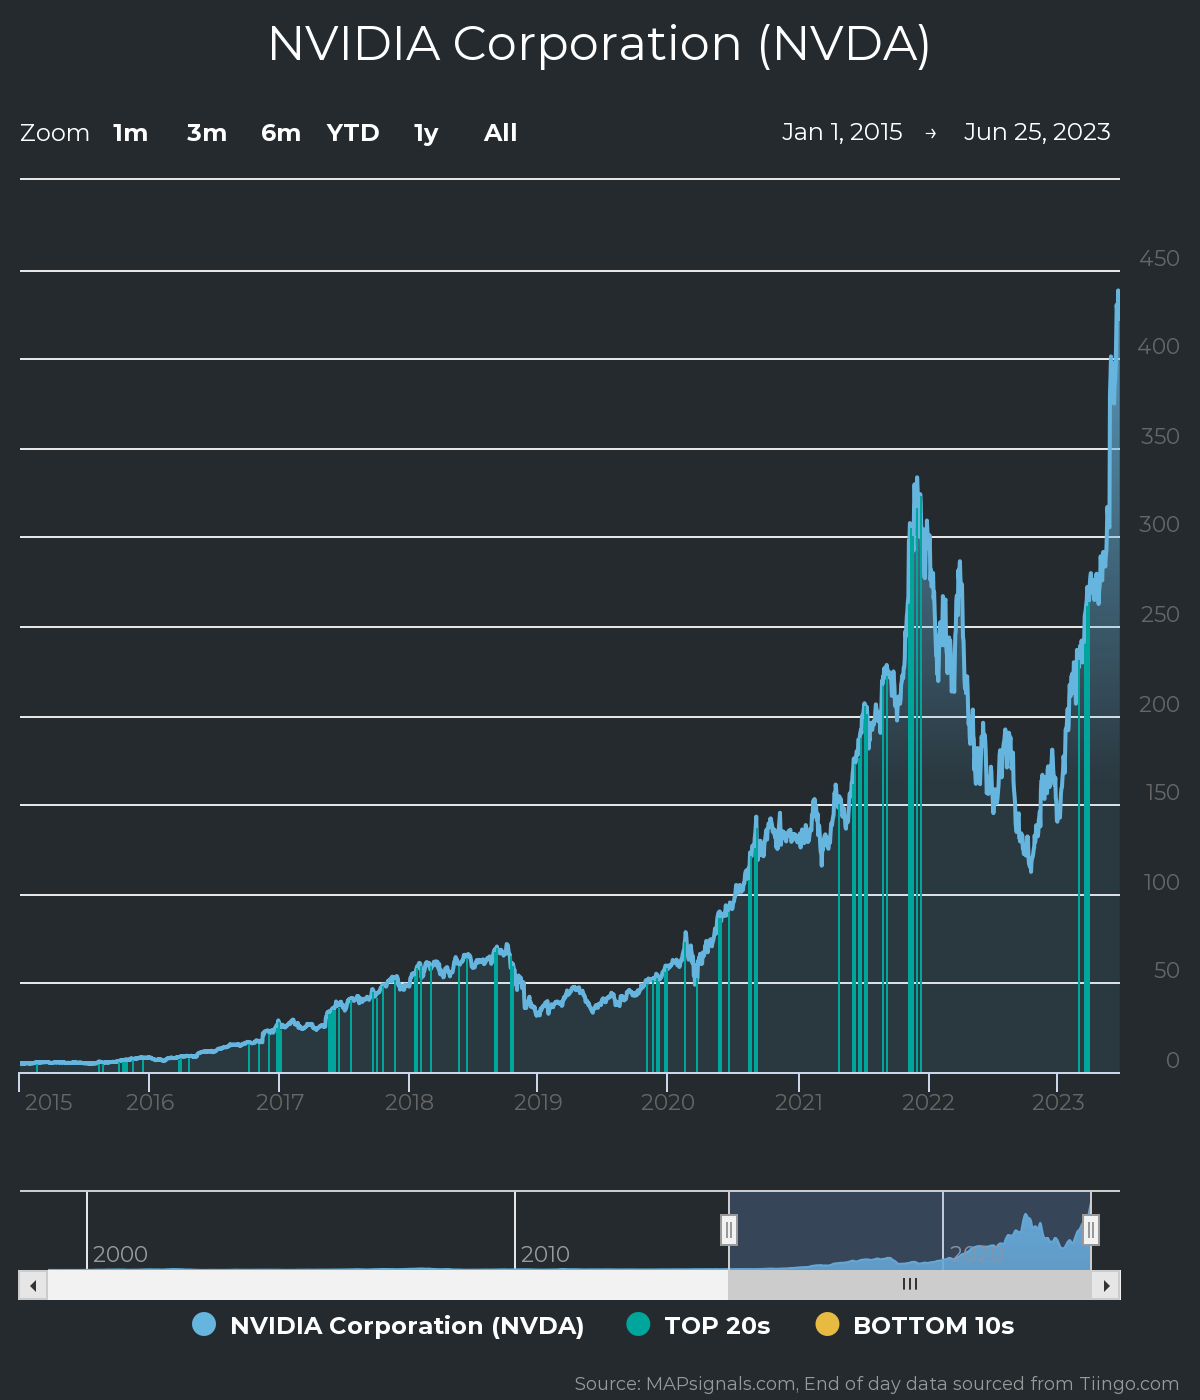
Source: www.mapsignals.com
Tracking unusual volumes reveals the power of the MAPsignals process.
NVIDIA Price Prediction
The NVDA rally has been in place for years and recently. Big Money buying in the shares is signaling to take notice. Given the historical gains in share price and strong fundamentals, this stock could be worth a spot in a diversified portfolio.
Read Full Story »»»
DiscoverGold
The Market Greed/Fear Index stands at 79.60, signaling extreme greed in the US stock market
By: Isabelnet | June 26, 2023
• Sentiment
The Market Greed/Fear Index stands at 79.60, signaling extreme greed in the US stock market.

Read Full Story »»»
DiscoverGold
S&P 500 Index (SPX) »» Weekly Summary Analysis
By: Marty Armstrong | June 24, 2023
S&P 500 Cash Index closed today at 434833 and is trading up about 13% for the year from last year's settlement of 383950. As of now, this market has been rising for 2 months going into June reflecting that this has been only still, a bullish reactionary trend. As we stand right now, this market has made a new high exceeding the previous month's high reaching thus far 444847 while it has not broken last month's low so far of 404828. Nevertheless, this market is still trading above last month's high of 423110.
ECONOMIC CONFIDENCE MODEL CORRELATION
Here in S&P 500 Cash Index, we do find that this particular market has correlated with our Economic Confidence Model in the past. Our next ECM target remains Tue. May 7, 2024. The Last turning point on the ECM cycle low to line up with this market was 2020 and 2009 and 2002. The Last turning point on the ECM cycle high to line up with this market was 2022 and 2007 and 2000.
MARKET OVERVIEW
NEAR-TERM OUTLOOK
The historical perspective in the S&P 500 Cash Index included a rally from 1974 moving into a major high for 2022, the market has pulled back for the current year. The last Yearly Reversal to be elected was a Bullish at the close of 2020 which signaled the rally would continue into 2022. However, the market has been unable to exceed that level intraday since then. This overall rally has been 2 years in the making.
This market remains in a positive position on the weekly to yearly levels of our indicating models. Nevertheless, it closed last year on the weak side down from 2021. Pay attention to the Monthly level for any serious change in long-term trend ahead.
From a perspective using the indicating ranges on the Daily level in the S&P 500 Cash Index, this market remains moderately bullish currently with underlying support beginning at 423243 and overhead resistance forming above at 434931. The market is trading closer to the resistance level at this time. An opening above this level in the next session will imply that a bounce is unfolding.
On the weekly level, the last important high was established the week of June 12th at 444847, which was up 13 weeks from the low made back during the week of March 13th. We have been generally trading down to sideways for the past week, which has been a very dramatic move of 2.408% in a stark panic type decline.
The broader perspective, this current rally into the week of June 12th has exceeded the previous high of 421291 made back during the week of May 15th. This immediate decline has thus far held the previous low formed at 380886 made the week of March 13th. Only a break of that low would signal a technical reversal of fortune and of course we must watch the Bearish Reversals. Right now, the market is above momentum on our weekly models hinting this is still bullish for now as well as trend, long-term trend, and cyclical strength. From a pointed viewpoint, this market has been trading down for the past week.
INTERMEDIATE-TERM OUTLOOK
YEARLY MOMENTUM MODEL INDICATOR
Our Momentum Models are declining at this time with the previous high made 2021 while the last low formed on 2022. However, this market has rallied in price with the last cyclical high formed on 2022 and thus we have a divergence warning that this market is starting to run out of strength on the upside.
After closing above last year's low of 366271.
Interestingly, the S&P 500 Cash Index has been in a bullish phase for the past 7 months since the low established back in October 2022.
The market is trading some 2.77% percent above the last high 423110 from which we did originally obtain one sell signal from that event established during May. Long-Term critical support still underlies this market at 416430 and only a break of that level on a monthly closing basis would warn of a break of the current uptrend. At this time, the market is holding and is trading above last month's high as well.
DiscoverGold DJIA, S&P 500 and NASDAQ historically cooler in pre-election year Julys
By: Almanac Trader | June 23, 2023
July historically is the best performing month of the third quarter, however the mostly negative results in August and September tend to make the comparison easy. “Hot” Julys in 2009 and 2010 where DJIA and S&P 500 both gained greater than 6% combined with strong performances in 2013, 2018, and 2022 have boosted July’s average gains since 1950 to 1.3% and 1.3% respectively. Such strength inevitability stirs talk of a “summer rally”, but beware the hype, as it has historically been the weakest rally of all seasons (page 74, Stock Trader’s Almanac 2023).
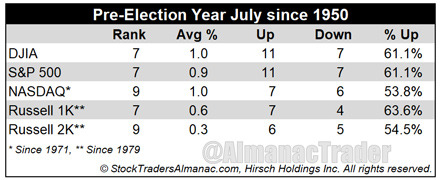
Pre-election-year July rankings are something of a mixed bag, ranking #7 for DJIA and S&P 500, averaging gains of 1.0% and 0.9% respectively (since 1950); while NASDAQ (since 1971) and Russell 1000 (since 1979) pre-election Julys both rank #9. NASDAQ has advanced in seven of the last thirteen pre-election Julys. Russell 2000 has advanced in five of its last ten. Despite tech’s and small-cap’s meager pre-election July track record, NASDAQ and Russell 2000 have averaged gains of 1.0% and 0.3% respectively.
Read Full Story »»»
DiscoverGold
A.I. has a discrimination problem. In banking >
https://www.cnbc.com/2023/06/23/ai-has-a-discrimination-problem-in-banking-that-can-be-devastating.html
US Equity Fund Outflows -$16.5 Billion; Taxable Bond Fund Inflows $2.8 Billion
By: Markets & Mayhem | June 22, 2023
• FUND FLOW REPORTS FOR THE WEEK ENDED 06/21 ARE NOW AVAILABLE.
For the week ended 06/21/2023 ExETFs - All Equity funds report net outflows totaling -$4.445 billion, with Domestic Equity funds reporting net outflows of -$3.705 billion and Non-Domestic Equity funds reporting net outflows of -$0.740 billion...ExETFs - Emerging Markets Equity funds report net outflows of -$0.298 billion...Net inflows are reported for All Taxable Bond funds of $2.759 billion, bringing the rate of inflows for the $2.979 trillion sector to $1.612 billion/week...International & Global Debt funds posted net outflows of -$0.189 billion...Net inflows of $2.170 billion were reported for Corp-Investment Grade funds while High Yield funds reported net inflows of $0.265 billion...Money Market funds reported net outflows of -$16.145 billion...ExETFs - Municipal Bond funds report net inflows of $0.158 billion.
Read Full Story »»»
DiscoverGold
Money managers Increased their exposure to the US Equity markets since last week...
DiscoverGold
NAAIM Exposure Index
June 22, 2023
The NAAIM Number
83.60
Last Quarter Average
63.74
»»» Read More…
U.S. Dollar Index (DXY) - Bear Channel Update. Note all the MA's rolling & reinforcing the Uppr-Parallel...
By: Sahara | June 22, 2023
• $USD $DXY - Bear Channel Update.
Note all the MA's rolling & reinforcing the Uppr-Parallel...

Read Full Story »»»
DiscoverGold
Amazon $1.7 Million Call • Strike: 132 • Expiration: 7/21/23
By: Cheddar Flow | June 22, 2023
• $AMZN $1.7M OTM Call -- Unusual
Strike: 132
Expiration: 7/21/23
*Above the Ask*

Read Full Story »»»
DiscoverGold
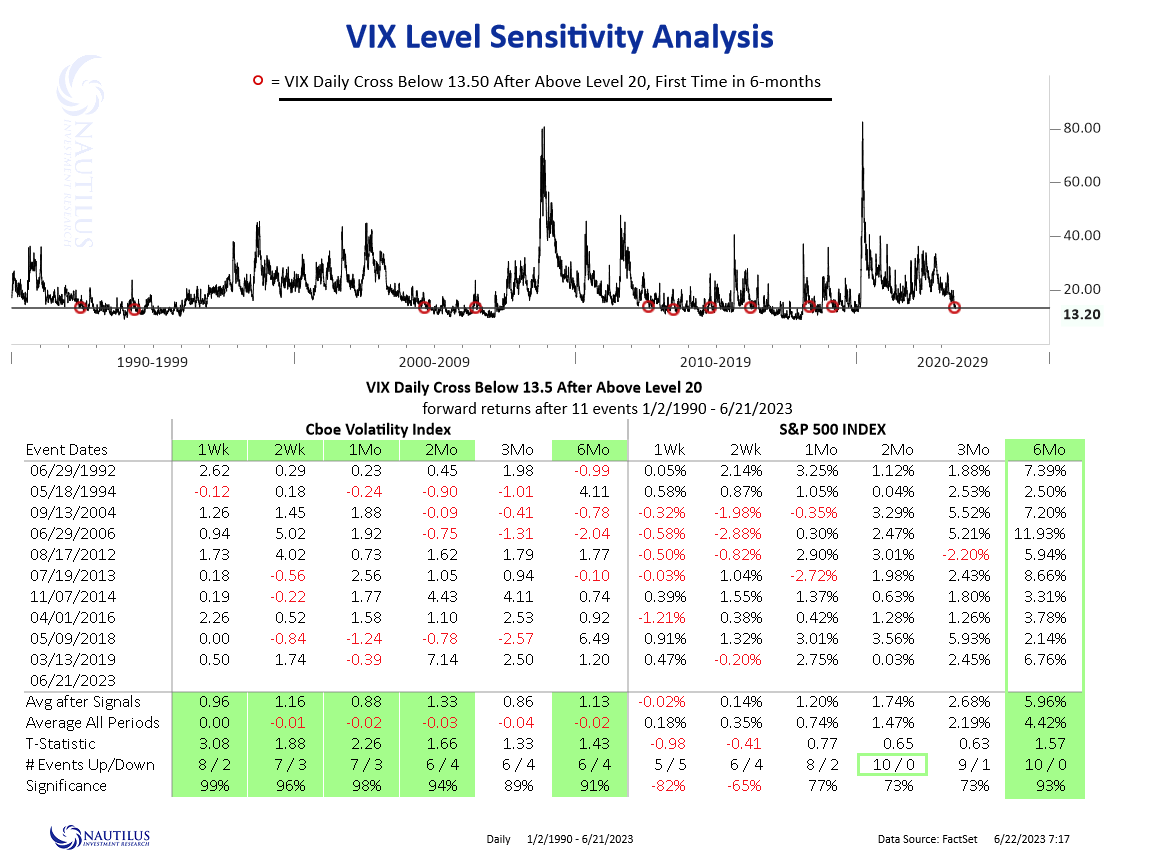
VIX Cross below 13.50 after previously above 20.00 -- first time in 6-months.
By: Nautilus Research | June 22, 2023
• #VIX $VIX $SPX VIX Cross below 13.50 after previously above 20.00 -- first time in 6-months.
Read Full Story »»»
DiscoverGold
Bank of England surprises with 50-basis-point rate hike to tackle persistent inflation
This is a developing news story. Please check back for updates:
https://www.cnbc.com/2023/06/22/bank-of-england-june-decision-50-basis-point-rate-hike-to-tackle-persistent-inflation.html
Overstock.com wins auction for Bed Bath & Beyond's intellectual property, digital assets
This is a developing news story. Please check back for updates:
https://www.cnbc.com/2023/06/22/overstockcom-wins-bed-bath-beyond-auction.html
Margin Debt Up 1.9% in May
By: Jennifer Nash | June 20, 2023
Margin debt is the amount of money an investor borrows from their broker via a margin account. Trading with a margin debt can magnify gains because an investor can benefit from the upside of any stock without having to invest 100%, resulting in greater profit. With that being said, trading with margin debt can also exacerbate losses because if a stock's value were to depreciate, the investor may face a margin call and would need to come up with additional cash to reach the minimum requirement.
The Latest Margin Data
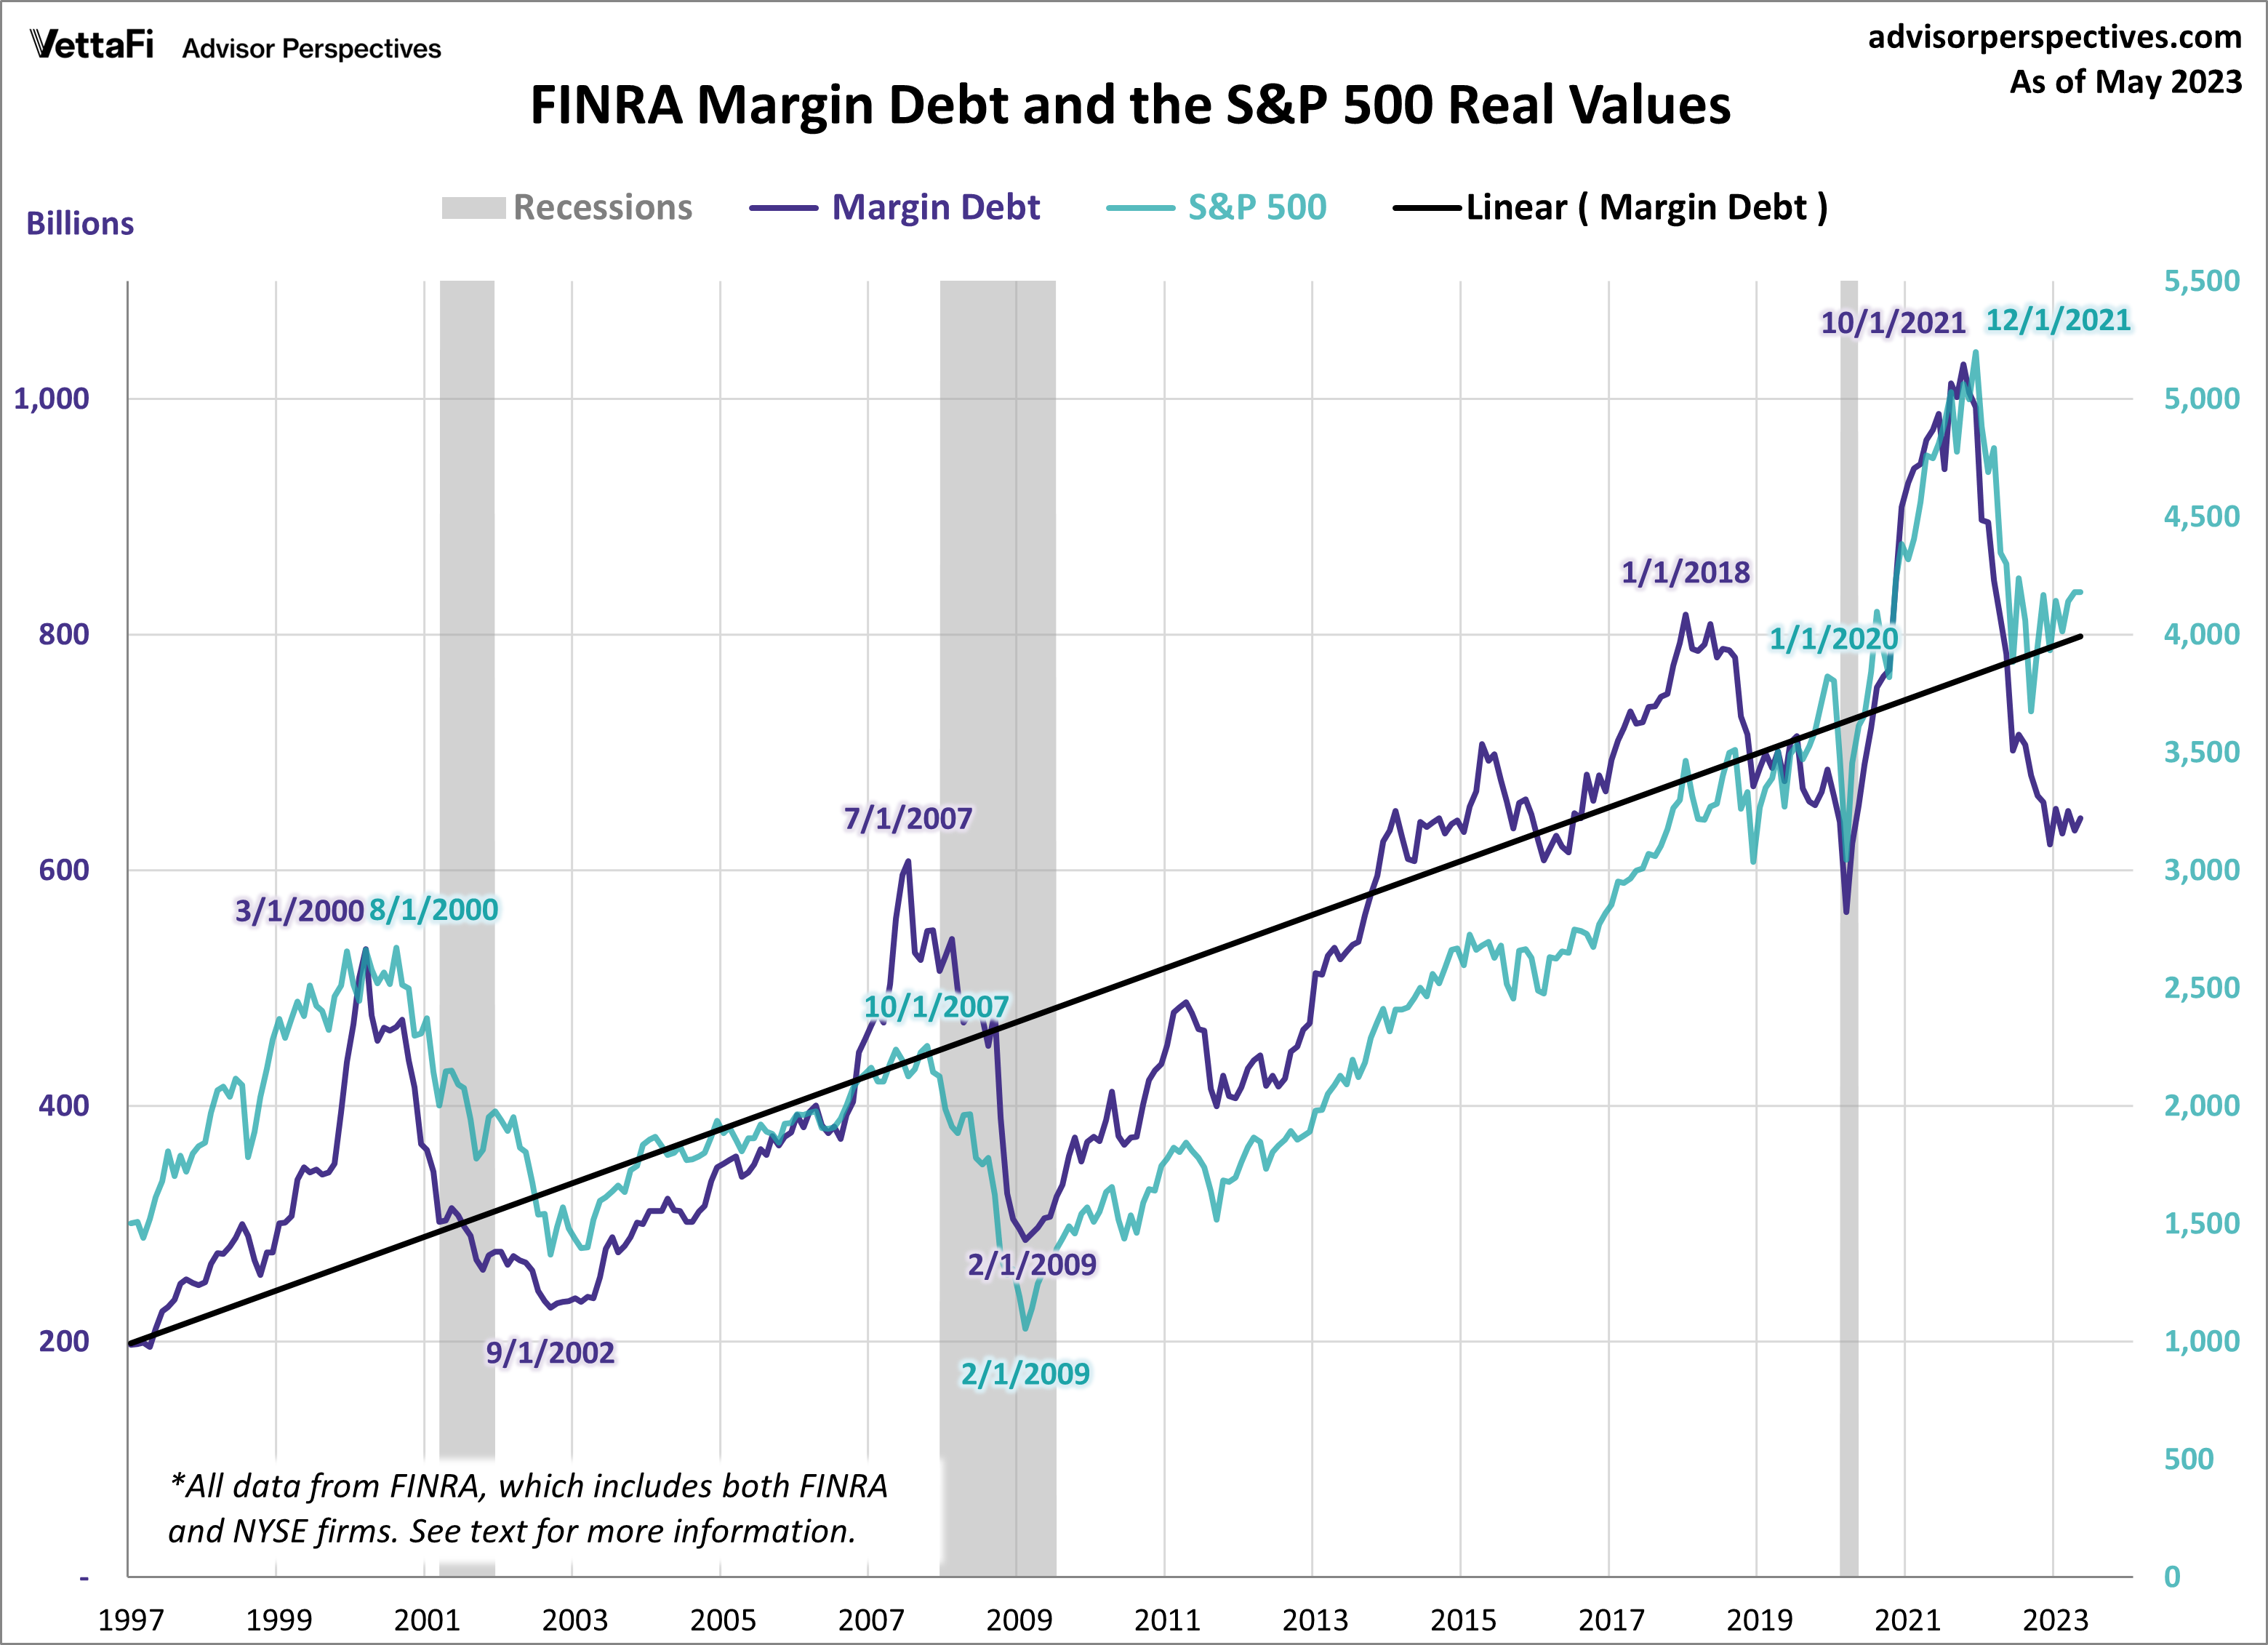
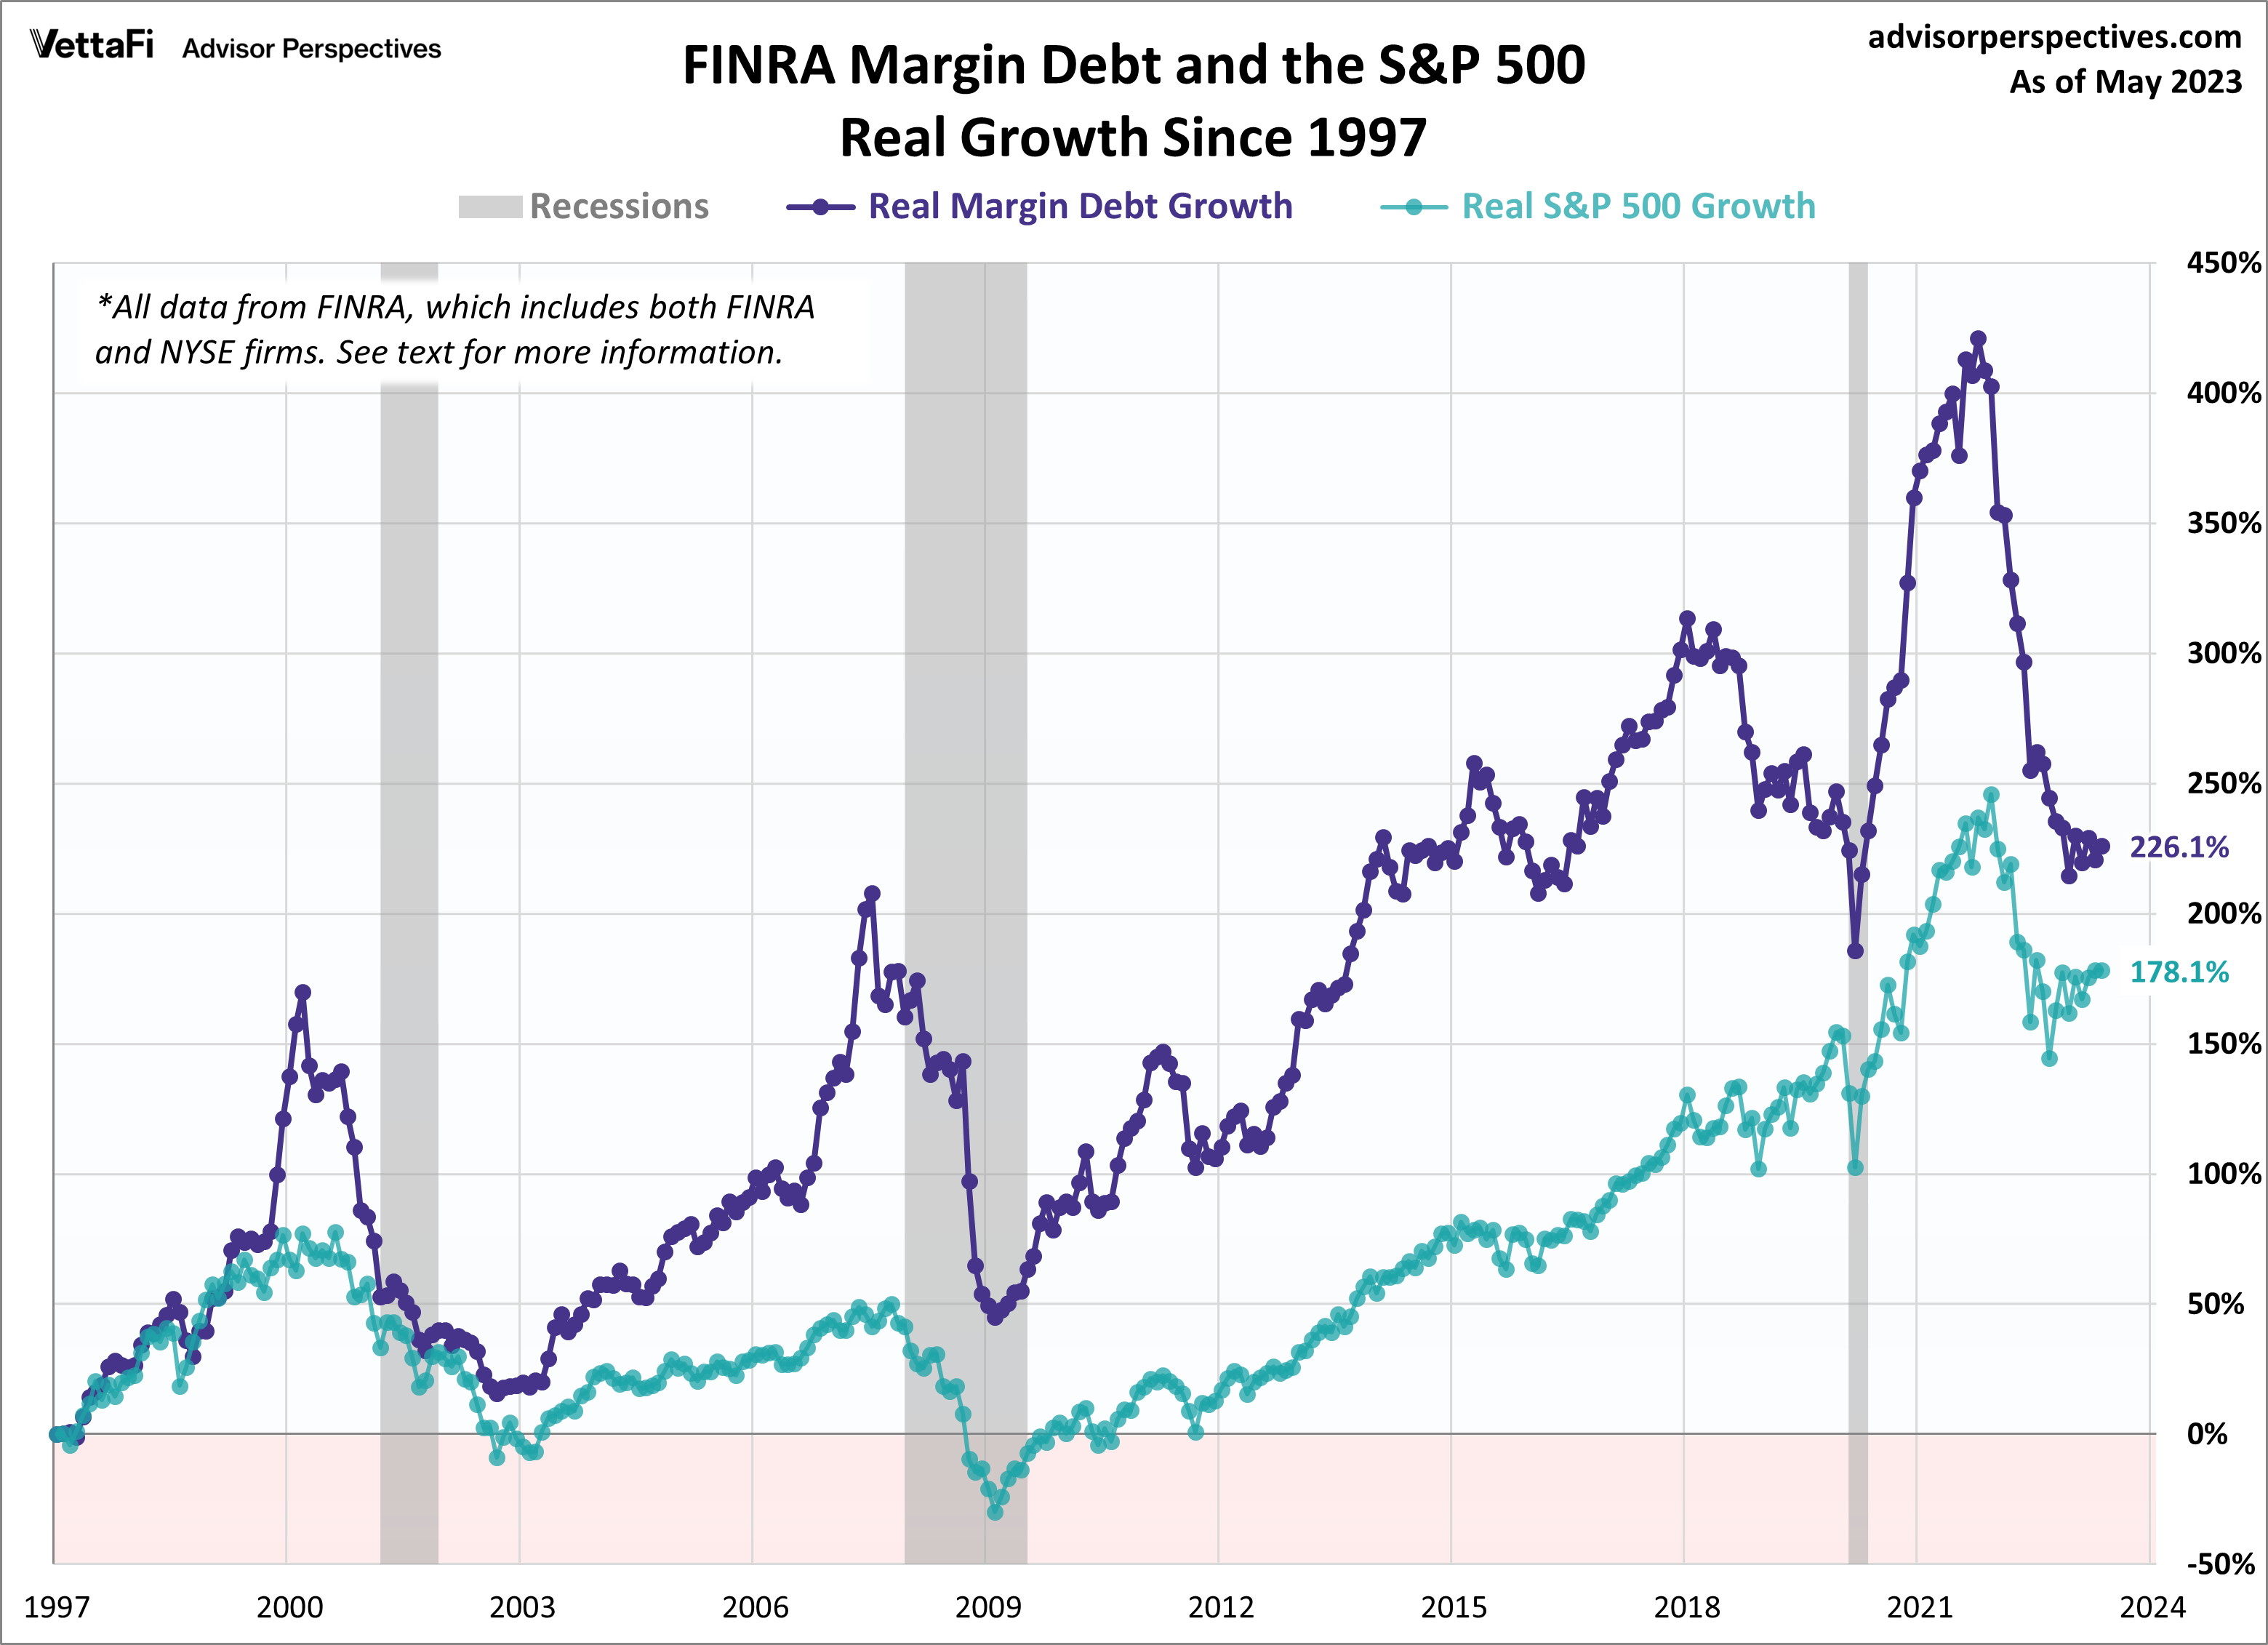
FINRA has released new data for margin debt, now available through May. The latest debt level is at 644.17 billion, up 1.9% month-over-month (MoM) and down 14.5% year-over-year (YoY). However, after adjusting for inflation, debt level is up 1.7% MoM and down 17.8% YoY. Let's examine the numbers and study the relationship between margin debt and the market, using the S&P 500 as the surrogate for the latter.
The first chart shows the two series in real terms — adjusted for inflation to today's dollar using the consumer price index (CPI) as the deflator. At the 1997 start date, we were well into the boomer bull market that began in 1982 and approaching the start of the tech bubble that shaped investor sentiment during the second half of the decade. The astonishing surge in leverage in late 1999 peaked in March 2000, the same month that the S&P 500 hit an interim daily high, although the highest monthly close for that year was five months later in August. A similar surge began in 2006, peaking in July 2007, three months before the market peak. Debt hit a trough in February 2009, the same month the market hit a bottom. It then began another major cycle of increases. Most recently, we saw a similar surge after the COVID-pandemic, peaking in October 2021, two months before the market's all-time high.
Note on the data: The FINRA only posts the free credit cash accounts data back to 1997. The free credit cash accounts data back to 1980 is available on a fee basis from Haver Analytics.
At the suggestion of Mark Schofield, managing director at Strategic Value Capital Management, LLC, I've created the same chart with margin debt inverted so that we see the relationship between the two as a divergence.
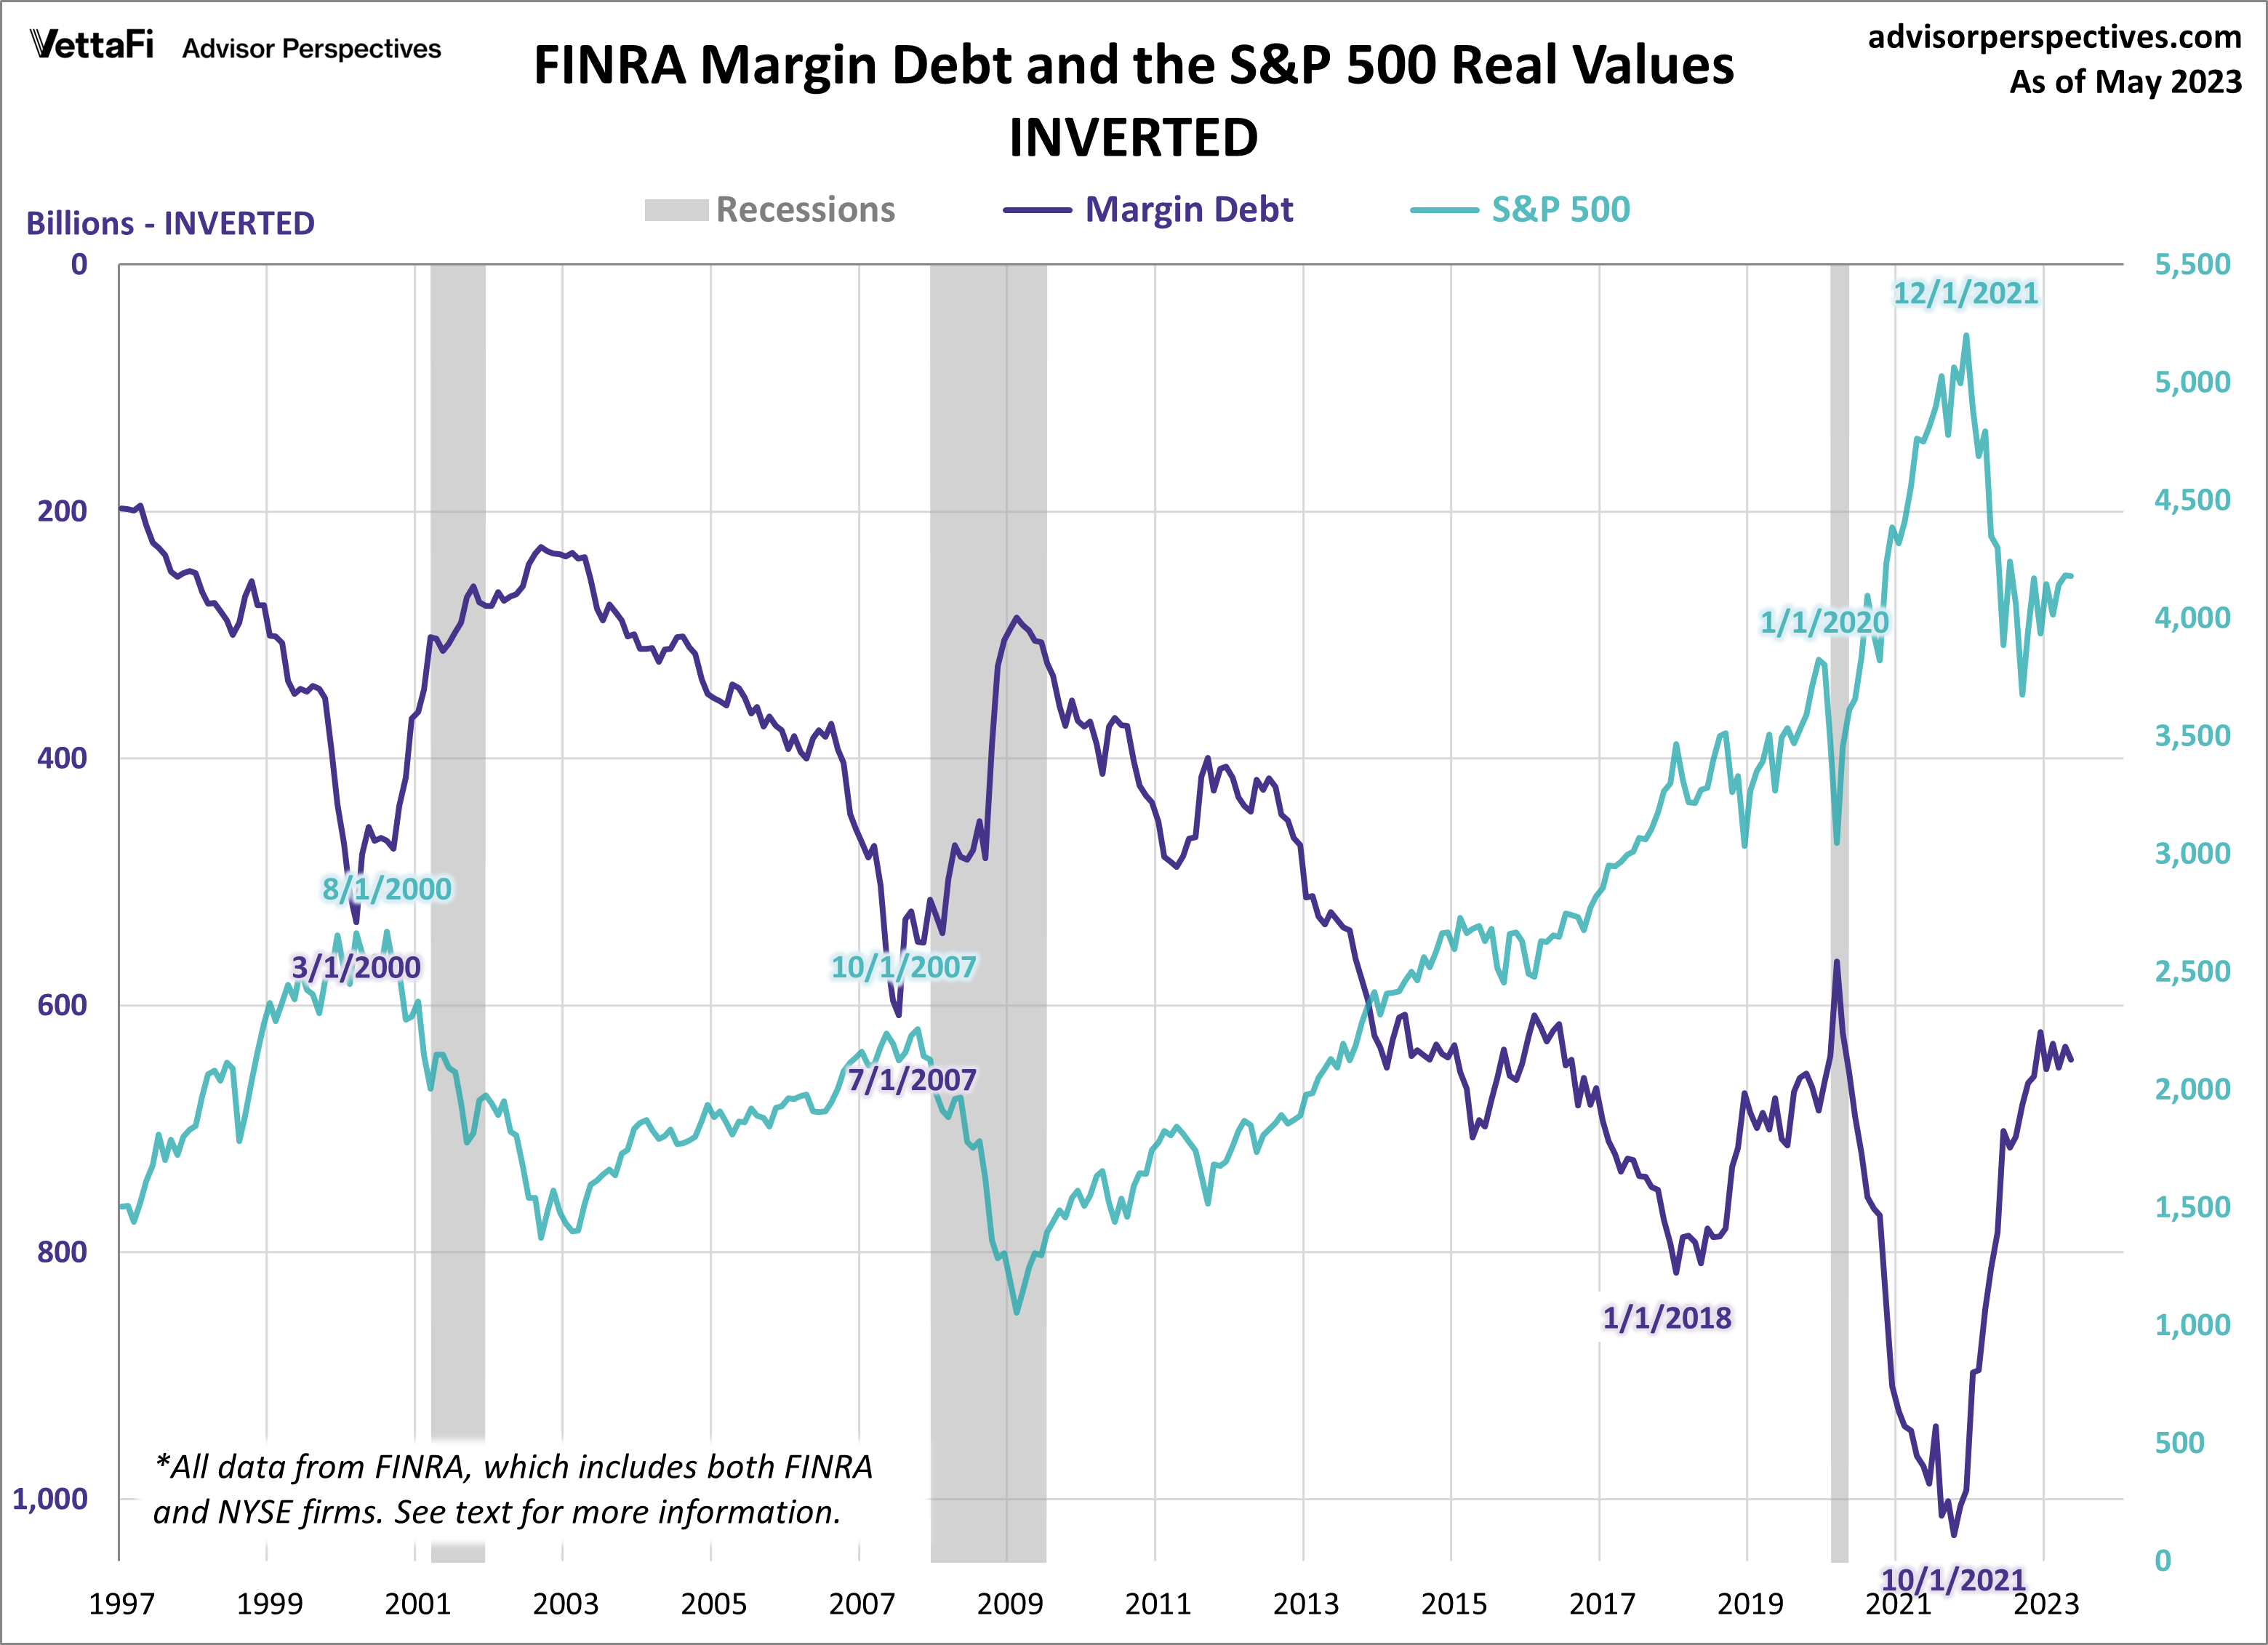
The next chart shows the percentage growth of the two data series from the same 1997 starting date, again based on real (inflation-adjusted) data. I've added markers to show the precise monthly values. Margin debt grew at a rate comparable to the market from 1997 to late summer of 2000 before soaring into the stratosphere. The two synchronized in their rate of contraction in early 2001. But with recovery after the tech crash, margin debt gradually returned to a growth rate closer to its former self in the second half of the 1990s rather than the more restrained real growth of the S&P 500. But by September of 2006, margin debt again went ballistic. It finally peaked in the summer of 2007, about three months before the market. Debt continues to peak as does the market soon after. Most recent evidence of this was in 2021 when the margin debt peaked in October and the market followed two months later by peaking in December.
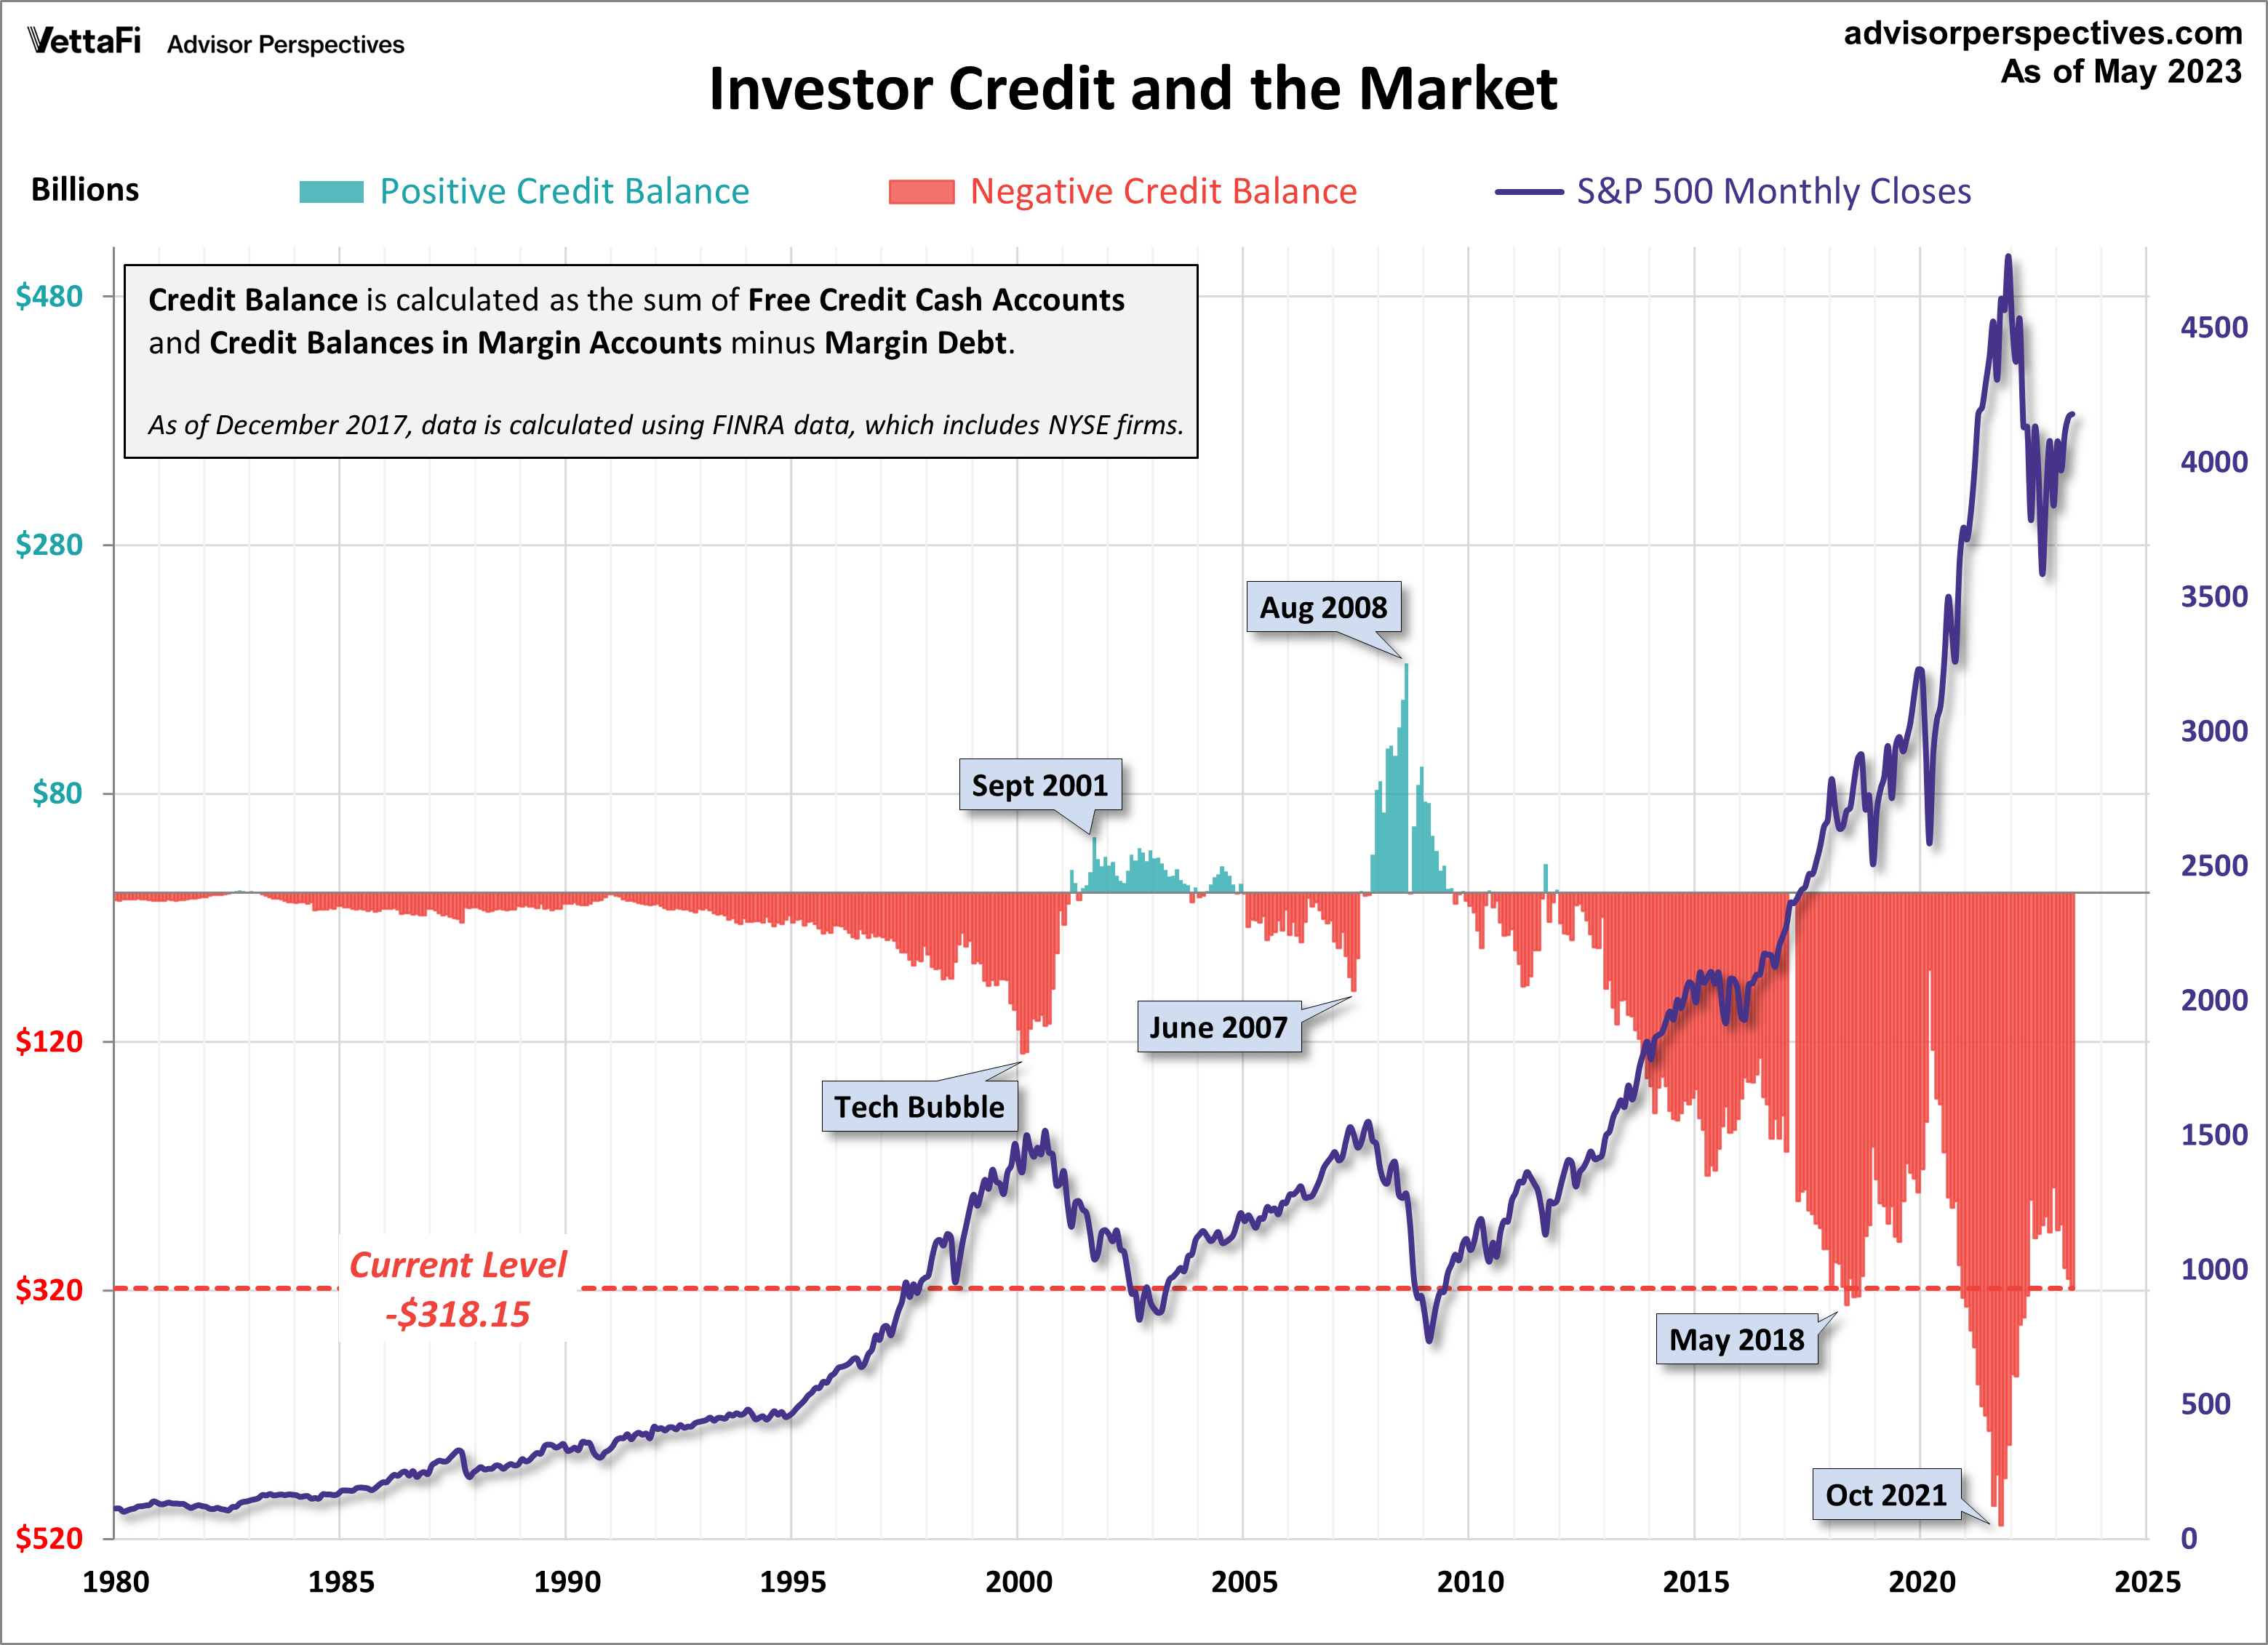
NYSE Investor Credit
Lance Roberts of Real Investment Advice analyzes margin debt in the larger context that includes free cash accounts and credit balances in margin accounts. Essentially, he calculates the credit balance as the sum of free credit cash accounts and credit balances in margin accounts minus margin debt. The chart below illustrates the mathematics of Credit Balance with an overlay of the S&P 500. Note that the chart below is based on nominal data, not adjusted for inflation. Here, we have retained the NYSE data through November 2017 and switched to the FINRA data. (see note at end of article)
Here's a slightly closer look at the data, starting with 1997. Also, I've inverted the investor credit monthly data and used markers to pinpoint key turning points.
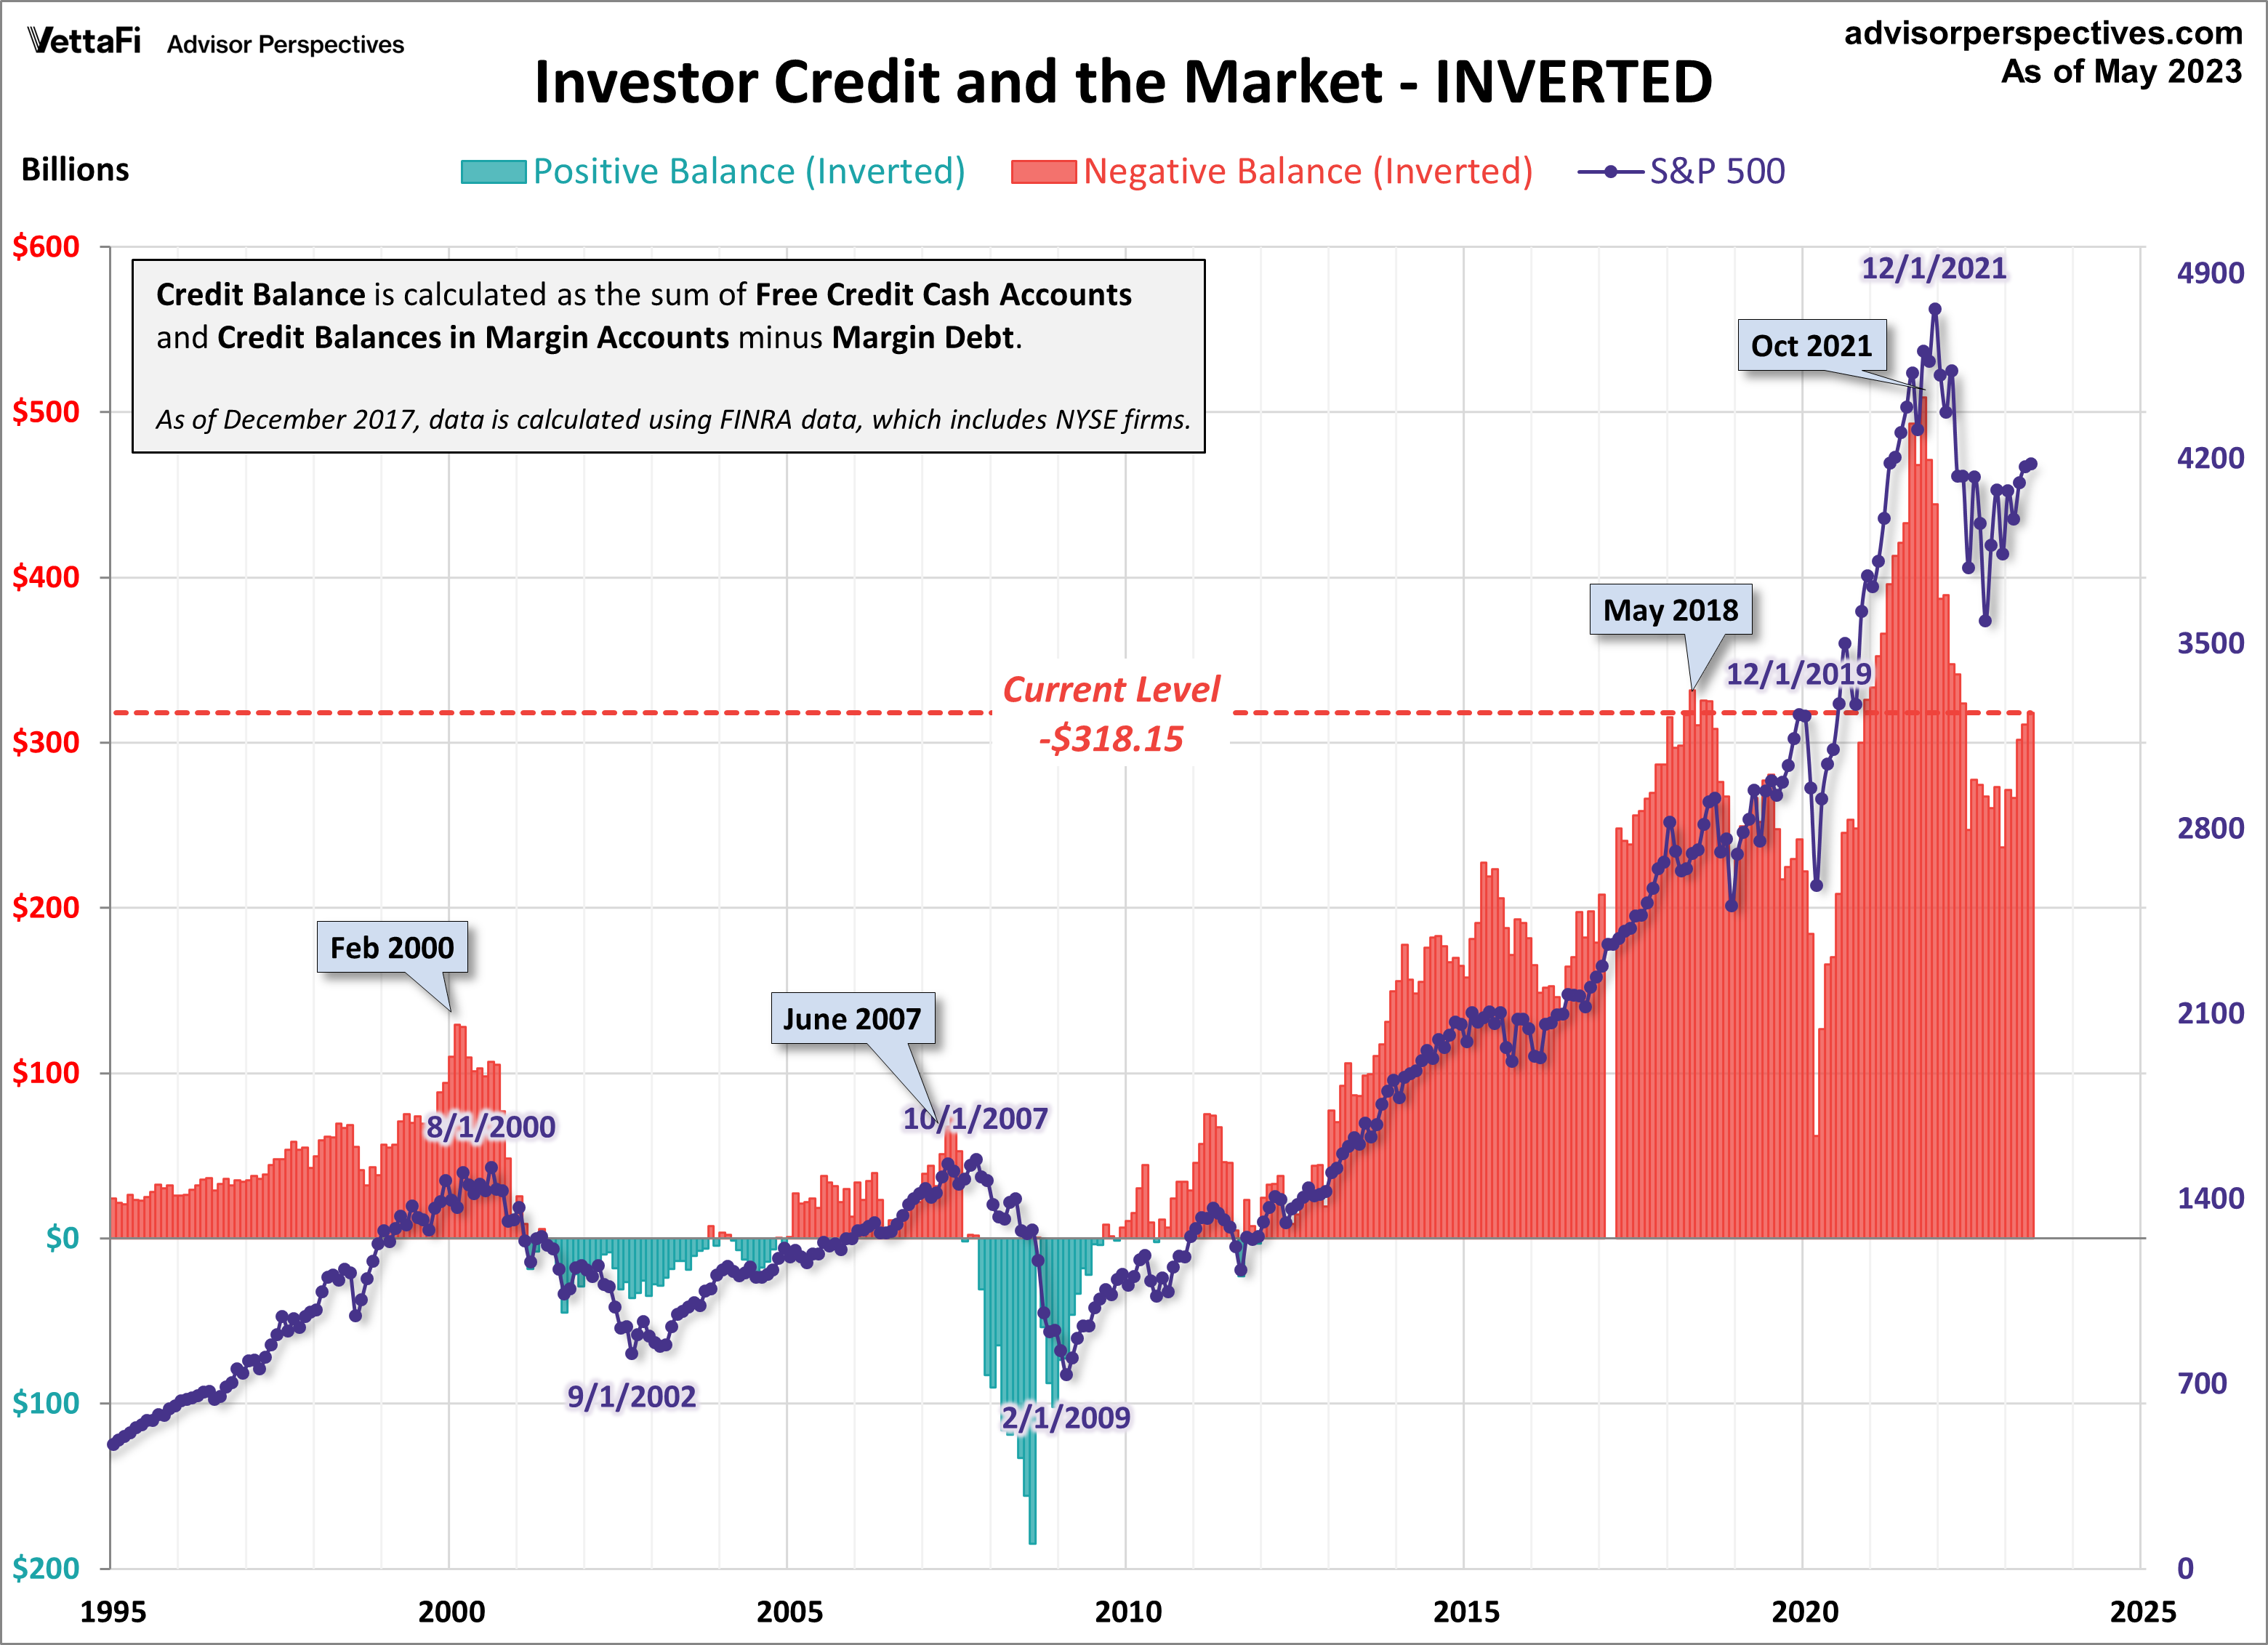
As I pointed out above, margin debt data is several weeks old when it is published. Thus, even though it may, in theory, be a leading indicator, a major shift in margin debt isn't immediately evident. Nevertheless, we see that the troughs in the monthly net credit balance preceded peaks in the monthly S&P 500 closes by six months in 2000 and four months in 2007.
We are past the longest bull market in history. The peak in margin debt preceded the peak in the monthly S&P closes (the December 2019 peak) by 23 months, much longer than the previous shifts prior to corrections. Interestingly, the most recent peak (Dec 2021) was not preceded by a trough, unless we use the February 2009 point as a reference!
Margin Debt: Conclusions
There are too few peak-trough episodes in this overlay series to take the latest credit balance data as a leading indicator of a major selloff in U.S. equities. This has been an interesting indicator to watch and will certainly continue to bear close watching in the future.
Read Full Story »»»
DiscoverGold
UK inflation exceeds expectations in May, piling pressure on the government and Bank of England
This is a developing news story. Please check back for updates:
https://www.cnbc.com/2023/06/21/uk-inflation-exceeds-expectations-in-may-piling-pressure-on-the-government-and-bank-of-england.html
|
Followers
|
325
|
Posters
|
|
|
Posts (Today)
|
0
|
Posts (Total)
|
76351
|
|
Created
|
07/07/03
|
Type
|
Free
|
| Moderator chichi2 | |||
| Assistants DiscoverGold | |||
♦ BE SURE TO TRY ME = Ticker Cloud = Most Popular Tickers Right Now!
For Continuous FUTURES CHARTS Pre-Market and Intra-Day, click on this URL
then choose your "Majors" choice. ("Majors" is their word for "Markets").
http://www.forexpros.com/charts/real-time-futures-charts
♦ CHARTS Just click any underlined words ALL Charts are = 2O MINUTE DELAYED
 General Market Indices Daily and Intra-Day Charts $SPX,$COMPQ,$INDU,SPY,QQQ,DIA,MDY,IWM,GLD,SLY
 The Nine (9) Major Sectors of the Economy 2day-10min, 3month-daily (Side By Side) Charts
 McClellan Oscillators and Summation Charts
♦ DIVIDEND STOCKS
 Ways to Invest for Dividends: ETFs ♦ Stocks With Fastest Dividend Growth ♦ High-Yielding Mutual Funds
 101 High Yielding ETFs For Every Dividend Investor: US Dividend Stock ETFs ♦ Emerging Market Dividend Stock ETFs ♦ International / Global
Dividend Stock ETFs
♦ INTEREST RATES
 Interest Rate Trends: Historical graphs for mortgage rates ♦ Long term trends
♦ BOND OFFERINGS
 Bond Offering Calendar: Treasuries ♦ Public and Municipal Finance ♦ Corporate Debt
Just click>>
Myself °¿°'s Daily charts for $INDU, $NYA $SPX, $OEX, $COMPQ
Then follow "NEXT" for Weekly, Monthly chart sets.
Or Same chart sets as above; Individual/Direct links for the Daily Weekly Monthly sets.
Daily INDU NYA SPX OEX COMPQ ~ Weekly INDU NYA SPX OEX COMPQ ~ Monthly INDU NYA SPX OEX COMPQ
*******************************************************************************************************************************************
*******************************************************************************************************************************************
AWARDS OF MERIT FOR SIGNIFICANT CONTRIBUTION TO THE BOARD:
---(DiscoverGold (2nd award)--Myself °¿°--Chris McConnel(2nd award)--(DiscoverGold - Bob3(2nd award)- OrangeFluffyCat--Chichi2--Bob3--Dimension--4Godnwv--Xe2dy--Be--Cyber2001--Chris McConnell
*******************************************************************************************************************************************
BOARD MISSION STATEMENT:
Most of this board's WATCHERS are "lurkers" who appreciate info available without the need to sift through tons of "empty" posts. The Goal is to maintain a board of: -- unusual quality -- friendly -- full of info
(much based in technical analysis);--- free of spam -- pumping/bashing -- and idle chatter.
To help us evaluate our performance, please "BoardMark" the board if you find it useful.
To do so, just click on "Add to Favorites" Button at Right just above the Posts Dates.
*Everyone* is encouraged to share their favorite links, and any "finds" they come across, as a fair exchange for what they may gain from the work of others on this board. Another board goal is to have as wide a collection of resources, and diversity of opinion. Accordingly, posts are made in the interest of that diversity, and are not necessarily reflective of the poster's own position.
There are MCO small change Alerts which tend to forecast Indices Major Moves.
Ideas or thoughts on how the board can be improved are welcome.
If you get stock ideas that you think are worthy, please post them, if you can add a chart. Be aware no one here is responsible for any stocks or equities or whatever that you choose to put money into, except yourself. Think before you act, not afterward when it may be too late
*******************************************************************

This theoretical model is based on Sam Stovall's >>
S&P's Guide to Sector Rotation and states that different sectors are stronger at different points in the economic cycle. The graph above shows these relationships and the order in which the various sectors should get a boost from the economy. The Market Cycle preceeds the Economic Cycle because investors try to anticipate economic effects. The PerfChart (click this button) tries to help you see this effect
| Stage: | Full Recession | Early Recovery | Full Recovery | Early Recession |
|---|---|---|---|---|
| Consumer Expectations: | Reviving | Rising | Declining | Falling Sharply |
| Industrial Production: | Bottoming Out | Rising | Flat | Falling |
| Interest Rates: | Falling | Bottoming Out | Rising Rapidly (Fed) | Peaking |
| Yield Curve: | Normal | Normal (Steep) | Flattening Out | Flat/Inverted |
Next Day - Futures: Before Trading Today Trading Today Trading
For Continuous FUTURES CHARTS Pre-Market and Intra-Day, click on this URL
then choose your "Majors" choice. ("Majors" is their word for "Markets")
http://www.forexpros.com/charts/real-time-futures-charts


| Volume | |
| Day Range: | |
| Bid Price | |
| Ask Price | |
| Last Trade Time: |


