


| Followers | 679 |
| Posts | 140955 |
| Boards Moderated | 36 |
| Alias Born | 03/10/2004 |
Wednesday, June 21, 2023 9:02:23 AM
Margin Debt Up 1.9% in May
By: Jennifer Nash | June 20, 2023
Margin debt is the amount of money an investor borrows from their broker via a margin account. Trading with a margin debt can magnify gains because an investor can benefit from the upside of any stock without having to invest 100%, resulting in greater profit. With that being said, trading with margin debt can also exacerbate losses because if a stock's value were to depreciate, the investor may face a margin call and would need to come up with additional cash to reach the minimum requirement.
The Latest Margin Data
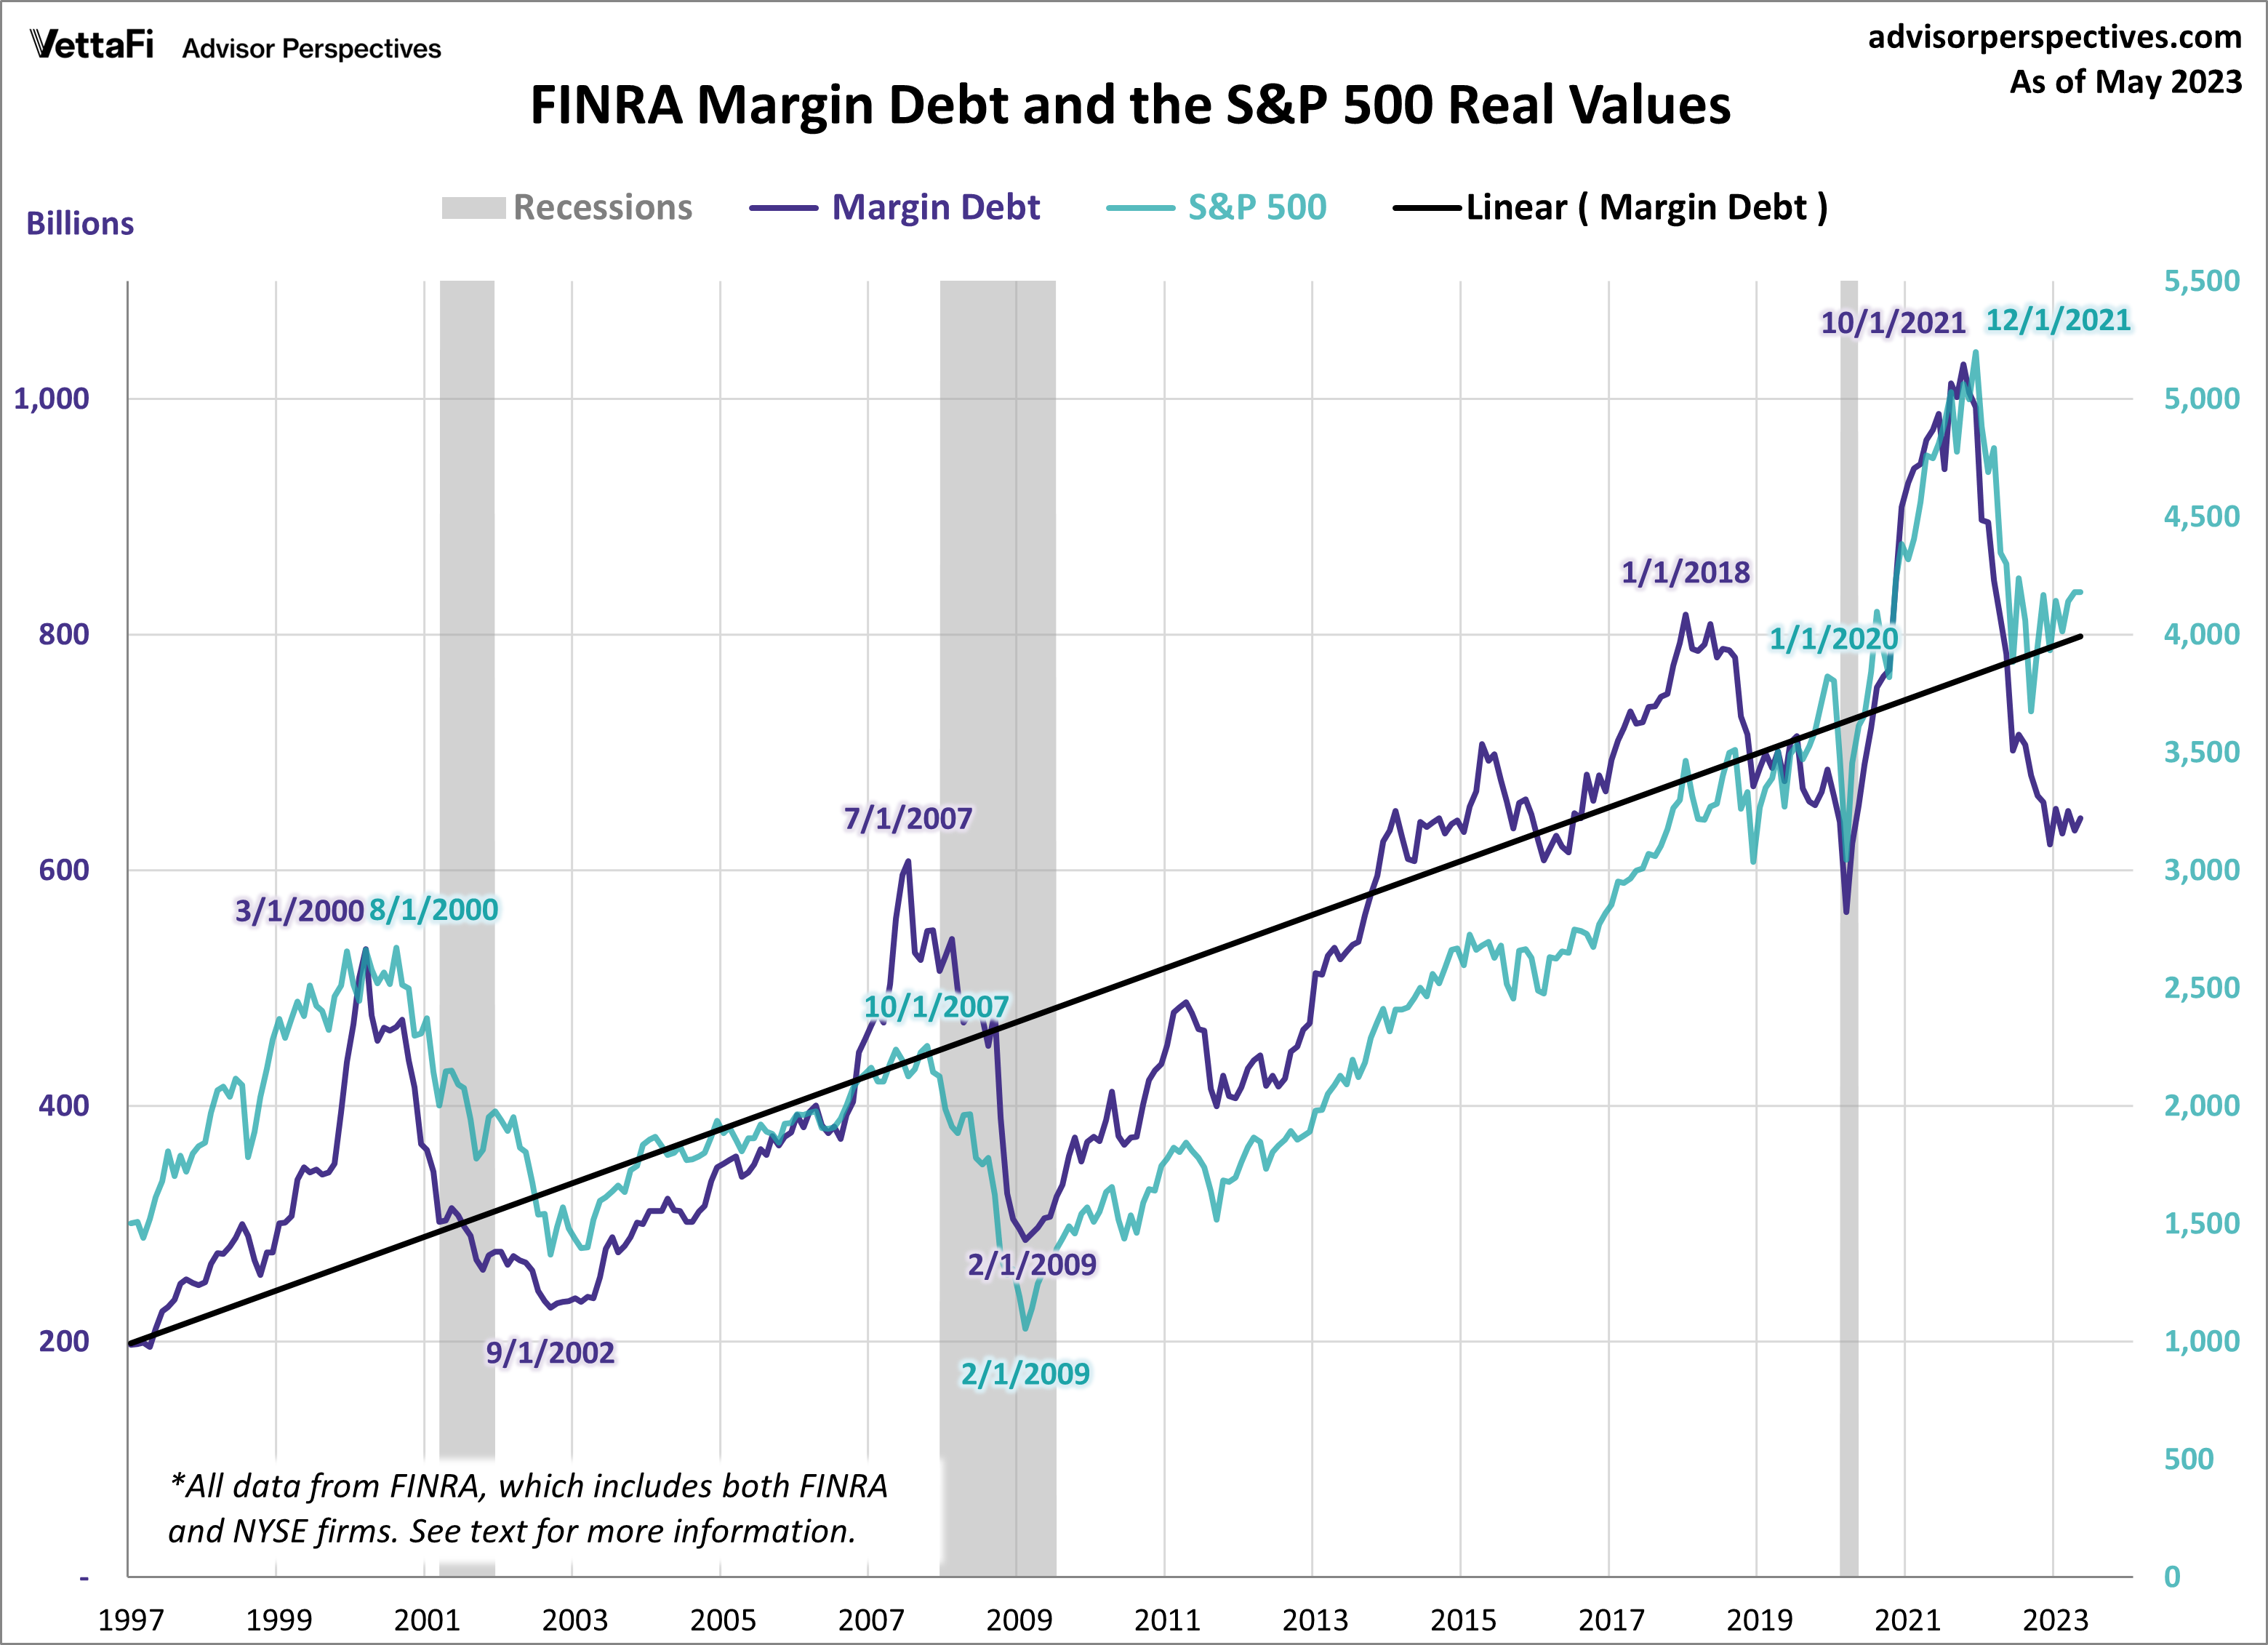
FINRA has released new data for margin debt, now available through May. The latest debt level is at 644.17 billion, up 1.9% month-over-month (MoM) and down 14.5% year-over-year (YoY). However, after adjusting for inflation, debt level is up 1.7% MoM and down 17.8% YoY. Let's examine the numbers and study the relationship between margin debt and the market, using the S&P 500 as the surrogate for the latter.
The first chart shows the two series in real terms — adjusted for inflation to today's dollar using the consumer price index (CPI) as the deflator. At the 1997 start date, we were well into the boomer bull market that began in 1982 and approaching the start of the tech bubble that shaped investor sentiment during the second half of the decade. The astonishing surge in leverage in late 1999 peaked in March 2000, the same month that the S&P 500 hit an interim daily high, although the highest monthly close for that year was five months later in August. A similar surge began in 2006, peaking in July 2007, three months before the market peak. Debt hit a trough in February 2009, the same month the market hit a bottom. It then began another major cycle of increases. Most recently, we saw a similar surge after the COVID-pandemic, peaking in October 2021, two months before the market's all-time high.
Note on the data: The FINRA only posts the free credit cash accounts data back to 1997. The free credit cash accounts data back to 1980 is available on a fee basis from Haver Analytics.
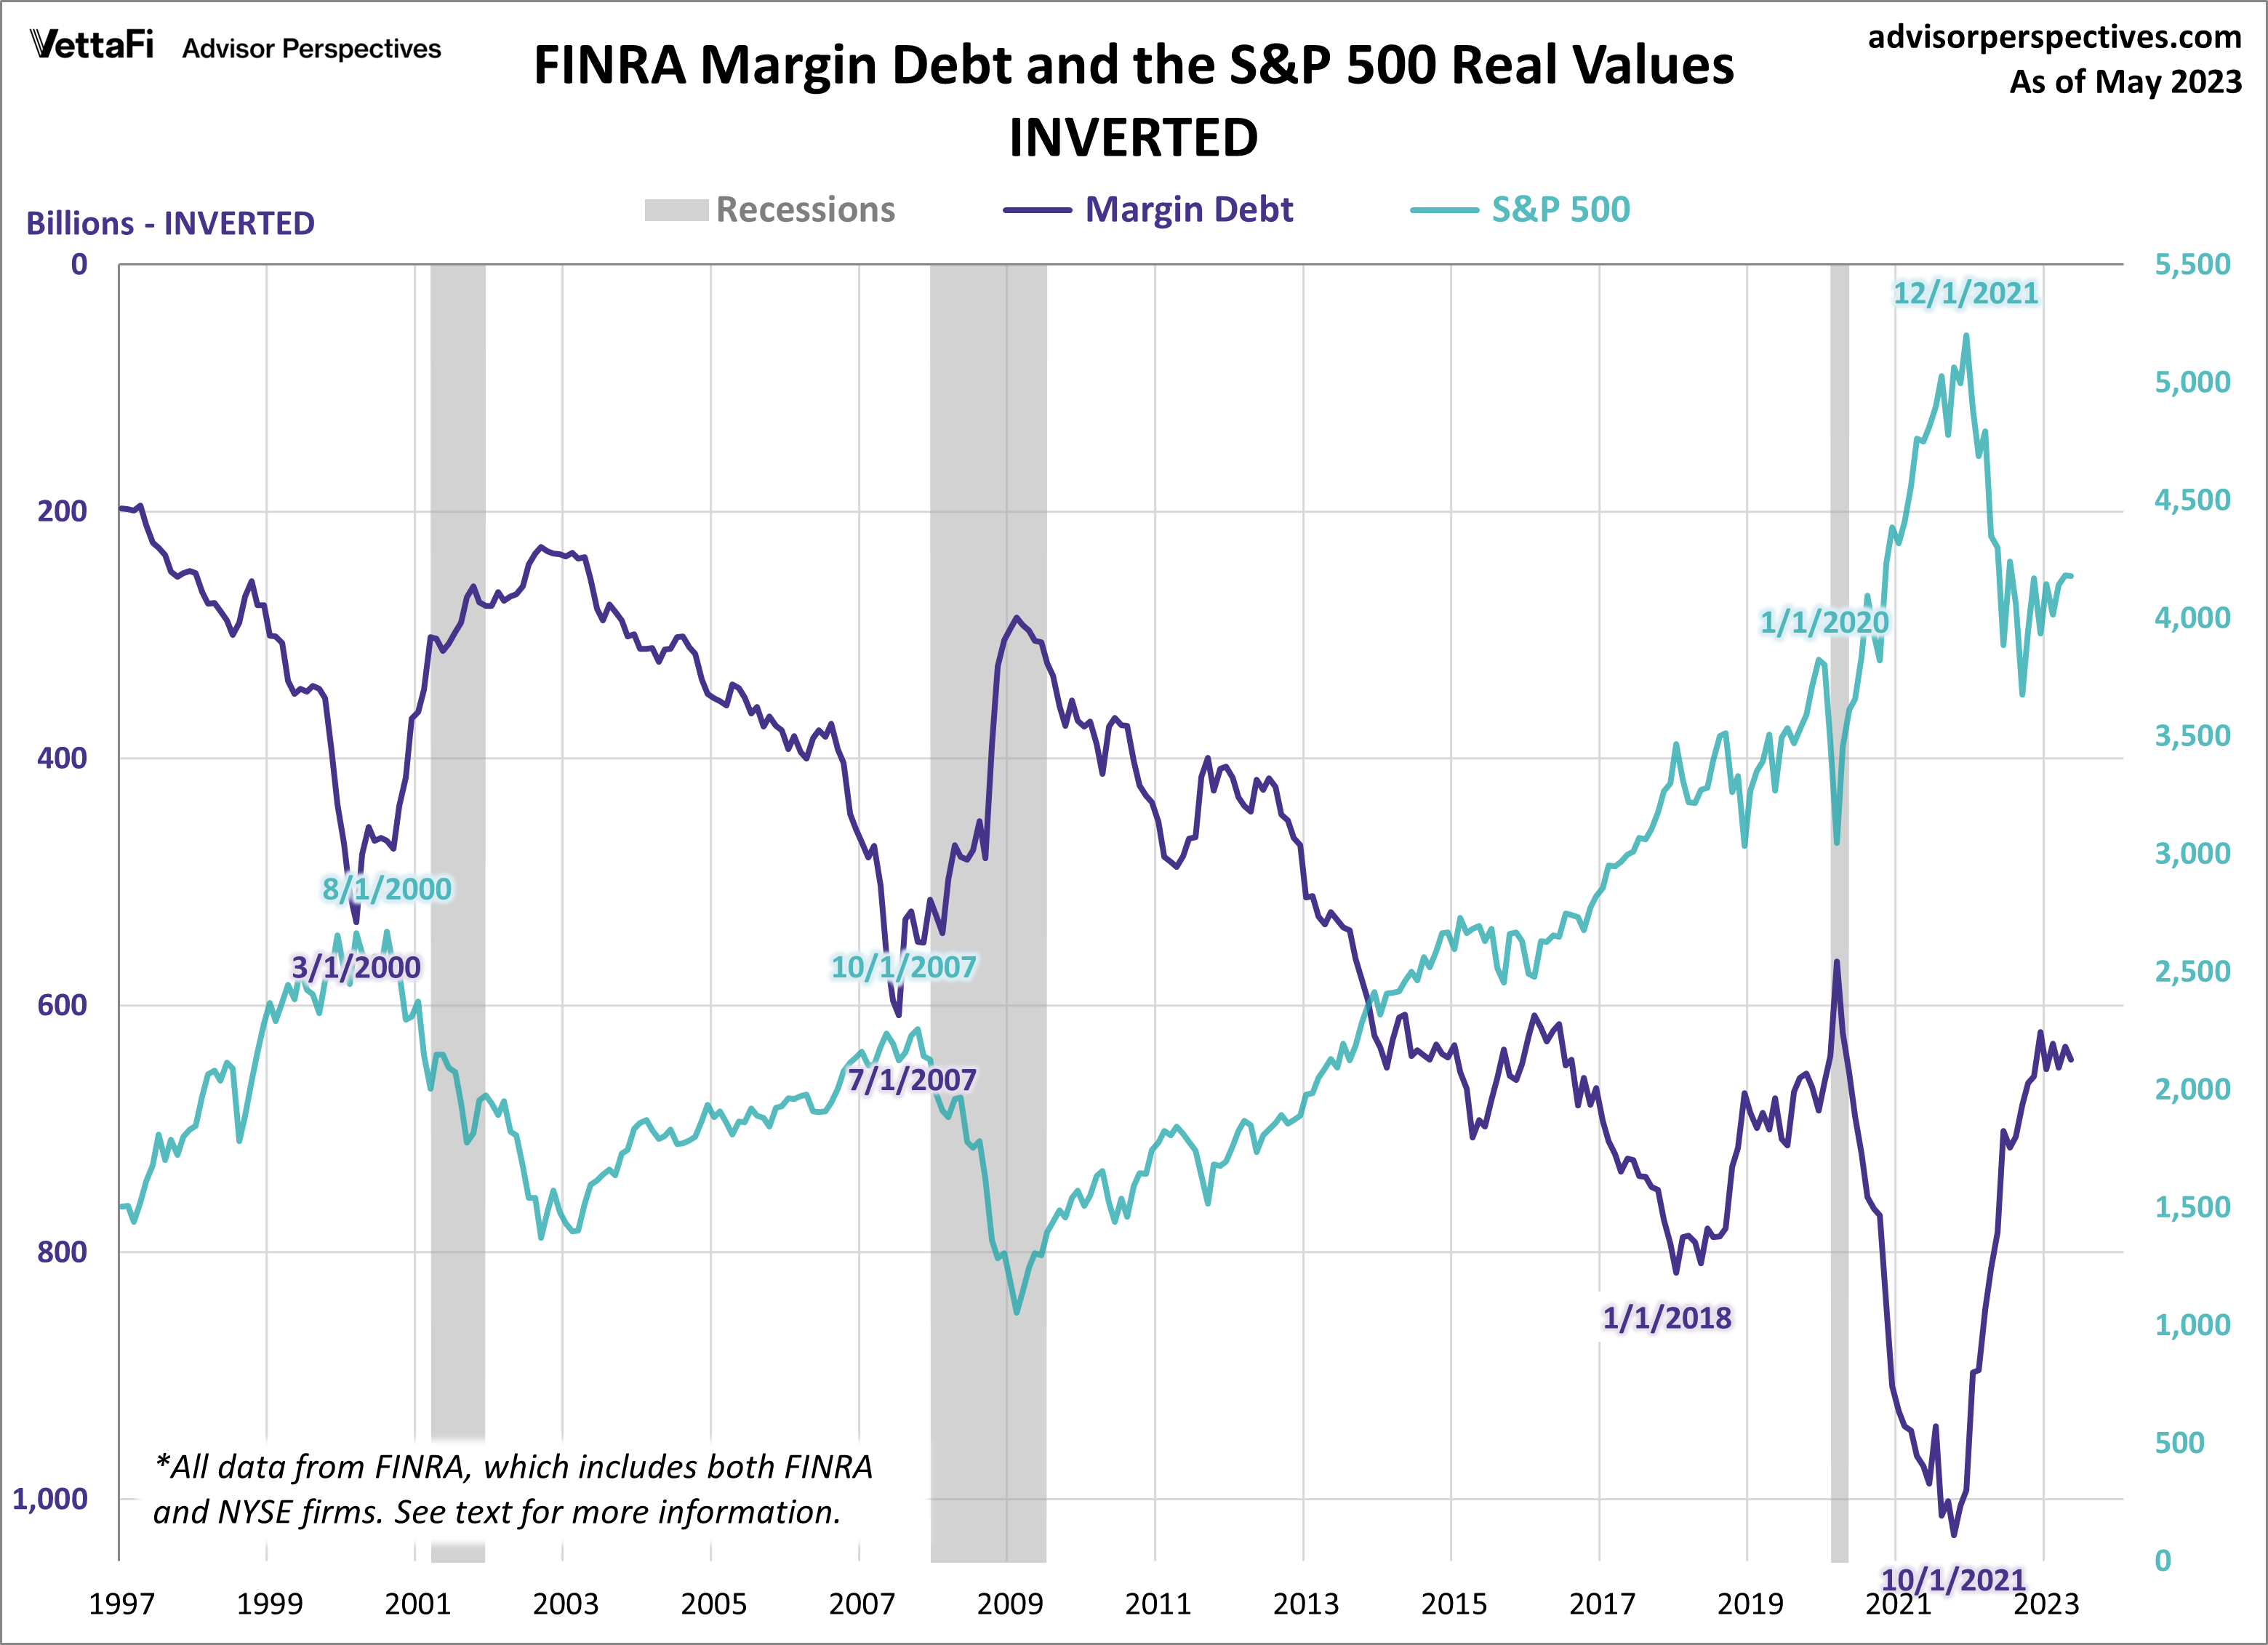
At the suggestion of Mark Schofield, managing director at Strategic Value Capital Management, LLC, I've created the same chart with margin debt inverted so that we see the relationship between the two as a divergence.
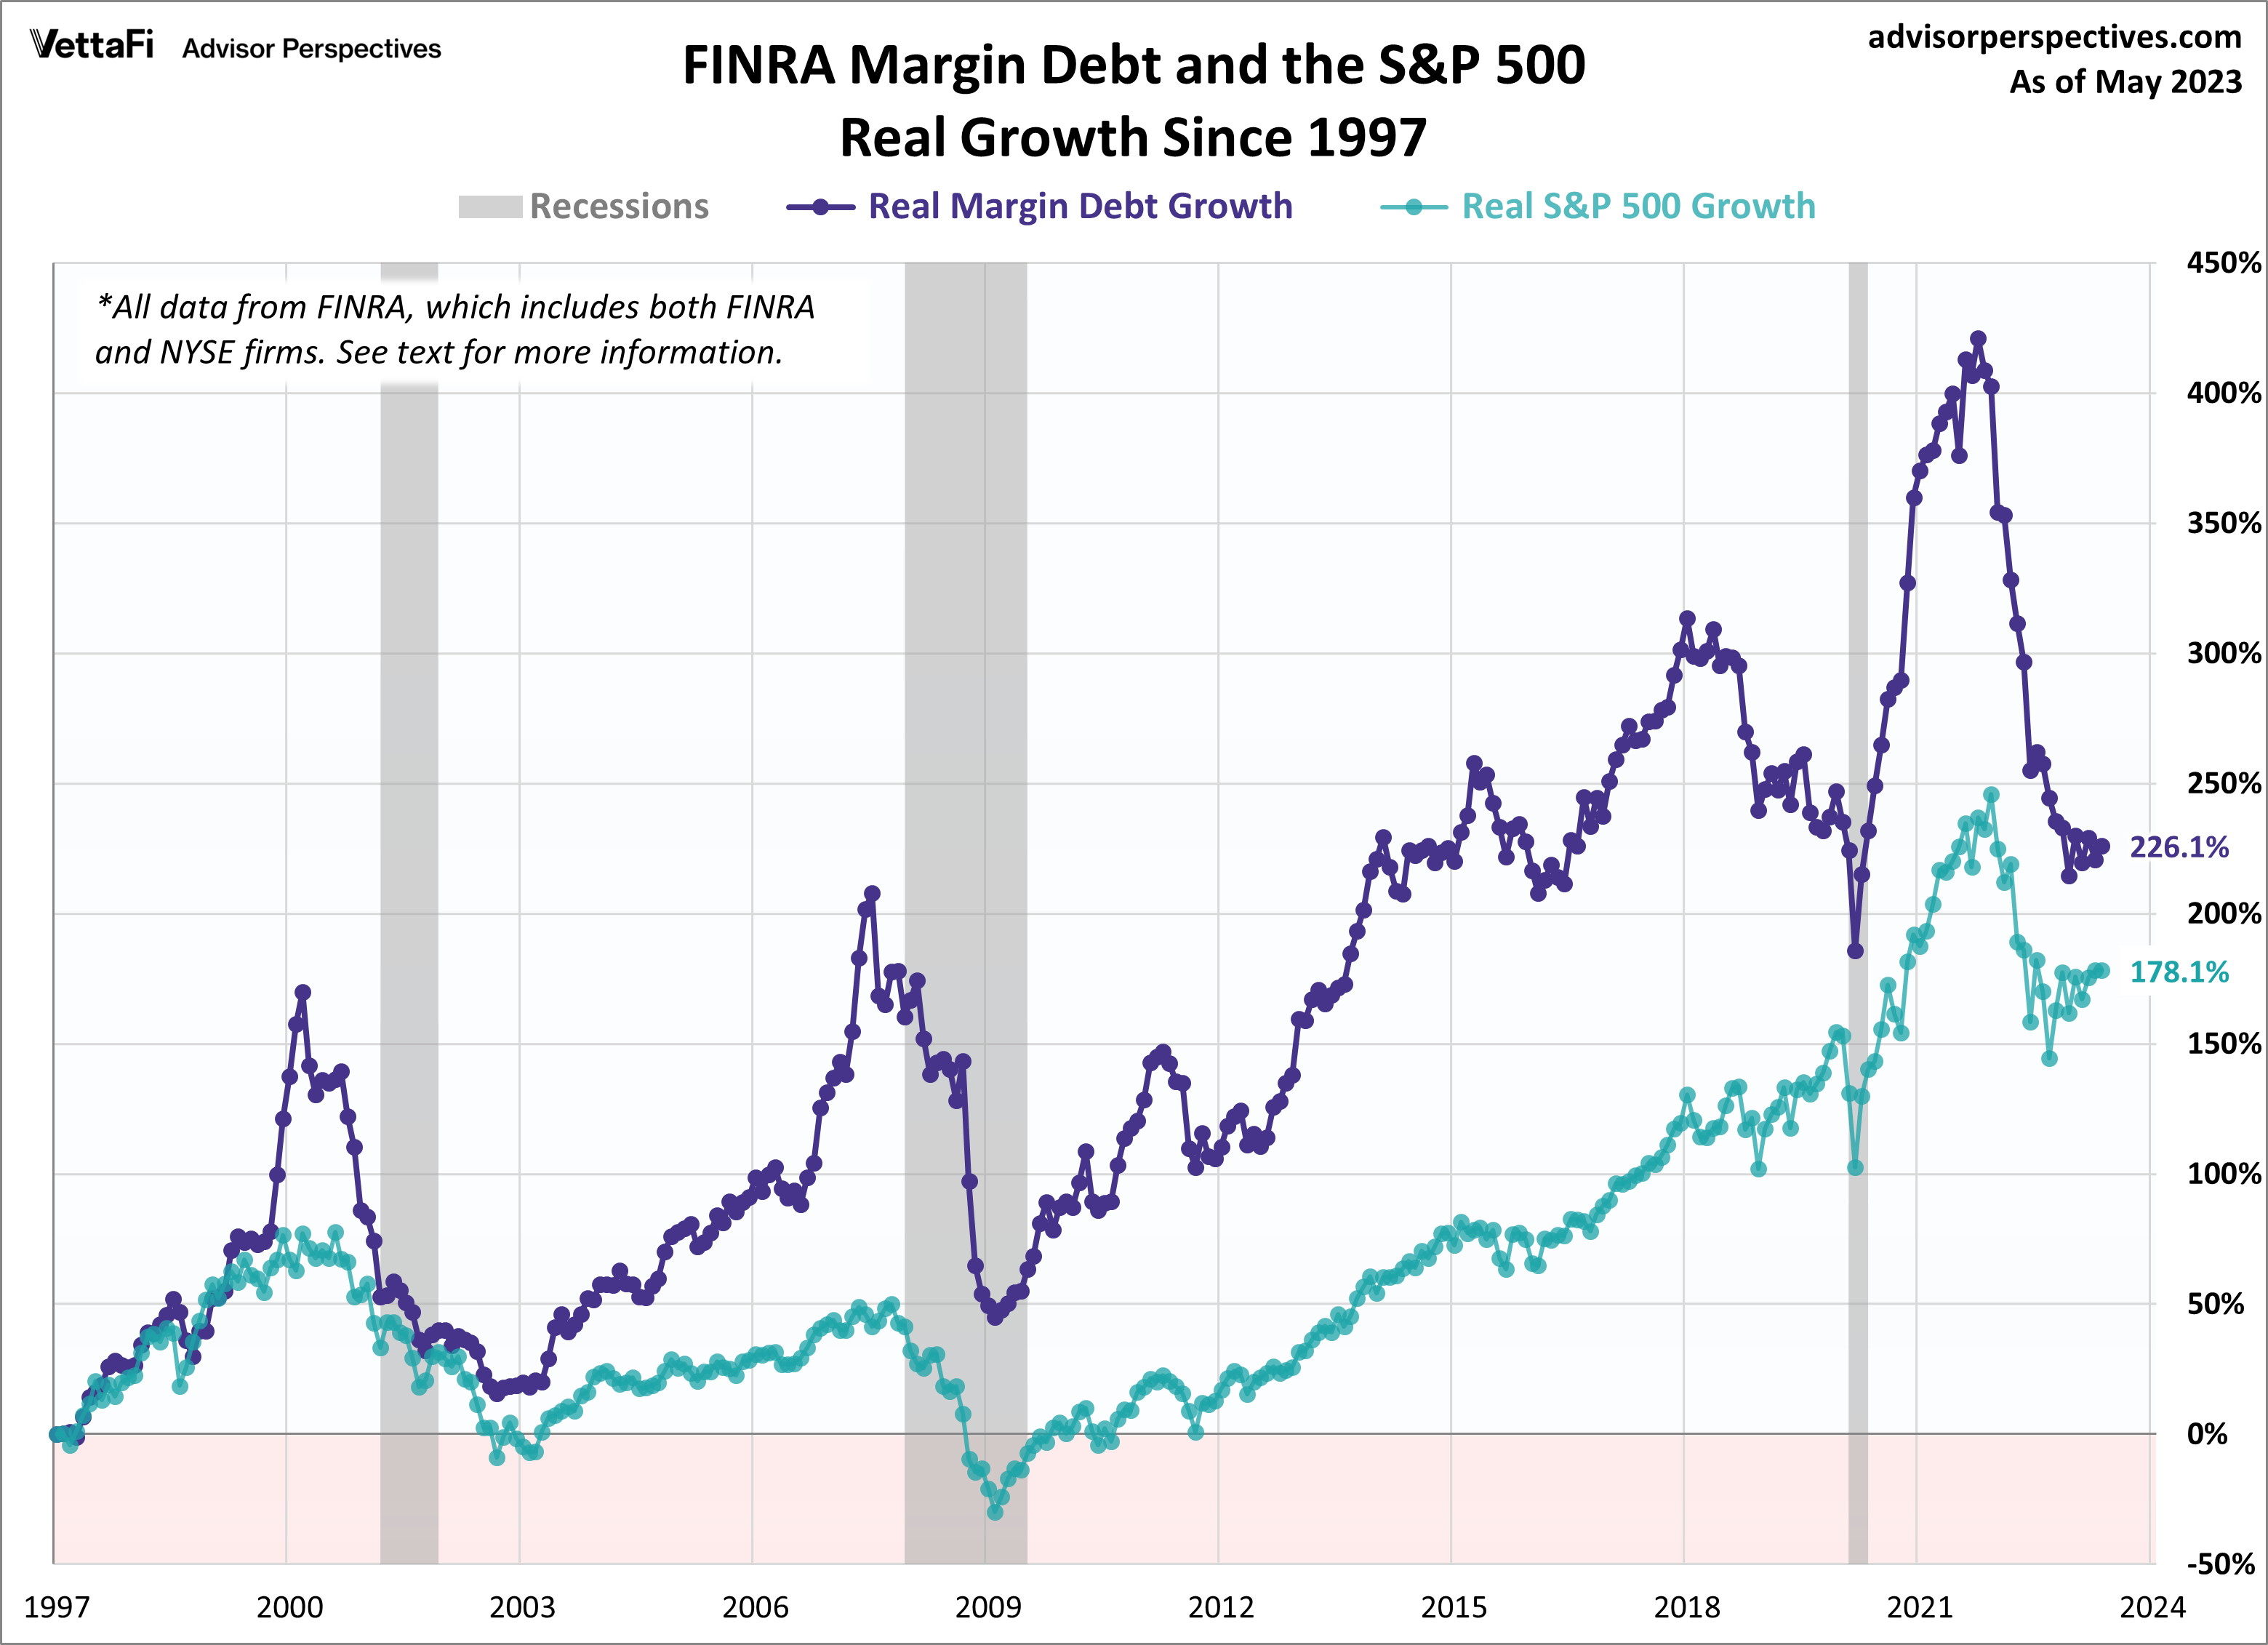
The next chart shows the percentage growth of the two data series from the same 1997 starting date, again based on real (inflation-adjusted) data. I've added markers to show the precise monthly values. Margin debt grew at a rate comparable to the market from 1997 to late summer of 2000 before soaring into the stratosphere. The two synchronized in their rate of contraction in early 2001. But with recovery after the tech crash, margin debt gradually returned to a growth rate closer to its former self in the second half of the 1990s rather than the more restrained real growth of the S&P 500. But by September of 2006, margin debt again went ballistic. It finally peaked in the summer of 2007, about three months before the market. Debt continues to peak as does the market soon after. Most recent evidence of this was in 2021 when the margin debt peaked in October and the market followed two months later by peaking in December.
NYSE Investor Credit
Lance Roberts of Real Investment Advice analyzes margin debt in the larger context that includes free cash accounts and credit balances in margin accounts. Essentially, he calculates the credit balance as the sum of free credit cash accounts and credit balances in margin accounts minus margin debt. The chart below illustrates the mathematics of Credit Balance with an overlay of the S&P 500. Note that the chart below is based on nominal data, not adjusted for inflation. Here, we have retained the NYSE data through November 2017 and switched to the FINRA data. (see note at end of article)
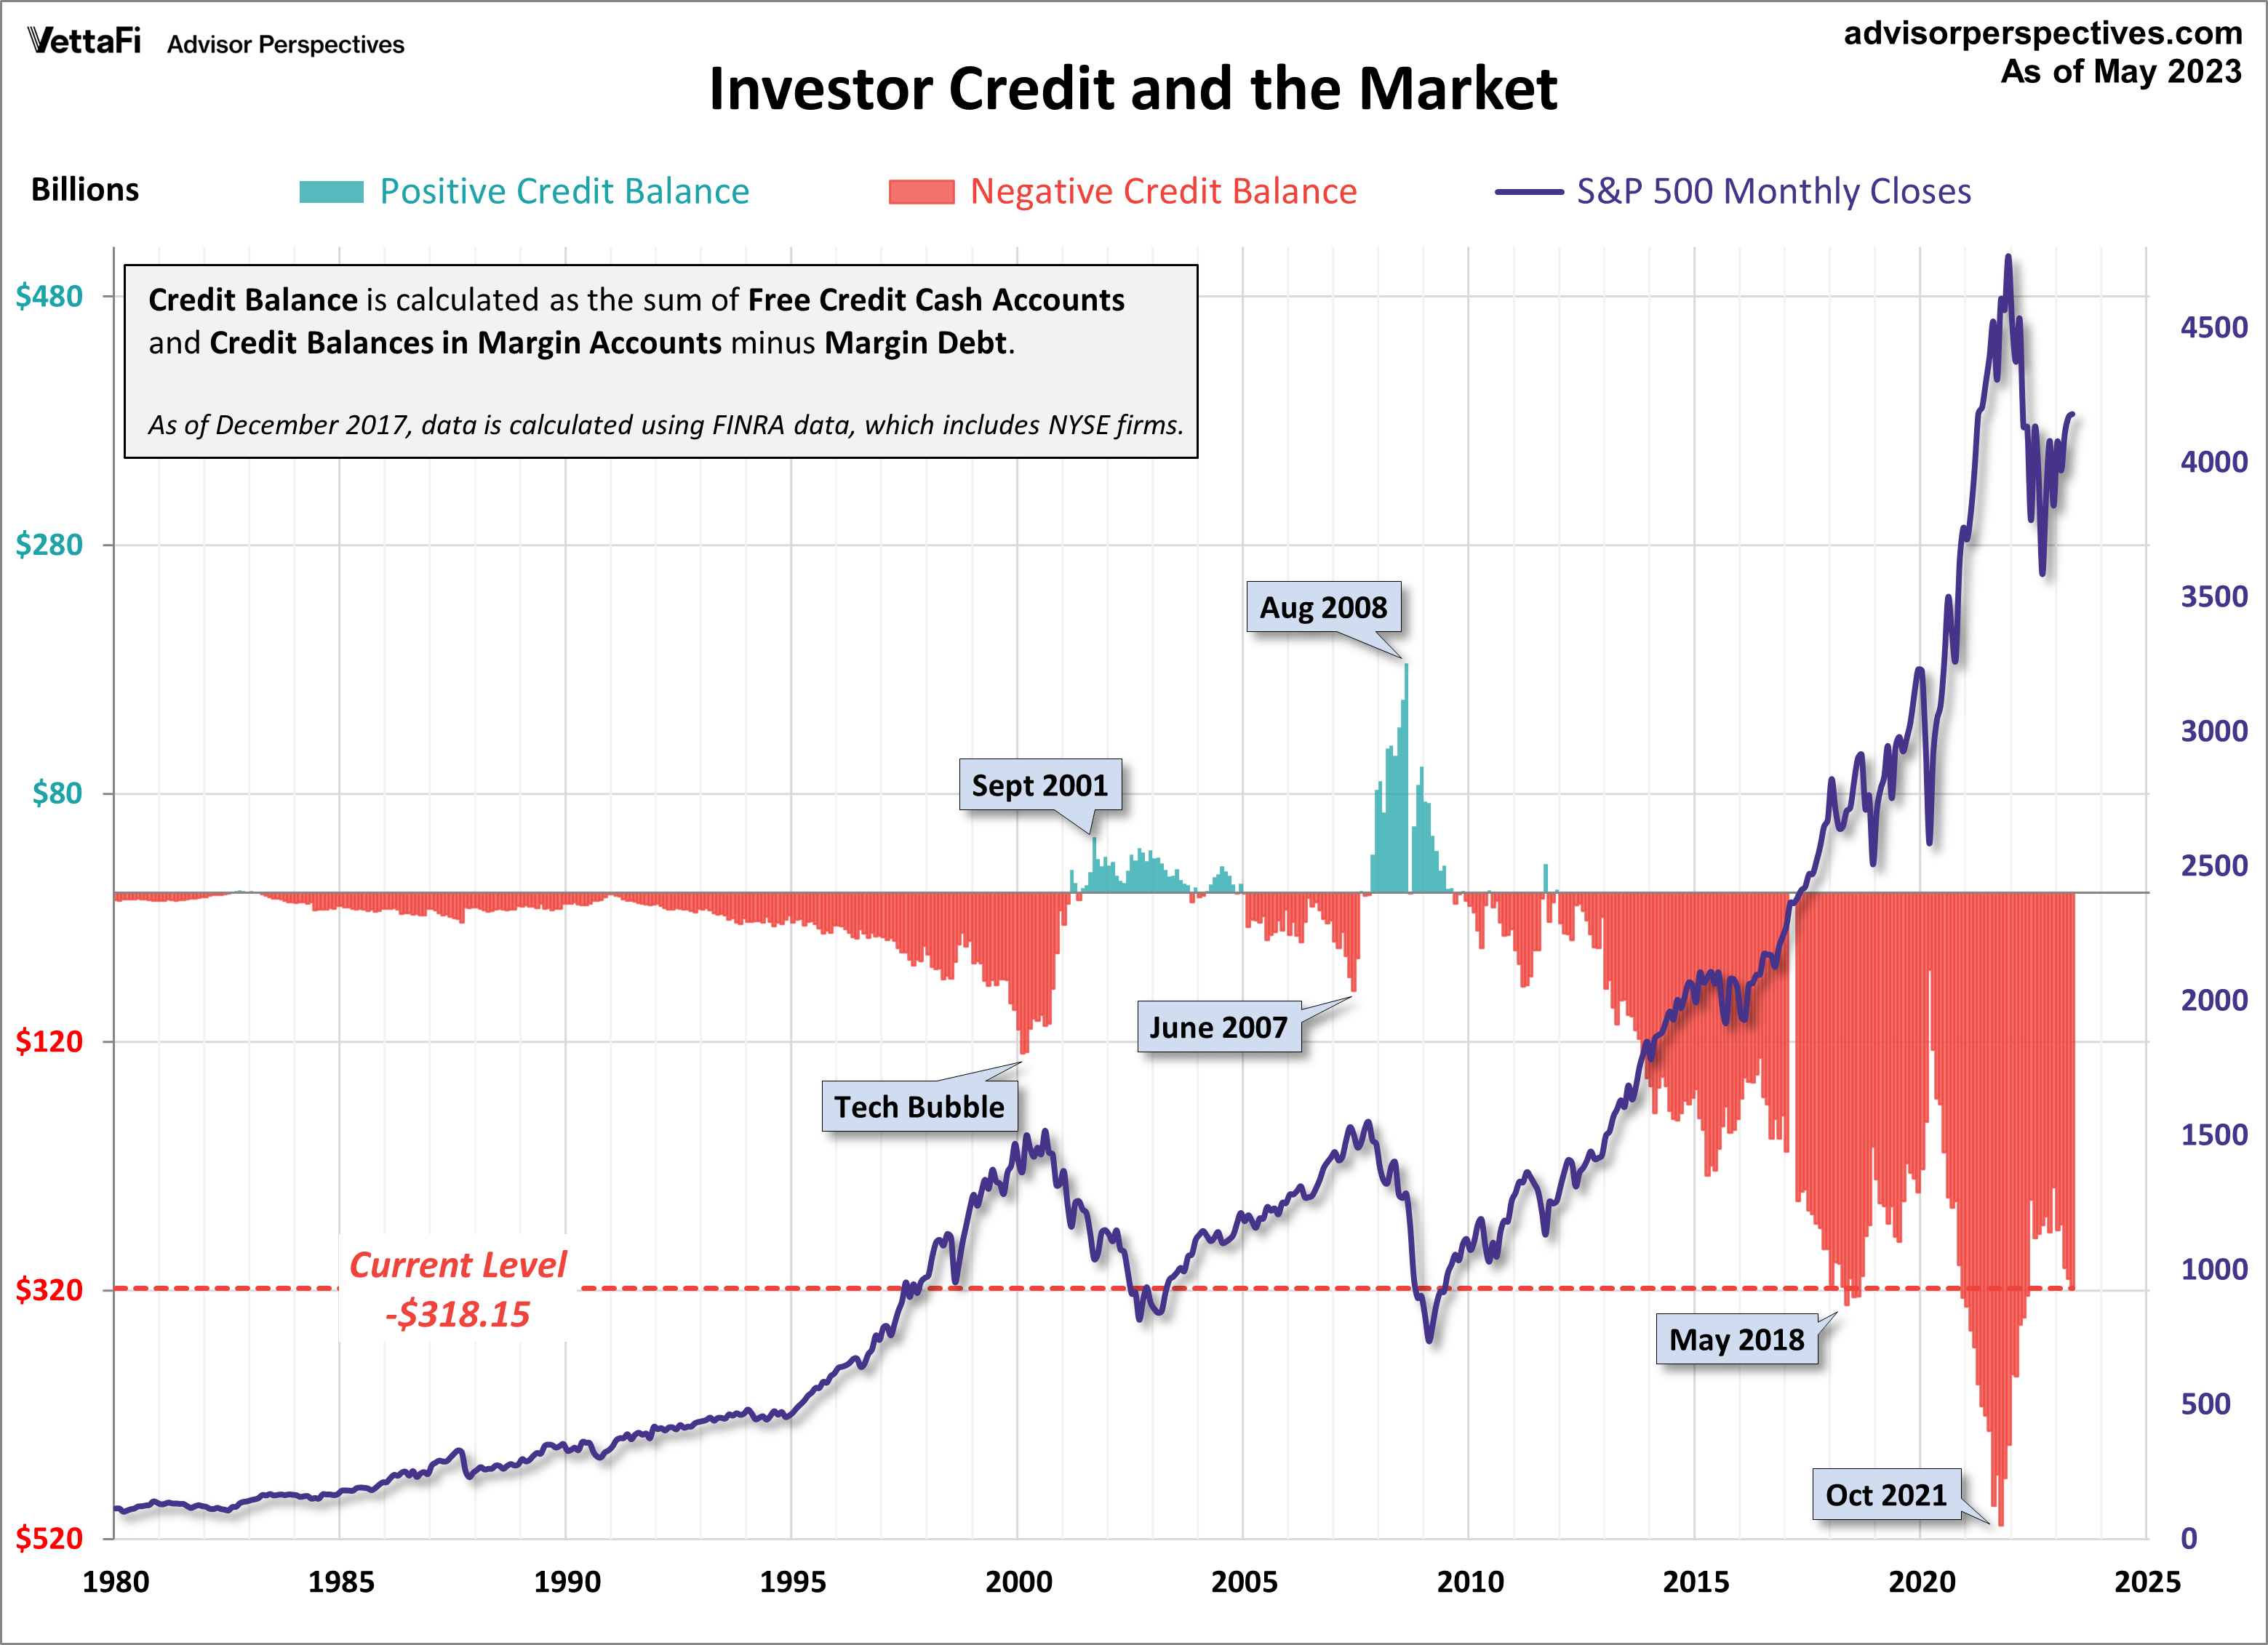
Here's a slightly closer look at the data, starting with 1997. Also, I've inverted the investor credit monthly data and used markers to pinpoint key turning points.
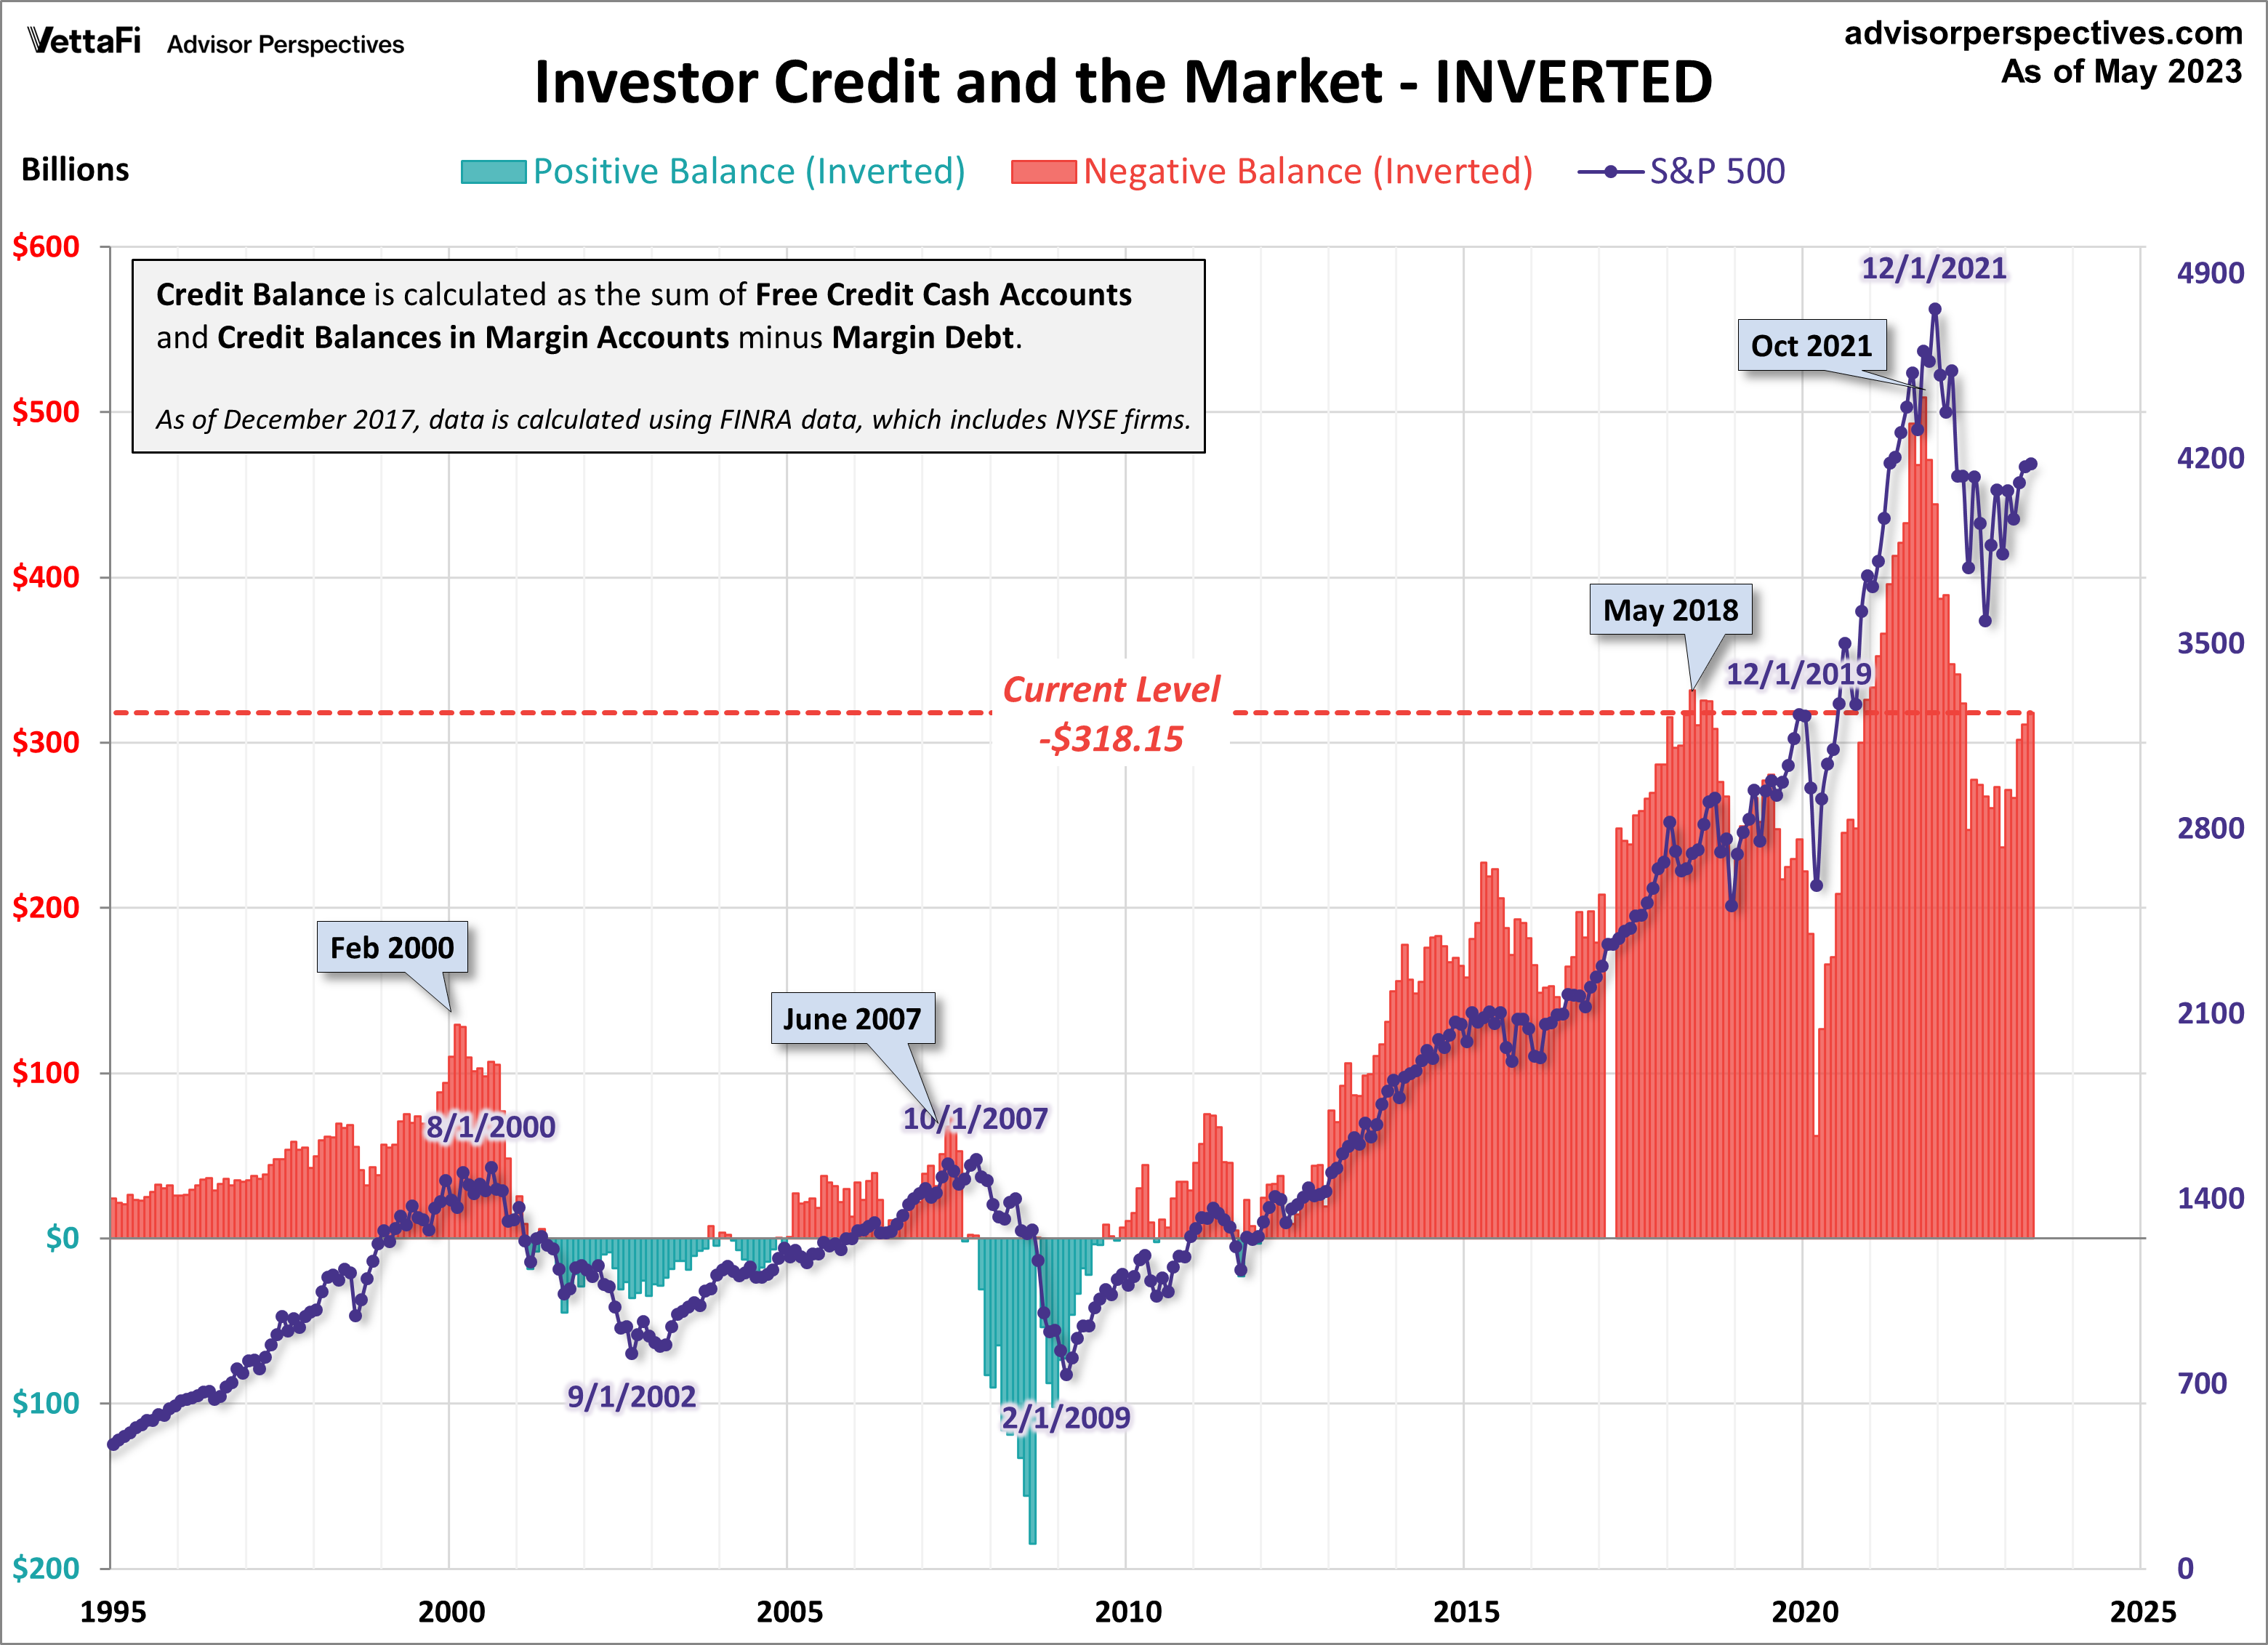
As I pointed out above, margin debt data is several weeks old when it is published. Thus, even though it may, in theory, be a leading indicator, a major shift in margin debt isn't immediately evident. Nevertheless, we see that the troughs in the monthly net credit balance preceded peaks in the monthly S&P 500 closes by six months in 2000 and four months in 2007.
We are past the longest bull market in history. The peak in margin debt preceded the peak in the monthly S&P closes (the December 2019 peak) by 23 months, much longer than the previous shifts prior to corrections. Interestingly, the most recent peak (Dec 2021) was not preceded by a trough, unless we use the February 2009 point as a reference!
Margin Debt: Conclusions
There are too few peak-trough episodes in this overlay series to take the latest credit balance data as a leading indicator of a major selloff in U.S. equities. This has been an interesting indicator to watch and will certainly continue to bear close watching in the future.
Read Full Story »»»
 DiscoverGold
By: Jennifer Nash | June 20, 2023
Margin debt is the amount of money an investor borrows from their broker via a margin account. Trading with a margin debt can magnify gains because an investor can benefit from the upside of any stock without having to invest 100%, resulting in greater profit. With that being said, trading with margin debt can also exacerbate losses because if a stock's value were to depreciate, the investor may face a margin call and would need to come up with additional cash to reach the minimum requirement.
The Latest Margin Data
FINRA has released new data for margin debt, now available through May. The latest debt level is at 644.17 billion, up 1.9% month-over-month (MoM) and down 14.5% year-over-year (YoY). However, after adjusting for inflation, debt level is up 1.7% MoM and down 17.8% YoY. Let's examine the numbers and study the relationship between margin debt and the market, using the S&P 500 as the surrogate for the latter.
The first chart shows the two series in real terms — adjusted for inflation to today's dollar using the consumer price index (CPI) as the deflator. At the 1997 start date, we were well into the boomer bull market that began in 1982 and approaching the start of the tech bubble that shaped investor sentiment during the second half of the decade. The astonishing surge in leverage in late 1999 peaked in March 2000, the same month that the S&P 500 hit an interim daily high, although the highest monthly close for that year was five months later in August. A similar surge began in 2006, peaking in July 2007, three months before the market peak. Debt hit a trough in February 2009, the same month the market hit a bottom. It then began another major cycle of increases. Most recently, we saw a similar surge after the COVID-pandemic, peaking in October 2021, two months before the market's all-time high.
Note on the data: The FINRA only posts the free credit cash accounts data back to 1997. The free credit cash accounts data back to 1980 is available on a fee basis from Haver Analytics.

At the suggestion of Mark Schofield, managing director at Strategic Value Capital Management, LLC, I've created the same chart with margin debt inverted so that we see the relationship between the two as a divergence.

The next chart shows the percentage growth of the two data series from the same 1997 starting date, again based on real (inflation-adjusted) data. I've added markers to show the precise monthly values. Margin debt grew at a rate comparable to the market from 1997 to late summer of 2000 before soaring into the stratosphere. The two synchronized in their rate of contraction in early 2001. But with recovery after the tech crash, margin debt gradually returned to a growth rate closer to its former self in the second half of the 1990s rather than the more restrained real growth of the S&P 500. But by September of 2006, margin debt again went ballistic. It finally peaked in the summer of 2007, about three months before the market. Debt continues to peak as does the market soon after. Most recent evidence of this was in 2021 when the margin debt peaked in October and the market followed two months later by peaking in December.

NYSE Investor Credit
Lance Roberts of Real Investment Advice analyzes margin debt in the larger context that includes free cash accounts and credit balances in margin accounts. Essentially, he calculates the credit balance as the sum of free credit cash accounts and credit balances in margin accounts minus margin debt. The chart below illustrates the mathematics of Credit Balance with an overlay of the S&P 500. Note that the chart below is based on nominal data, not adjusted for inflation. Here, we have retained the NYSE data through November 2017 and switched to the FINRA data. (see note at end of article)

Here's a slightly closer look at the data, starting with 1997. Also, I've inverted the investor credit monthly data and used markers to pinpoint key turning points.

As I pointed out above, margin debt data is several weeks old when it is published. Thus, even though it may, in theory, be a leading indicator, a major shift in margin debt isn't immediately evident. Nevertheless, we see that the troughs in the monthly net credit balance preceded peaks in the monthly S&P 500 closes by six months in 2000 and four months in 2007.
We are past the longest bull market in history. The peak in margin debt preceded the peak in the monthly S&P closes (the December 2019 peak) by 23 months, much longer than the previous shifts prior to corrections. Interestingly, the most recent peak (Dec 2021) was not preceded by a trough, unless we use the February 2009 point as a reference!
Margin Debt: Conclusions
There are too few peak-trough episodes in this overlay series to take the latest credit balance data as a leading indicator of a major selloff in U.S. equities. This has been an interesting indicator to watch and will certainly continue to bear close watching in the future.
Read Full Story »»»
 DiscoverGold
Information posted to this board is not meant to suggest any specific action, but to point out the technical signs that can help our readers make their own specific decisions. Caveat emptor!
• DiscoverGold
Join the InvestorsHub Community
Register for free to join our community of investors and share your ideas. You will also get access to streaming quotes, interactive charts, trades, portfolio, live options flow and more tools.

