


| Followers | 679 |
| Posts | 140956 |
| Boards Moderated | 36 |
| Alias Born | 03/10/2004 |
Sunday, July 02, 2023 5:35:36 PM
NYAD Recovers and Gathers Upside Momentum
By: Joe Duarte | July 2, 2023
Three weeks before the Fed's next meeting, investors who have missed the AI/tech rally have thrown caution to the wind.
That urgency to catch up has led to an encouraging improvement in the market's breadth and a marginal new high in the S&P 500 index (SPX). The combination is likely setting the market up for what could be an impressive upward thrust. See below for full details.
And if June is any sign of what July may be, the bulls will be ruling the roost. Here are some grounding facts:
• The S&P 500 index (SPX) has returned an average of 3.3% in the month of July from 2012-2022.
• SPX rallied 9% in July 2022.
Of course, there are no guarantees that history will repeat. But it pays to be always ready. So, which sectors are likely to benefit? I have some thoughts just below.
Bond Yields Survive Yield Scare
I would not be surprised if the Fed joined the other global central banks that have raised interest rates in the last few weeks. However, from a trading standpoint, the action in bonds is more important, as bond yields have largely disagreed with the Fed's perception of the economy since late in 2022.
What I mean, of course, is that even as the Fed raised interest rates after October 2022, bond yields have fallen since then, setting up a divergence.
Certainly, there has been some volatility in yields. For example, the U.S. Treasury's Ten Year Note yield (TNX) bounced higher on 6/29/23, as a surprising upward revision of U.S. GDP to the 2% growth rate raised the odds of a rate hike at the upcoming FMOC meeting in mid-July. Yet, the flattening out of the Fed's favorite indicator, the PCE inflation gauge on 6/20/23, calmed things down.
That leaves the resistance band between 3.6-3.85% as the area to monitor. If TNX rises above 3.85%, we may see a move toward 4%, which would be very negative for stocks; especially the interest rate-sensitive homebuilders and real estate investment trusts (REITS).
The Fine Print in Housing Stats: Supply, Supply, Supply
As would be expected, as TNX flirted with 3.85%, there was a pullback in the homebuilder stocks. But as we've learned over the recent past, the correlation between the direction of bond yields and the action in the homebuilder stocks is nearly 100%. As a result, when bond yields, as I described above, hit resistance at 3.85% and turned lower, the homebuilder stocks regained their upward trend.
Overall, the housing sector continues to deliver mixed news. For example:
• New home sales recently rose - bullish for homebuilders.
• Existing home sales are flattening out – neutral for brokers.
• Pending home sales fell – not what you may be thinking.
The quiet part is all three stats above have two things in common – low supply and steady-to-rising demand. So new home sales are rising because builders are building enough of them to sell to enough people who are looking for housing. Existing home sales are flat because no one wants to sell a house with a 3% mortgage and buy a new one with a 6% mortgage. And, of course, if no one wants to sell their house, then you get a fall in pending home sales.
The bottom line remains unchanged. Low supply of steady demand favors the homebuilders.
Overall pending home sales fell 2.7% month to month. And if you're wondering how each U.S. region fared in the pending home sales data here you go:
• The Northeast delivered a 12.9% increase.
• The South registered a 4.4% decrease.
• The Midwest dropped by 5.3%.
• The West's sales dropped by 6.1% (a 62% decrease since 2001).
Moreover, the National Association of Realtors noted that there are still three pending offers per sale.

Mortgage rates ticked up last week along with bond yields. Homebuilder stocks pulled back slightly before recovering. Several homebuilders will be reporting earnings in July, near the date of the Fed's next meeting.
For an in-depth look at the news and trends in the housing and real estate market, check out my new publication, Joe Duarte's Real Estate Weekly, here. You'll find crucial and detailed real estate market updates in an easy to follow and highly accessible format. This crucial information complements the stock picks at Joe Duarte in the Money Options.com. For more details on how to trade the bullish housing megatrend, check out my latest video here.
Oil Service Makes its Move
The bullish action in stocks on June 30 might be at least partially related to window dressing. That's where portfolio managers who missed the rally play catch up in order to show their clients that they own stocks in groups which are rising. What that means is that the bullish action may or may not remain in some of the more extended sectors of the market, such as AI.
On the other hand, some portfolio managers use the cover of window dressing as a stealthy way to put money to work in sectors which offer value. As a result, while everyone is looking at the hot sectors, such as AI, it pays to look at sectors which have underperformed in the first half.
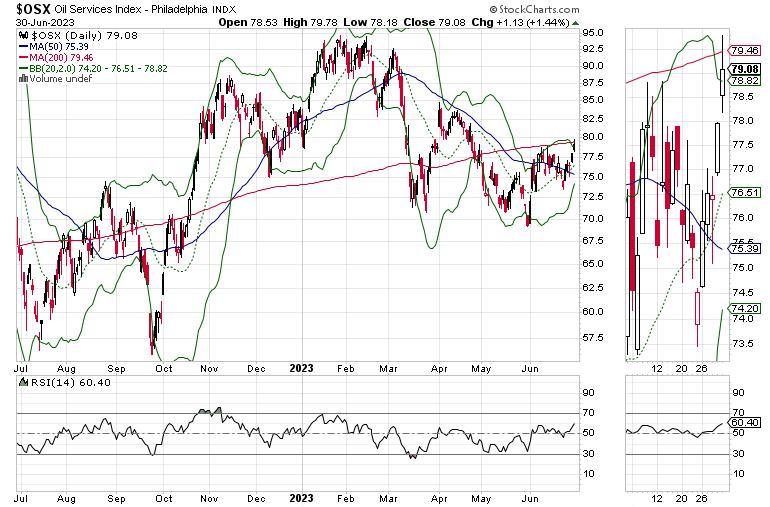
One of them is oil service. As the price chart illustrates, the Philadelphia Oil Service Index (OSX) is showing some bullish characteristics. Note the broaching of the 200-day moving average after the recent double bottom it carved out over the last three months.
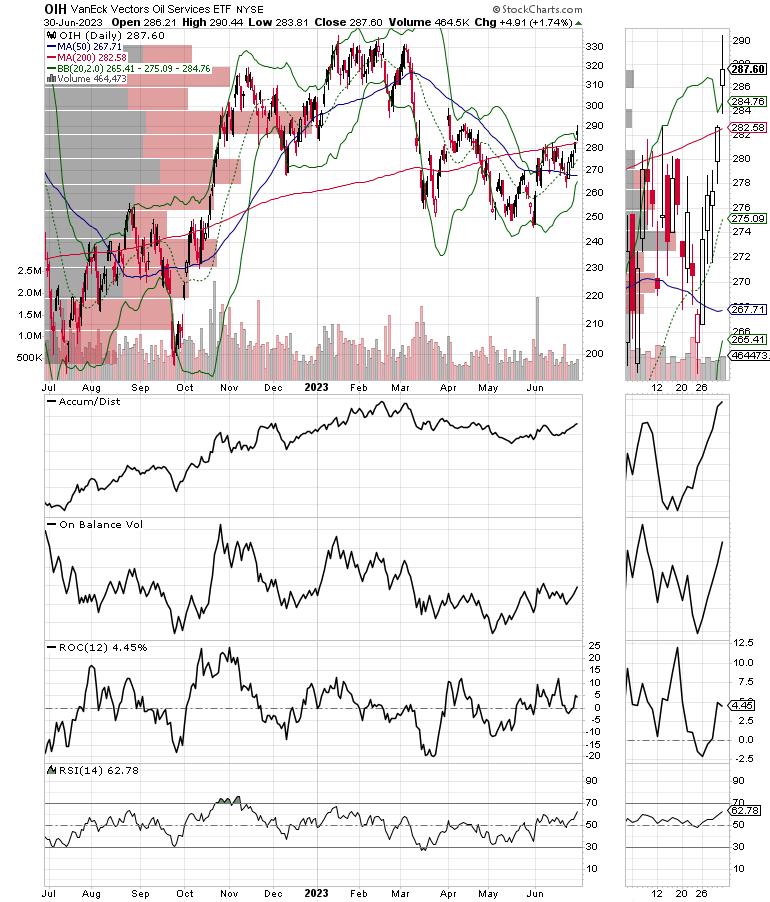
Moreover, its accompanying ETF, the Van Eck Vectors Oil Service ETF (OIH), is looking even better. You can see that in the fact that OIH has crossed above its 200-day moving average, marking what looks to be the start of a bullish reversal.
In addition, you can see that the Accumulation/Distribution indicator (ADI) has begun to move higher as the On Balance Volume (OBV) indicator has bottomed out. Together, these two indicators confirm the emerging price trend in OIH as money moves in.
I have several oil service stocks in my Joe Duarte in the Money Options portfolios which are worth considering. One of them just broke out to a new high. You can check it out with a FREE trial to my service here.
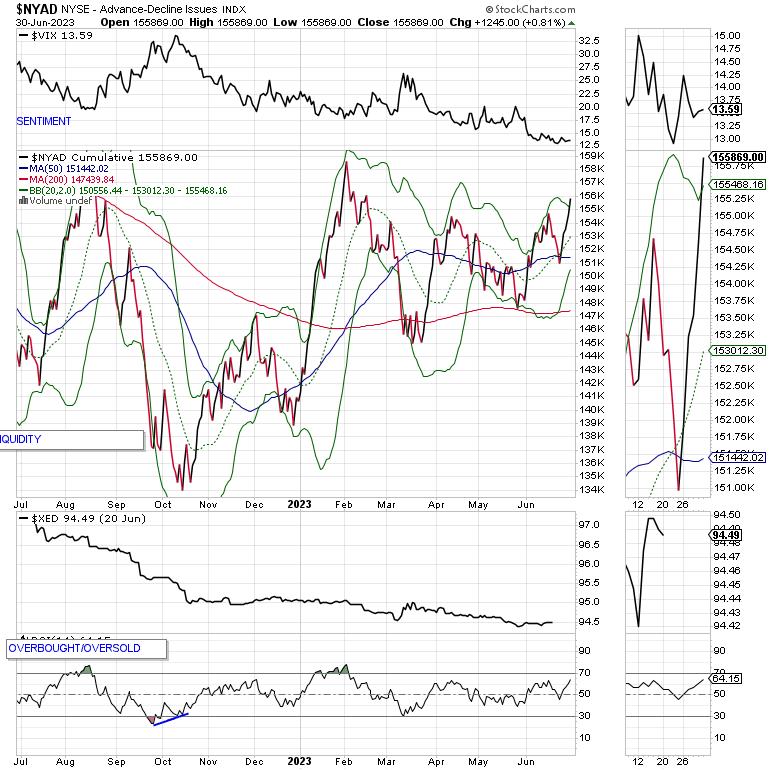
NYAD Recovers and Gathers Upside Momentum
In a bullish development, the New York Stock Exchange Advance Decline line (NYAD) turned on a dime last week and moved decidedly higher, breaking above short-term resistance. This comes after a short lived dip below the 50-day moving average.
The Nasdaq 100 Index (NDX) also turned around, finding support at its the 20-day moving average. ADI and OBV have turned short-term negative.
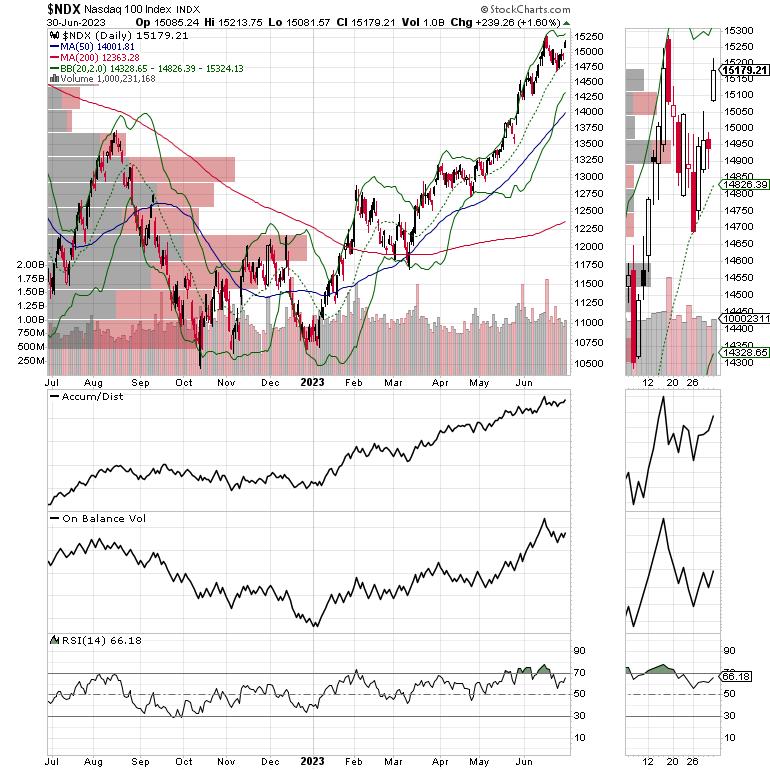
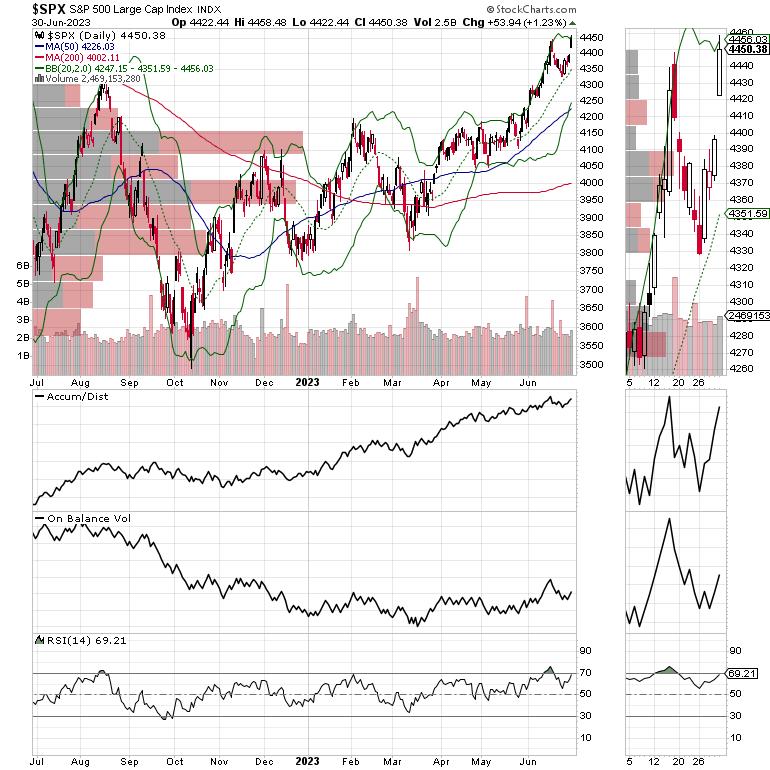
The S&P 500 (SPX) made a new high since the October bottom in stocks. As with NDX, SPX found support at its 20-day moving average. This is a bullish development. Both ADI and OBV stabilized.
VIX Is Likely to Bounce
After its recent new lows, the CBOE Volatility Index (VIX) is poised to rise, as July often marks a bottom. On the other hand, VIX is at such a low level that it could take a while before the negative effects of a rising VIX affect the bullish action in stocks.
When the VIX rises, stocks tend to fall, as rising put volume is a sign that market makers are selling stock index futures to hedge their put sales to the public. A fall in VIX is bullish, as it means less put option buying, and it eventually leads to call buying, which causes market makers to hedge by buying stock index futures. This raises the odds of higher stock prices.
Liquidity Remains Stable
The Eurodollar Index (XED) remains rangebound, which is relatively bullish. A move below 94 would be very bearish.
A move above 95 will be a very bullish development. Usually, a stable or rising XED is very bullish for stocks.
Read Full Story »»»
 DiscoverGold
By: Joe Duarte | July 2, 2023
Three weeks before the Fed's next meeting, investors who have missed the AI/tech rally have thrown caution to the wind.
That urgency to catch up has led to an encouraging improvement in the market's breadth and a marginal new high in the S&P 500 index (SPX). The combination is likely setting the market up for what could be an impressive upward thrust. See below for full details.
And if June is any sign of what July may be, the bulls will be ruling the roost. Here are some grounding facts:
• The S&P 500 index (SPX) has returned an average of 3.3% in the month of July from 2012-2022.
• SPX rallied 9% in July 2022.
Of course, there are no guarantees that history will repeat. But it pays to be always ready. So, which sectors are likely to benefit? I have some thoughts just below.
Bond Yields Survive Yield Scare
I would not be surprised if the Fed joined the other global central banks that have raised interest rates in the last few weeks. However, from a trading standpoint, the action in bonds is more important, as bond yields have largely disagreed with the Fed's perception of the economy since late in 2022.
What I mean, of course, is that even as the Fed raised interest rates after October 2022, bond yields have fallen since then, setting up a divergence.
Certainly, there has been some volatility in yields. For example, the U.S. Treasury's Ten Year Note yield (TNX) bounced higher on 6/29/23, as a surprising upward revision of U.S. GDP to the 2% growth rate raised the odds of a rate hike at the upcoming FMOC meeting in mid-July. Yet, the flattening out of the Fed's favorite indicator, the PCE inflation gauge on 6/20/23, calmed things down.
That leaves the resistance band between 3.6-3.85% as the area to monitor. If TNX rises above 3.85%, we may see a move toward 4%, which would be very negative for stocks; especially the interest rate-sensitive homebuilders and real estate investment trusts (REITS).
The Fine Print in Housing Stats: Supply, Supply, Supply
As would be expected, as TNX flirted with 3.85%, there was a pullback in the homebuilder stocks. But as we've learned over the recent past, the correlation between the direction of bond yields and the action in the homebuilder stocks is nearly 100%. As a result, when bond yields, as I described above, hit resistance at 3.85% and turned lower, the homebuilder stocks regained their upward trend.
Overall, the housing sector continues to deliver mixed news. For example:
• New home sales recently rose - bullish for homebuilders.
• Existing home sales are flattening out – neutral for brokers.
• Pending home sales fell – not what you may be thinking.
The quiet part is all three stats above have two things in common – low supply and steady-to-rising demand. So new home sales are rising because builders are building enough of them to sell to enough people who are looking for housing. Existing home sales are flat because no one wants to sell a house with a 3% mortgage and buy a new one with a 6% mortgage. And, of course, if no one wants to sell their house, then you get a fall in pending home sales.
The bottom line remains unchanged. Low supply of steady demand favors the homebuilders.
Overall pending home sales fell 2.7% month to month. And if you're wondering how each U.S. region fared in the pending home sales data here you go:
• The Northeast delivered a 12.9% increase.
• The South registered a 4.4% decrease.
• The Midwest dropped by 5.3%.
• The West's sales dropped by 6.1% (a 62% decrease since 2001).
Moreover, the National Association of Realtors noted that there are still three pending offers per sale.

Mortgage rates ticked up last week along with bond yields. Homebuilder stocks pulled back slightly before recovering. Several homebuilders will be reporting earnings in July, near the date of the Fed's next meeting.
For an in-depth look at the news and trends in the housing and real estate market, check out my new publication, Joe Duarte's Real Estate Weekly, here. You'll find crucial and detailed real estate market updates in an easy to follow and highly accessible format. This crucial information complements the stock picks at Joe Duarte in the Money Options.com. For more details on how to trade the bullish housing megatrend, check out my latest video here.
Oil Service Makes its Move
The bullish action in stocks on June 30 might be at least partially related to window dressing. That's where portfolio managers who missed the rally play catch up in order to show their clients that they own stocks in groups which are rising. What that means is that the bullish action may or may not remain in some of the more extended sectors of the market, such as AI.
On the other hand, some portfolio managers use the cover of window dressing as a stealthy way to put money to work in sectors which offer value. As a result, while everyone is looking at the hot sectors, such as AI, it pays to look at sectors which have underperformed in the first half.

One of them is oil service. As the price chart illustrates, the Philadelphia Oil Service Index (OSX) is showing some bullish characteristics. Note the broaching of the 200-day moving average after the recent double bottom it carved out over the last three months.

Moreover, its accompanying ETF, the Van Eck Vectors Oil Service ETF (OIH), is looking even better. You can see that in the fact that OIH has crossed above its 200-day moving average, marking what looks to be the start of a bullish reversal.
In addition, you can see that the Accumulation/Distribution indicator (ADI) has begun to move higher as the On Balance Volume (OBV) indicator has bottomed out. Together, these two indicators confirm the emerging price trend in OIH as money moves in.
I have several oil service stocks in my Joe Duarte in the Money Options portfolios which are worth considering. One of them just broke out to a new high. You can check it out with a FREE trial to my service here.
NYAD Recovers and Gathers Upside Momentum
In a bullish development, the New York Stock Exchange Advance Decline line (NYAD) turned on a dime last week and moved decidedly higher, breaking above short-term resistance. This comes after a short lived dip below the 50-day moving average.

The Nasdaq 100 Index (NDX) also turned around, finding support at its the 20-day moving average. ADI and OBV have turned short-term negative.

The S&P 500 (SPX) made a new high since the October bottom in stocks. As with NDX, SPX found support at its 20-day moving average. This is a bullish development. Both ADI and OBV stabilized.

VIX Is Likely to Bounce
After its recent new lows, the CBOE Volatility Index (VIX) is poised to rise, as July often marks a bottom. On the other hand, VIX is at such a low level that it could take a while before the negative effects of a rising VIX affect the bullish action in stocks.
When the VIX rises, stocks tend to fall, as rising put volume is a sign that market makers are selling stock index futures to hedge their put sales to the public. A fall in VIX is bullish, as it means less put option buying, and it eventually leads to call buying, which causes market makers to hedge by buying stock index futures. This raises the odds of higher stock prices.
Liquidity Remains Stable
The Eurodollar Index (XED) remains rangebound, which is relatively bullish. A move below 94 would be very bearish.
A move above 95 will be a very bullish development. Usually, a stable or rising XED is very bullish for stocks.
Read Full Story »»»
 DiscoverGold
Information posted to this board is not meant to suggest any specific action, but to point out the technical signs that can help our readers make their own specific decisions. Caveat emptor!
• DiscoverGold
Join the InvestorsHub Community
Register for free to join our community of investors and share your ideas. You will also get access to streaming quotes, interactive charts, trades, portfolio, live options flow and more tools.

