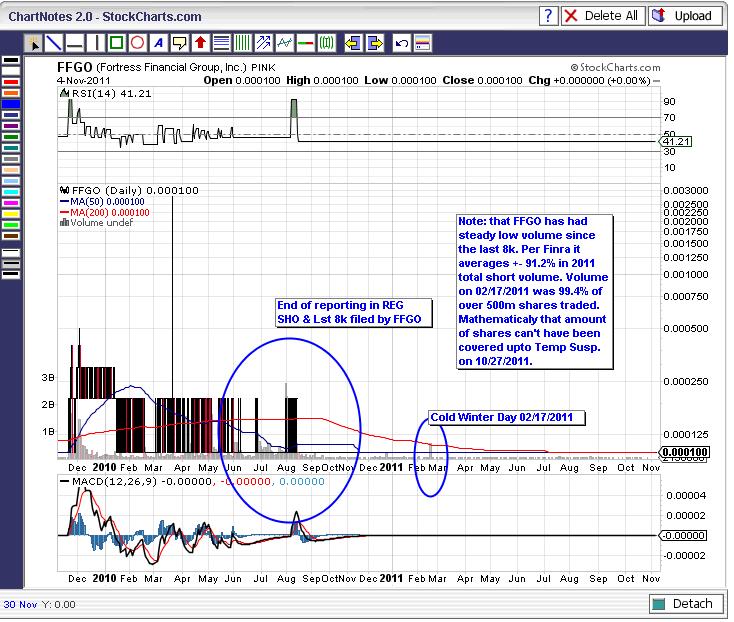
Thanks for the update. Do you have screen shots of that period to which you refer? Those are the ones of interest because what you posted was SOP for any shorted stock. If not, what proof had you given all those entities to whom you talked?
Ah!!, the math that doesn't work.. That cold winter day 02/17/2011.. Interesting that the OTC Markets (Reg Sho Bi-Monthly report) quit reporting FFGO short position when the last FFGO 8k was filed. FINRA kept it up until it was revoked. There is no way in or on our green earth that with two years of short volume per FINRA being 90%+ each and every day could equate to that the short position was ever covered! EVER! The short position is stuck! FFGO doesn't matter when it comes to NMGL and the Class As & Bs.. True story.. $.003449 just gets paid!
VERY BASIC DATA SHOWS WHAT IS GOING ON IN FFGO!! MY Simple DD suggests there is real big problem with FFGO and short positions! 3400% if not more is a to lot loose for short postions to have to cover, 100% would be bad enough for longs to loose.
I can safely say after looking over the below data and the last few days and weeks of postings. I am a winner in FFGO, payday will come in some form of Cash!Lolzzzz "-)
www.fortfinancegroup.com/faq.html
In the above link just do a control f key and type in cash. It comes up 18 times by the company. If the company says the stock will go to the gray sheets only once (1 time) and we are adamantly told to believe what the company says it will do, then everyone suggesting that should believe it, when the company says cash 18 TIMES!!!?
I believe many are missing a very simple point, hopefully not on purpose. The REG SHO BI-MONTHLY Reports quit reporting on 08/13/2010..
That is a fact.. The stock still traded up to this recent suspension on 10/27/2011 http://sec.gov/litigation/admin/2011/34-65640.pdf , all the while FINRA was busy tallying the Daily Short Volumes that are 91.2% of the total agregate for 2011 and the upper 79% for 2010 since FINRA first started reporting them.
I have reported the numbers many times and I am going to re-post them below because the data does not reconcile between Finra and Reg Sho. Don't be bashful folks please read on!
But first, please remember everyone that the last FFGO 8k was filed on 08/12/2010 per the OTC. Are we not just a little bit suspicious about that date and that the REG SHO BI-Montly Report posted one last time on 08/13/2010 and then quit since?
We all hope that the OTC didn't report the data up until April 2011 and then for some odd reason removed that data from the OTC website and then even, for there to be no postings here that many are looking for can't find refuting that data which was posted on and thereafter that cold winter day of 02/17/2011 is to be found, yet. I presume since before that cold winter day there were many days where it was refuted that FINRA was wrong in their Daily Reports by stating that REG SHO was not reporting any Short Interest data to support FINRA numbers. That argument is moot now!!!
Well that argument is debunked, as there is no data post 08/13/2010 on OTC website for REG SHO BI-MONTHLY Reproting. So since 02/17/2011 there is no mathematical way that all the shares from that cold winter day up to the temporary suspension could have been covered shares.. 91.2% for that year is some pretty hard evidence, imo!
It is not a far fetched Idea, as we know in the news that there has been some problems with both the SEC and FINRA. Things like back dating filings, changing signatures, hiding that there were failures to report short positions, etc..Credibility kinda goes out the door don't you think. I sure do.
So in the mean time, I'll believe my hard DD and I will presume that most here will agree too, it is very compelling data and should be taken seriously!
RM
8-K Aug 12, 2010 Aug 12, 2010 133.6 KB PDF RTF HTML XLS
But first just below is the proof that you provided that we all can see that they quit reporting on 08/13/2011. Keep in mind some suggest that they were reported up to at least March 2011. I hope they weren't posted and then yanked for some reason.
Aug 13, 2010 0 -100.00 1,071,924,272 0.00 No No Jul 30, 2010 94,207 100.00 428,242,532 1.00 No No Jan 29, 2010 0 -100.00 170,261,302 0.00 No No Jan 15, 2010 96,685 -96.99 99,620,416 1.00 No No Dec 31, 2009 3,209,537 5,460.43 109,615,900 1.00 No No Dec 15, 2009 57,721 1,054.42 424,079,733 1.00 No No Nov 30, 2009 5,000 100.00 542,658,485 1.00 No No Jul 31, 2009 0 -100.00 1,402,882 0.00 No No Jul 15, 2009 250,000 100.00 3,896,000 1.00 No No May 15, 2009 0 -100.00 7,941,286 0.00 No No Results Per Page 12345next
FINRA short sale numbers for Novemeber 2010 for FFGO!!!
2,910 short sale totals: 440,808,079. out of a total volume of 565,573,215 or 78% shares sold short. Note well the SEC only started publishing FINRA's daily short sale numbers in Nov. of 2010.
For anyone to this day, to think that the data is accurate on FFGO on the OTC site for the Reg SHO Bi-Monthly reports, is a farce. Flat out. Actually, it is so in accurate that they quit reporting the Short volume interest in FFGO last year on the OTCwebsite.
I am also pretty sure the T/A mentioned there were thousands of shareholders to me when I called them. Look these numbers over when you get a second. It is very enlightening. I suggest all longs take a deep look and grasp the enormity of it all. It is about time all longs start to support their investments. The data provided below is the SCAM on your/our investment! Not FFGO. It is the scam that has been done to FFGO, IMO. And the Below numbers are Made Public each and every day, per FINRA Daily Volumes. This compnay has been for many years and is presently under attack, still to this day, imo.
Shorty would make a lot of money off that Scam.. Especially with the FFGO short numbers having not been reported over a year now. That scam is out in the open and the fact that the FINRA Daily short #s being over 90% short since 02/17/2011 where a cool 500+ million shares traded in one trade and to this date could not have been covered.. See Below:
JAN 110,228,197/ 135,899,376 FEB 603,499,999/ 665,528,957 MAR 42,086,299/ 47,619,537 APR 55,046,743/ 57,719,305 MAY 71,734,677/ 77,653,022 JUN 49,116,056/ 49,366,056 JLY 189,497,794/ 191,797,794 AUG 168,375,995/ 188,509,493 SEP 20,197,000/ 20,996,700
Hi Road, not talking about 0 data. There was short data volume posted on OTC and FINRA between Aug.2010 and Jul.2011 which was later removed - and no one knows why. I spent many hours speaking with FINRA, SEC, OTC, AND TWO MMs THAT CONFIRMED THEY HAD SHORTED (as a hedge) DURING THAT TIME SPAN. Finra said they would "look into it", but I never heard back:
Tom, market makers shorting the stock to keep an orderly market
Has nothing to do with NSS
there was 75 BILLION shares issued .. and the company KNEW well in advance the company was going to be revoked and they would never have to pay out any fantasy divvy
I would love to see what Sloane Investments did with the stock{ 17 Billion shares ) Ron bought by Promissory note ( with zero disclosed terms for share holders to see)
Ron was also allowed to sell 50K per quarter
No MM's are still short in FFGO
No way
The TA still has records on what was sold ...
This was a game of " a group " of insiders .. running way with share holders money
unfortunately, this group.. are OFF SHORE operators and pretty much untouchable now
With FFGO revoked and no longer in business along with NMGL going dark or being revoked .. share holders will NEVER find out the truth


 Market Data
  Markets


 AI
AI