Actually the reporter was closer to the mark than you credit him. And there's no way to discern if it was personal opinion, or reporting based upon the information below.
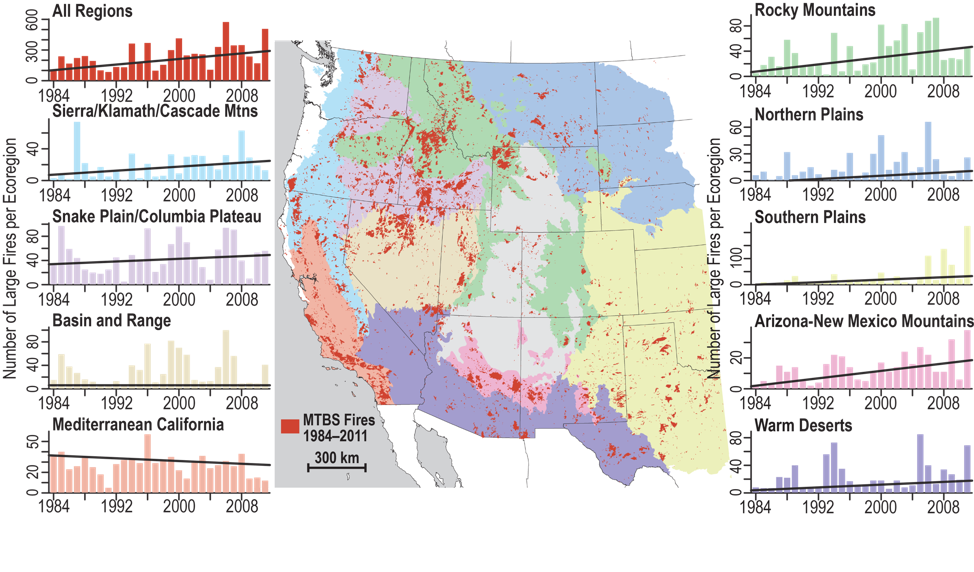
Climate change has been a key factor in increasing the risk and extent of wildfires in the Western United States. Wildfire risk depends on a number of factors, including temperature, soil moisture, and the presence of trees, shrubs, and other potential fuel.
All these factors have strong direct or indirect ties to climate variability and climate change. Climate change enhances the drying of organic matter in forests (the material that burns and spreads wildfire), and has doubled the number of large fires between 1984 and 2015 in the western United States.
Research shows that changes in climate create warmer, drier conditions. Increased drought, and a longer fire season are boosting these increases in wildfire risk. For much of the U.S. West, projections show that an average annual 1 degree C temperature increase would increase the median burned area per year as much as 600 percent in some types of forests.
In the Southeastern United States modeling suggests increased fire risk and a longer fire season, with at least a 30 percent increase from 2011 in the area burned by lightning-ignited wildfire by 2060.
Once a fire starts—more than 80 percent of U.S. wildfires are caused by people—warmer temperatures and drier conditions can help fires spread and make them harder to put out. Warmer, drier conditions also contribute to the spread of the mountain pine beetle and other insects that can weaken or kill trees, building up the fuels in a forest.
Land use and forest management also affect wildfire risk. Changes in climate add to these factors and are expected to continue to increase the area affected by wildfires in the United States.
Since 2000, 15 forest fires in the United States have caused at least $1 billion in damages each, mainly from the loss of homes and infrastructure, along with firefighting costs. The 2017 wildfire season was well above average, with deadly fires in California and throughout the West, including Montana, Oregon, and Washington state.
The 2018 wildfire season went on to also break records as the deadliest and most destructive season on record in California. NOAA estimates the total costs of wildfires in 2017 and 2018 to be more than $40 billion. In 2019, wildfires caused an estimated $4.5 billion in damages in California and Alaska. Alaska’s record-breaking heat and dry conditions over the summer months set the conditions for the state’s historic wildfire season.
In 2020, five of the six largest fires on record burned in California and Oregon saw historic levels of wildfire spread and damage. Wildfires across the West led to weeks-long periods of unhealthy air quality levels for millions of people.
See a map of billion-dollar extreme weather disasters here.
Wildfire can affect: Federal and State Budgets: U.S. Forest Service fire suppression expenditures had increased from about 15 percent of the agency’s appropriated budget to more than 50 percent in 2017. Nationwide suppression costs in 2017 and 2018 ballooned to $2.9 billion and $3.1 billion respectively, while state wildfire expenditures have also increased substantially.
Public Health: The growing number of people in wild lands is increasing the risk to life, property and public health. Smoke reduces air quality and can cause eye and respiratory illness, especially among children and the elderly. Wildfires that burn in residential areas can melt plastic water pipes and cause contamination of water systems with a known carcinogen.
Natural Environment: Wildfires are a natural part of many ecosystems. Although wildfires produce a number of greenhouse gases and aerosols including carbon dioxide, methane, and black carbon, the plants that re-colonize burned areas remove carbon from the atmosphere, generally leading to a net neutral effect on climate.
However, when fires burn more frequently and consume larger areas, as they are doing with climate change, the released greenhouse gases may not be completely removed from the atmosphere if plants can’t grow to maturity before burning, or if the plants that re-colonize are less efficient at carbon uptake.
How to Build Resilience
Communities, builders, homeowners, and forest managers can reduce the likelihood and impacts of wildfires by: ?Discouraging developments (especially residential) near fire-prone forests through smart zoning rules.
Increasing the space between structures and nearby trees and brush, and clearing space between neighboring houses. Incorporating fire-resistant design features and materials in buildings.
Increasing resources allocated to firefighting and fire prevention.
Removing fuels, such as dead trees, from forests that are at risk. Developing recovery plans before a fire hits, and implementing plans quickly after a fire to reduce erosion, limit flooding, and minimize habitat damage.
For more details on wildfire resilience, read our report, Resilience Strategies for Wildfire.
Not sure how much more evidence you need. Climate Change: How Do We Know? (Please see very, very bottom for personal thank yous.)
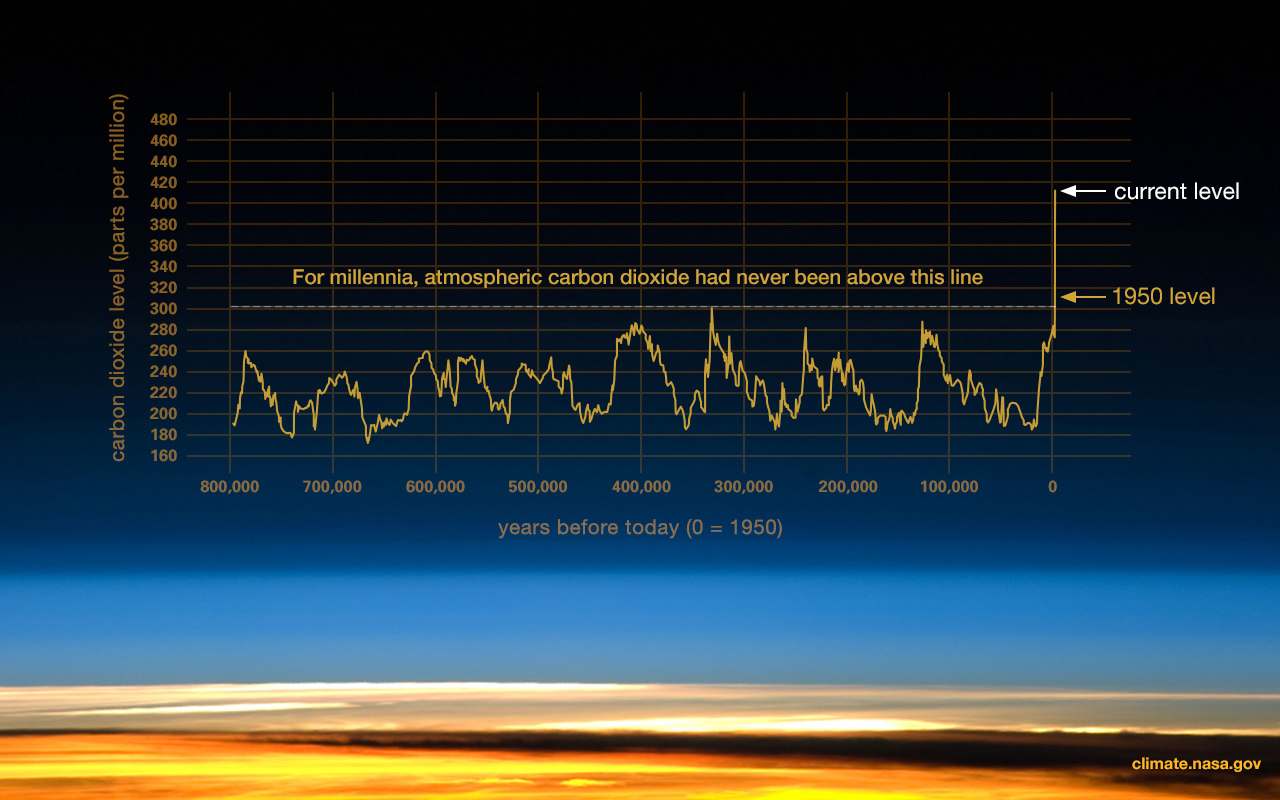
This graph, based on the comparison of atmospheric samples contained in ice cores and more recent direct measurements, provides evidence that atmospheric CO2 has increased since the Industrial Revolution. (Credit: Luthi, D., et al.. 2008; Etheridge, D.M., et al. 2010; Vostok ice core data/J.R. Petit et al.; NOAA Mauna Loa CO2 record.) Find out more about ice cores .. http://icecores.org/icecores/index.shtml .. (external site).
Earth's climate has changed throughout history. Just in the last 650,000 years there have been seven cycles of glacial advance and retreat, with the abrupt end of the last ice age about 11,700 years ago marking the beginning of the modern climate era — and of human civilization. Most of these climate changes are attributed to very small variations in Earth’s orbit that change the amount of solar energy our planet receives. - Scientific evidence for warming of the climate system is unequivocal. - Intergovernmental Panel on Climate Change - The current warming trend is of particular significance because most of it is extremely likely (greater than 95% probability) to be the result of human activity since the mid-20th century and proceeding at a rate that is unprecedented over millennia.1
Earth-orbiting satellites and other technological advances have enabled scientists to see the big picture, collecting many different types of information about our planet and its climate on a global scale. This body of data, collected over many years, reveals the signals of a changing climate.
The heat-trapping nature of carbon dioxide and other gases was demonstrated in the mid-19th century.2 Their ability to affect the transfer of infrared energy through the atmosphere is the scientific basis of many instruments flown by NASA. There is no question that increased levels of greenhouse gases must cause Earth to warm in response.
Ice cores drawn from Greenland, Antarctica, and tropical mountain glaciers show that Earth’s climate responds to changes in greenhouse gas levels. Ancient evidence can also be found in tree rings, ocean sediments, coral reefs, and layers of sedimentary rocks. This ancient, or paleoclimate, evidence reveals that current warming is occurring roughly ten times faster than the average rate of ice-age-recovery warming. Carbon dioxide from human activity is increasing more than 250 times faster than it did from natural sources after the last Ice Age.3
The evidence for rapid climate change is compelling:
Global Temperature Rise
The planet's average surface temperature has risen about 2.12 degrees Fahrenheit (1.18 degrees Celsius) since the late 19th century, a change driven largely by increased carbon dioxide emissions into the atmosphere and other human activities.4 Most of the warming occurred in the past 40 years, with the seven most recent years being the warmest. The years 2016 and 2020 are tied for the warmest year on record. 5
+ more - [there are embedded links in all "+ more"s below, not reproducible here]
Warming Ocean
The ocean has absorbed much of this increased heat, with the top 100 meters (about 328 feet) of ocean showing warming of more than 0.6 degrees Fahrenheit (0.33 degrees Celsius) since 1969.6 Earth stores 90% of the extra energy in the ocean.
+ more
Shrinking Ice Sheets
The Greenland and Antarctic ice sheets have decreased in mass. Data from NASA's Gravity Recovery and Climate Experiment show Greenland lost an average of 279 billion tons of ice per year between 1993 and 2019, while Antarctica lost about 148 billion tons of ice per year.7
Image: Flowing meltwater from the Greenland ice sheet
+ more
Glacial Retreat
Glaciers are retreating almost everywhere around the world — including in the Alps, Himalayas, Andes, Rockies, Alaska, and Africa.8
Image: The disappearing snowcap of Mount Kilimanjaro, from space.
+ more
Decreased Snow Cover
Satellite observations reveal that the amount of spring snow cover in the Northern Hemisphere has decreased over the past five decades and the snow is melting earlier.9
+ more
Sea Level Rise
Global sea level rose about 8 inches (20 centimeters) in the last century. The rate in the last two decades, however, is nearly double that of the last century and accelerating slightly every year.10
Image: Republic of Maldives: Vulnerable to sea level rise
+ more
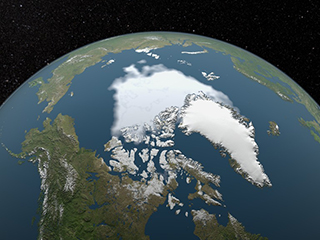
Declining Arctic Sea Ice
Both the extent and thickness of Arctic sea ice has declined rapidly over the last several decades.11
Image: Visualization of the 2012 Arctic sea ice minimum, the lowest on record
+ more
Extreme Events
The number of record high temperature events in the United States has been increasing, while the number of record low temperature events has been decreasing, since 1950. The U.S. has also witnessed increasing numbers of intense rainfall events.12
+ more
Ocean Acidification
Since the beginning of the Industrial Revolution, the acidity of surface ocean waters has increased by about 30%.13,14 This increase is the result of humans emitting more carbon dioxide into the atmosphere and hence more being absorbed into the ocean. The ocean has absorbed between 20% and 30% of total anthropogenic carbon dioxide emissions in recent decades (7.2 to 10.8 billion metric tons per year).15,16
+ more
References
IPCC Fifth Assessment Report, Summary for Policymakers
B.D. Santer et.al., “A search for human influences on the thermal structure of the atmosphere,” Nature vol 382, 4 July 1996, 39-46
Gabriele C. Hegerl, “Detecting Greenhouse-Gas-Induced Climate Change with an Optimal Fingerprint Method,” Journal of Climate, v. 9, October 1996, 2281-2306
V. Ramaswamy et.al., “Anthropogenic and Natural Influences in the Evolution of Lower Stratospheric Cooling,” Science 311 (24 February 2006), 1138-1141
B.D. Santer et.al., “Contributions of Anthropogenic and Natural Forcing to Recent Tropopause Height Changes,” Science vol. 301 (25 July 2003), 479-483.
T. Westerhold et. al., "An astronomically dated record of Earth’s climate and its predictability over the last 66 million years," Science vol. 369 (11 Sept. 2020), 1383-1387.
In 1824, Joseph Fourier calculated that an Earth-sized planet, at our distance from the Sun, ought to be much colder. He suggested something in the atmosphere must be acting like an insulating blanket. In 1856, Eunice Foote discovered that blanket, showing that carbon dioxide and water vapor in Earth's atmosphere trap escaping infrared (heat) radiation.
In the 1860s, physicist John Tyndall recognized Earth's natural greenhouse effect and suggested that slight changes in the atmospheric composition could bring about climatic variations. In 1896, a seminal paper by Swedish scientist Svante Arrhenius first predicted that changes in atmospheric carbon dioxide levels could substantially alter the surface temperature through the greenhouse effect.
In 1938, Guy Callendar connected carbon dioxide increases in Earth’s atmosphere to global warming. In 1941, Milutin Milankovic linked ice ages to Earth’s orbital characteristics. Gilbert Plass formulated the Carbon Dioxide Theory of Climate Change in 1956.
Vostok ice core data; NOAA Mauna Loa CO2 record Gaffney, O.; Steffen, W. (2017). "The Anthropocene equation," The Anthropocene Review (Volume 4, Issue 1, April 2017), 53-61.
von Schuckmann, K., Cheng, L., Palmer, D., Hansen, J., Tassone, C., Aich, V., Adusumilli, S., Beltrami, H., Boyer, T., Cuesta-Valero, F., Desbruyeres, D., Domingues, C., Garcia-Garcia, A., Gentine, P., Gilson, J., Gorfer, M., Haimberger, L., Ishii, M., Johnson, G., Killick, R., King, B., Kirchengast. G., Kolodziejczyk, N., Lyman, J., Marzeion, B., Mayer, M., Monier, M., Monselesan, D., Purkey, S., Roemmich, D., Schweiger, A., Seneviratne, S., Shepherd, A., Slater, D., Steiner, A., Straneo, F., Timmermans, ML., Wijffels, S. (2020). Heat stored in the Earth system: where does the energy go? Earth System Science Data (Volume 12, Issue 3, 07 September 2020), 2013-2041.
Velicogna, I., Mohajerani, Y., A, G., Landerer, F., Mouginot, J., Noel, B., Rignot, E., Sutterly, T., van den Broeke, M., van Wessem, M., Wiese, D. (2020). Continuity of ice sheet mass loss in Greenland and Antarctica from the GRACE and GRACE Follow-On missions. Geophysical Research Letters (Volume 47, Issue 8, 28 April 2020, e2020GL087291.
National Snow and Ice Data Center
World Glacier Monitoring Service
National Snow and Ice Data Center
Robinson, D. A., D. K. Hall, and T. L. Mote. 2014. MEaSUREs Northern Hemisphere Terrestrial Snow Cover Extent Daily 25km EASE-Grid 2.0, Version 1. [Indicate subset used]. Boulder, Colorado USA. NASA National Snow and Ice Data Center Distributed Active Archive Center. doi: https://doi.org/10.5067/MEASURES/CRYOSPHERE/nsidc-0530.001. [Accessed 9/21/18].
USGCRP, 2017: Climate Science Special Report: Fourth National Climate Assessment, Volume I [Wuebbles, D.J., D.W. Fahey, K.A. Hibbard, D.J. Dokken, B.C. Stewart, and T.K. Maycock (eds.)]. U.S. Global Change Research Program, Washington, DC, USA, 470 pp, doi: 10.7930/J0J964J6
C. L. Sabine et.al., “The Oceanic Sink for Anthropogenic CO2,” Science vol. 305 (16 July 2004), 367-371
Special Report on the Ocean and Cryosphere in a Changing Climate, Technical Summary, Chapter TS.5, Changing Ocean, Marine Ecosystems, and Dependent Communities, Section 5.2.2.3. https://www.ipcc.ch/srocc/chapter/technical-summary/
PS: As you know there is much, much, much... more evidence of man-made global warming on this board. All accessible via the search function which (thanks to the care and generosity of both the late F6 and the current administration of iHub ) is available to all posters (guessing readers too) on this board.
 Market Data
  Markets