Support: 888-992-3836
Copyright © 2023 InvestorsHub Inc.
Replies to post #7 on Canadian Overseas Petroleum Ltd (XOP)
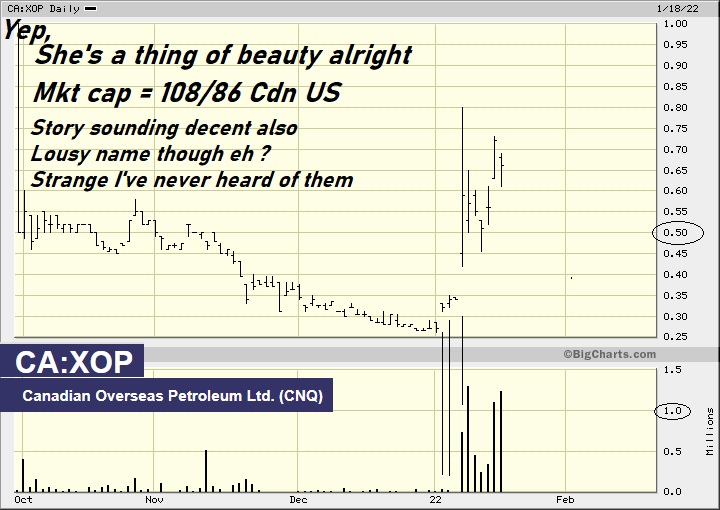
nowwhat2
01/26/22 12:20 AM
#8 RE: User-578577 #7
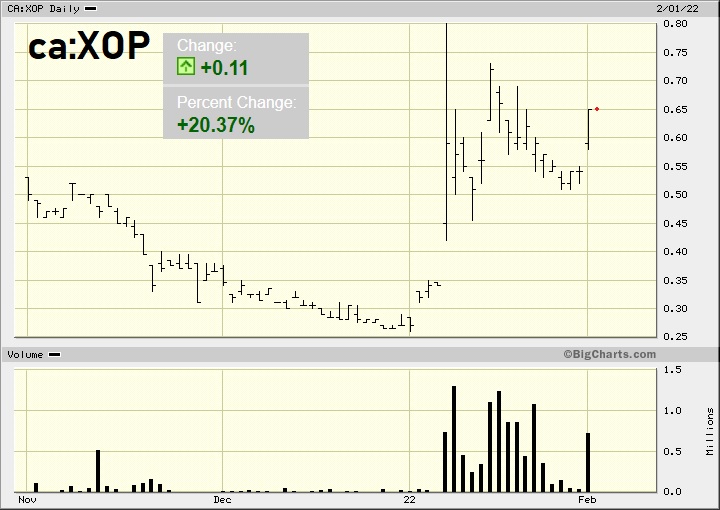
02/01/22 2:16 PM
#9 RE: User-578577 #7
Subscribe to Ad free and enjoy an ad-free experience
Try Now
Keep the Ads
 Market Data
  Markets