


This chart starts the 1st day after a wild hybernation of some sort.
Can't recall exactly what the explanation is/was.
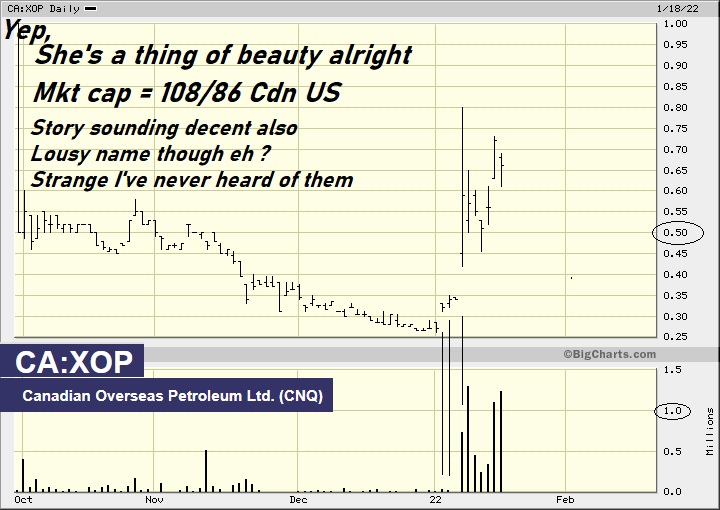
https://bigcharts.marketwatch.com/advchart/frames/frames.asp?show=&insttype=&symb=ca%3Axop&x=42&y=13&time=100&startdate=9%2F30%2F2020&enddate=2%2F21%2F2022&freq=1&compidx=aaaaa%3A0&comptemptext=&comp=none&ma=0&maval=9&uf=0&lf=1&lf2=0&lf3=0&type=2&style=320&size=3&timeFrameToggle=false&compareToToggle=false&indicatorsToggle=false&chartStyleToggle=false&state=9
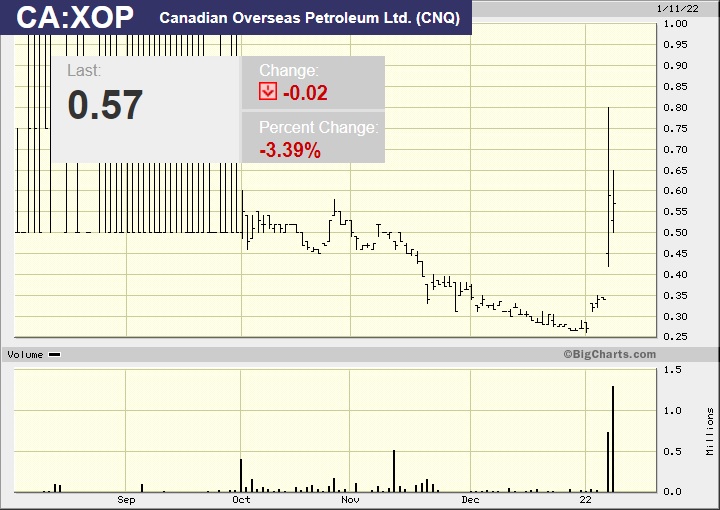
And then there is this chart (which includes some of the hibernation)
But for them to be showing up NOW (in the midst of a potentially significant broad mkt selloff) amps up the risk a bunch
Lingerie Fighting Championships Signs Broadcast Deal With Maybacks Global Entertainment • BOTY • Sep 26, 2024 9:00 AM
Maybacks Global Entertainment and Lingerie Fighting Championships Enter Into Broadcast And Revenue Sharing Agreement • AHRO • Sep 26, 2024 8:30 AM
North Bay Resources Commences Operations at Bishop Gold Mill, Inyo County, California; Engages Sabean Group Management Consulting • NBRI • Sep 25, 2024 9:15 AM
CEO David B. Dorwart Anticipates a Bright Future at Good Gaming Inc. Through His Most Recent Shareholder Update • GMER • Sep 25, 2024 8:30 AM
Cannabix Technologies and Omega Laboratories Inc. Advance Marijuana Breathalyzer Technology - Dr. Bruce Goldberger to Present at Society of Forensic Toxicologists Conference • BLOZF • Sep 24, 2024 8:50 AM
Integrated Ventures, Inc Announces Strategic Partnership For GLP-1 (Semaglutide) Procurement Through MedWell USA, LLC. • INTV • Sep 24, 2024 8:45 AM

