SPX Monitoring purposes; Neutral. Monitoring purposes GOLD: Long GDX on 1/29/19 at 21.96. Long Term Trend SPX monitor purposes; Long SPX on 10-19-18 at 2767.78
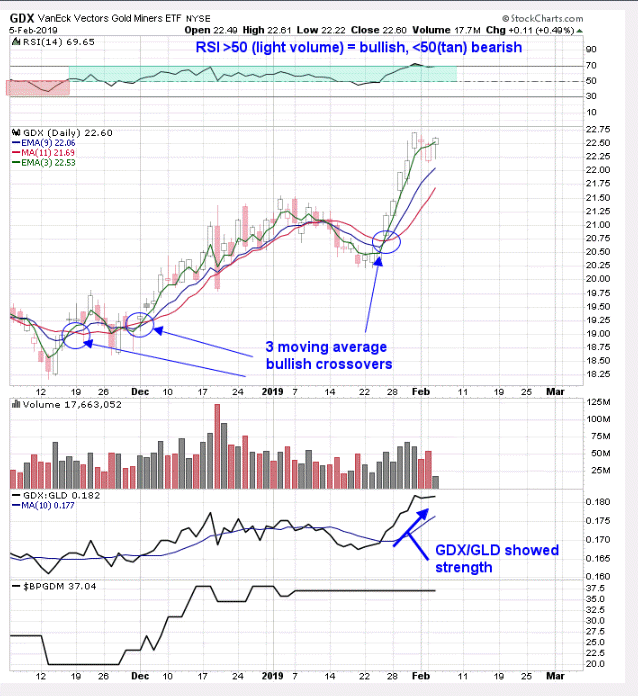
Above is a short term view of GDX. The top window is the RSI for GDX. Readings above RSI 50 are bullish (light blue) and those below 50 are bearish (TAN); right now the RSI is hovering near the 70 range at a sold bullish level. We have three moving averages on GDX, which are the 3-, 9-, and 11-period MAs. When all three either cross to the upside or cross to the downside, a bullish or bearish signal is triggered. In late January, all three crossed to the upside, triggering a bullish signal and remaining on the bullish signal. The second window up from the bottom is the GDX/GLD ratio, with a 10-period moving average. The GDX/GLD ratio crossed above its 10-period moving average, which triggered a bullish crossover. As it sets now, the short-term picture remains bullish and higher prices are expected. Long GDX on 1/29/19 at 21.97.
 Market Data
  Markets