The following are futures positions of non-commercials as of January 19, 2016. Change is week-over-week.
E-mini S&P 500: Here we go again! The usual sell-side optimism. The S&P just published 2017 operating earnings estimates for S&P 500 companies, and they are rosier than rosy.
As of January 21st, the consensus expects $140.69 next year, down from last week’s $141.11. Next year would be up 14.4 percent over this year, which, at $123, would be up 15.3 percent over 2015.
In all likelihood, next year’s estimates will meet the same fate as did estimates for 2015 and 2016. At the end of 2Q14, 2015 was expected to come in at $137.50, which has now been slashed to $106.65. Similarly, 2016 was at $137.50 in February last year.
The persistent downward revision is probably one reason why foreigners have been exiting U.S. stocks. In August through November last year, they sold $66 billion in equities. The last time the 12-month running total was positive was back in October 2013. And November last year was minus $107 billion – the highest monthly total ever.
Of late, domestic flows have not been cooperating either. From September 30th through Wednesday, nearly $35 billion left U.S.-based equity funds… just north of $26 billion in the year’s first three weeks alone (courtesy of Lipper).
Further, in the week ended Tuesday, $368 million came out of SPY, the SPDR S&P 500 ETF (courtesy of ETF.com).
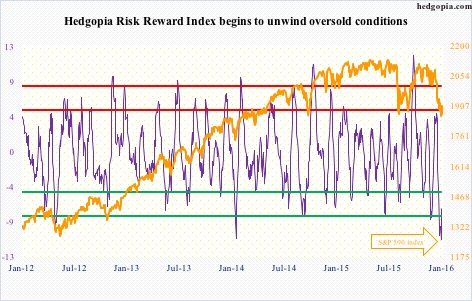
No wonder stocks have been taken to the woodshed. But this very factor is a reason to expect a reprieve – at least near term.
On Wednesday, the S&P 500 found support off of April/October 2014 lows, and staged a massive reversal, further building on it on both Thursday and Friday.
The path of least resistance is up, with the nearest major resistance at 1990.
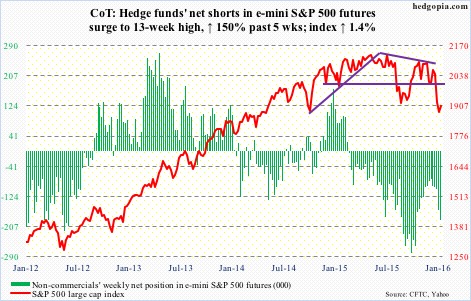
Right before the Wednesday reversal, non-commercials raised net shorts to a 13-week high, and could get squeezed.
Currently net short 188.5k, up 26.3k.
Nasdaq 100 index (mini): The Wednesday reversal was impressive – down 3.7 percent at one point but ended the session down 0.26 percent.
In a larger scheme of things, the index is still down 10 percent off December’s all-time highs. In many ways, the two-week drop has ominous look to it. The only way it is negated is if flows improve.
In the week ended Tuesday, $428 million came out of QQQ, the PowerShares QQQ ETF, (courtesy of ETF.com). That was just before the Wednesday reversal. Would this advance tempt inflows? This will hold the key as to how far this rally goes.
For them to be taken seriously, bulls need to clear resistance at 4350, which goes back to November 2014.
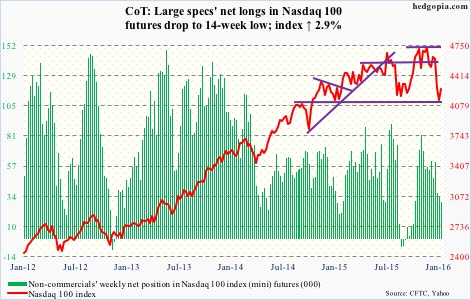
Non-commercials reduced net longs further, to a 14-week low.
Currently net long 29.1k, down 4.2k.
Russell 2000 mini-index: In the midst of the sell-off on Wednesday, small-caps were one of the areas that began to attract bids. Bio-techs were another. When it was all said and done, the Russell 2000 ended up 0.45 percent, reversing an earlier 3.7-percent drop.
In the following two sessions, the Russell 2000 struggled to garner the same momentum.
In the week ended Tuesday, $1.3 billion came out of IWM, the iShares Russell 2000 ETF, (courtesy of ETF.com). In all likelihood, these sellers will take their time to put their toes back into the water, if at all.
Sentiment can improve a whole lot if the index can conquer two-year resistance at 1080.
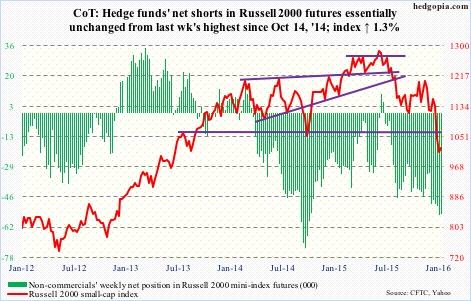
Currently net short 54.9k, down 159.
US Dollar Index: Has hugged the 50-day moving average since early December. The average is now beginning to flatten out.
Having failed to appreciably rally during the recent market mayhem, the path of least resistance near-term is probably down.
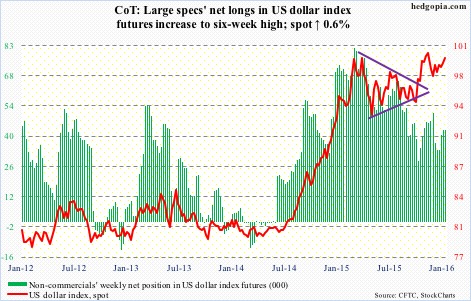
That said, the index is not that far away from the highs of March and November last year. And non-commercials continue to act like they do not anticipate a breakout. Holdings are substantially less versus back then.
Currently net long 42.8k, up 56.
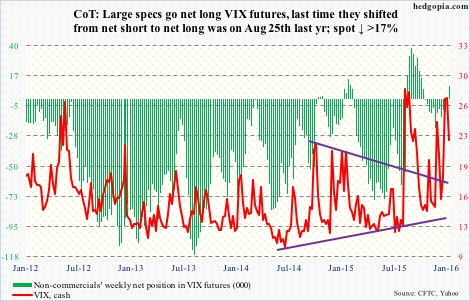
VIX: Several times in the past week or so, spot VIX would repeatedly spike intra-day only to close substantially off sessions highs. This was once again in evidence on Wednesday when the spot shot up to 32.09, only to close at 27.59.
This inability to hang on to gains was a big tell. Friday, VIX fell out of a three-week rising channel. More weakness probably lies ahead. The 50- and 200-day moving averages lie at 19.38 and 17.28, in that order.
And this! Non-commercials went net long. The last time they shifted from net short to net long was on August 25th; the S&P 500 bottomed a day earlier.
 Market Data
  Markets