


| Followers | 0 |
| Posts | 148553 |
| Boards Moderated | 7 |
| Alias Born | 03/10/2004 |
Saturday, January 16, 2016 9:58:49 AM
Peek Into Future Through Futures
* January 16, 2016
The following are futures positions of non-commercials as of January 12, 2016. Change is week-over-week.
E-mini S&P 500: Through Wednesday, $21 billion left U.S.-based equity funds this year – $9 billion in the latest week (courtesy of Lipper). No wonder stocks have taken a shellacking.
That said, at the risk of sounding desperate, here is a silver lining in the cloud. Major indices are near/slightly past September lows. Since September 30th (the S&P 500 bottomed on the 29th), nearly $30 billion has been withdrawn. Despite these huge outflows, stocks have only gone sideways.
At least in the near-term, the path of least resistance is probably up. However, unlike in late September from where major U.S. indices all rallied double digits, this time around stocks may not be as lucky. The difference between then and now is short interest.
On the Nasdaq, end-December short interest stood at 8.7 billion shares, versus 9.5 billion three months ago. On the NYSE, this was 17.4 billion and 18.4 billion, in that order. This is true across sector/industry ETFs, with energy being the major exception. Potential short-squeeze fuel is lacking.
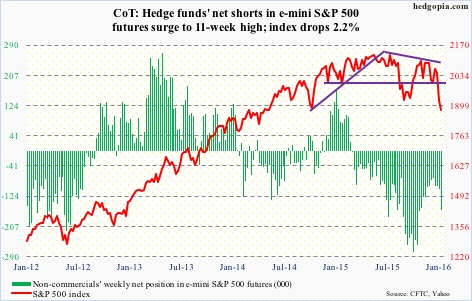
After a six-percent collapse in the prior week, the S&P 500 lost another 2.2 percent this week.
Non-commercials played it perfectly, having raised net shorts to an 11-week high. That said, holdings are substantially less than during September/October last year.
Currently net short 162.3k, up 58.1k.
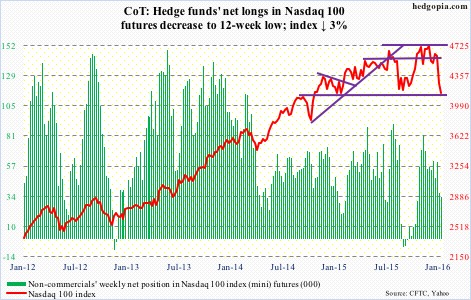
Nasdaq 100 index (mini): After an incessant rally, the Nasdaq 100 produced a doji in November, followed by a red candle in December. So far this month/year, it is down 9.8 percent.
The decline is coming in the wake of a relatively strong 8.4-percent rally last year, driven primarily by the likes of Facebook (FB), Amazon (AMZN), Netflix (NFLX) and Alphabet (GOOGL, formerly Google). The so-called FANG.
Interestingly, of the four, AMZN, FB and GOOGL had a monthly doji in December, while NFLX had what looks like a shooting star. These are all exhaustion signs, and could signal a sharp shift in sentiment.
Month/year-to-date, NFLX is down nine percent, AMZN down 15.6 percent, GOOGL down 8.7 percent, and FB down 9.3 percent.
The index is grossly oversold on a daily basis. Bulls need to first clear resistance at 4350, which goes back to November 2014.
Non-commercials reduced net longs further, to a 12-week low.
Currently net long 33.2k, down 2.7k.
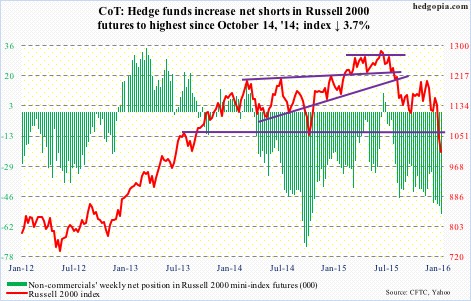
Russell 2000 mini-index: Small-caps get no love. In fact, they have been shunned for a while now.
In the current market mayhem, the Russell 2000 is one of the two major U.S. indices to have undercut October 2014 lows. The S&P 400 mid-cap index is the other.
In the process, the Russell 2000 now faces strong resistance at 1080, which goes back two-plus years. On its way to losing this support, the index faced strong resistance at 1210-1215, which goes back nearly two years, and then 1170.
Kudos to how well non-commercials played the downdraft in small-caps. They held firm even when the Russell 2000 rallied strongly to test the 1210-1215 resistance early December.
Net shorts are at the highest since October 2014.
Currently net short 55k, up 4.6k.
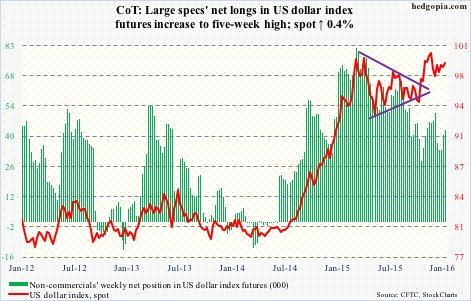
US Dollar Index: The Treasury yield curve is flattening. The two-year bill is now yielding 0.85 percent, down from 1.09 percent in late December. Lower yields, plus the Japanese yen’s perceived safe-haven status, is robbing the dollar index of an opportunity to rally during this time of uncertainty and risk-off.
This is probably as good a sign as any that the index is in the process of peaking.
After rallying 25 percent since the middle of 2014, it backed off after reaching 100-plus, a level that was retested in November. No breakout, but the index continues to hover near those highs.
Non-commercials are not anticipating a breakout either. Holdings are substantially less versus during the afore-mentioned highs.
Currently net long 42.7k, up 2k.
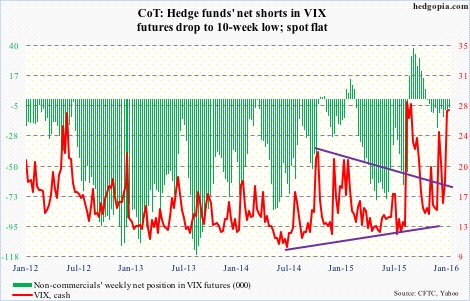
VIX: The S&P 500 yesterday undercut August/September 2015 lows, yet spot VIX was nowhere near its level back then.
That said, back in 2010, 2011 and of course last August, VIX peaked in the high 40s/low 50s, before stocks could hammer out an important bottom.
The odds of a similar spike are looking slim. The spot keeps squandering opportunities to hang on to intra-day gains. On Friday, it shot up to just under 31, but closed up only 12.8 percent to 27.02 – flat for the week.
A reversal may be round the corner.
Concurrently, for the second week, the VIX:VXV ratio closed north of one – 1.03 and 1.01, respectively.
Currently net short 6.6k, down 3.2k.
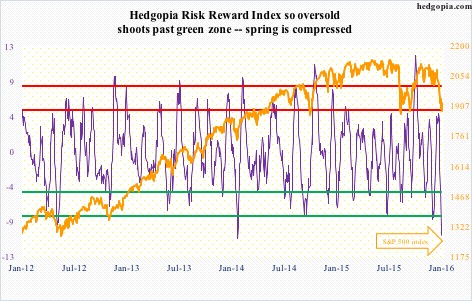
Hedgopia Risk Reward Index
http://www.hedgopia.com/cot-peek-into-future-through-futures-26/
• George.
Click on "In reply to", for Authors past commentaries.
* January 16, 2016
The following are futures positions of non-commercials as of January 12, 2016. Change is week-over-week.
E-mini S&P 500: Through Wednesday, $21 billion left U.S.-based equity funds this year – $9 billion in the latest week (courtesy of Lipper). No wonder stocks have taken a shellacking.
That said, at the risk of sounding desperate, here is a silver lining in the cloud. Major indices are near/slightly past September lows. Since September 30th (the S&P 500 bottomed on the 29th), nearly $30 billion has been withdrawn. Despite these huge outflows, stocks have only gone sideways.
At least in the near-term, the path of least resistance is probably up. However, unlike in late September from where major U.S. indices all rallied double digits, this time around stocks may not be as lucky. The difference between then and now is short interest.
On the Nasdaq, end-December short interest stood at 8.7 billion shares, versus 9.5 billion three months ago. On the NYSE, this was 17.4 billion and 18.4 billion, in that order. This is true across sector/industry ETFs, with energy being the major exception. Potential short-squeeze fuel is lacking.
After a six-percent collapse in the prior week, the S&P 500 lost another 2.2 percent this week.
Non-commercials played it perfectly, having raised net shorts to an 11-week high. That said, holdings are substantially less than during September/October last year.
Currently net short 162.3k, up 58.1k.

Nasdaq 100 index (mini): After an incessant rally, the Nasdaq 100 produced a doji in November, followed by a red candle in December. So far this month/year, it is down 9.8 percent.
The decline is coming in the wake of a relatively strong 8.4-percent rally last year, driven primarily by the likes of Facebook (FB), Amazon (AMZN), Netflix (NFLX) and Alphabet (GOOGL, formerly Google). The so-called FANG.
Interestingly, of the four, AMZN, FB and GOOGL had a monthly doji in December, while NFLX had what looks like a shooting star. These are all exhaustion signs, and could signal a sharp shift in sentiment.
Month/year-to-date, NFLX is down nine percent, AMZN down 15.6 percent, GOOGL down 8.7 percent, and FB down 9.3 percent.
The index is grossly oversold on a daily basis. Bulls need to first clear resistance at 4350, which goes back to November 2014.
Non-commercials reduced net longs further, to a 12-week low.
Currently net long 33.2k, down 2.7k.

Russell 2000 mini-index: Small-caps get no love. In fact, they have been shunned for a while now.
In the current market mayhem, the Russell 2000 is one of the two major U.S. indices to have undercut October 2014 lows. The S&P 400 mid-cap index is the other.
In the process, the Russell 2000 now faces strong resistance at 1080, which goes back two-plus years. On its way to losing this support, the index faced strong resistance at 1210-1215, which goes back nearly two years, and then 1170.
Kudos to how well non-commercials played the downdraft in small-caps. They held firm even when the Russell 2000 rallied strongly to test the 1210-1215 resistance early December.
Net shorts are at the highest since October 2014.
Currently net short 55k, up 4.6k.

US Dollar Index: The Treasury yield curve is flattening. The two-year bill is now yielding 0.85 percent, down from 1.09 percent in late December. Lower yields, plus the Japanese yen’s perceived safe-haven status, is robbing the dollar index of an opportunity to rally during this time of uncertainty and risk-off.
This is probably as good a sign as any that the index is in the process of peaking.
After rallying 25 percent since the middle of 2014, it backed off after reaching 100-plus, a level that was retested in November. No breakout, but the index continues to hover near those highs.
Non-commercials are not anticipating a breakout either. Holdings are substantially less versus during the afore-mentioned highs.
Currently net long 42.7k, up 2k.

VIX: The S&P 500 yesterday undercut August/September 2015 lows, yet spot VIX was nowhere near its level back then.
That said, back in 2010, 2011 and of course last August, VIX peaked in the high 40s/low 50s, before stocks could hammer out an important bottom.
The odds of a similar spike are looking slim. The spot keeps squandering opportunities to hang on to intra-day gains. On Friday, it shot up to just under 31, but closed up only 12.8 percent to 27.02 – flat for the week.
A reversal may be round the corner.
Concurrently, for the second week, the VIX:VXV ratio closed north of one – 1.03 and 1.01, respectively.
Currently net short 6.6k, down 3.2k.

Hedgopia Risk Reward Index

http://www.hedgopia.com/cot-peek-into-future-through-futures-26/
• George.
Click on "In reply to", for Authors past commentaries.
Information posted to this board is not meant to suggest any specific action, but to point out the technical signs that can help our readers make their own specific decisions. Your Due Dilegence is a must!
• gtsourdinis


