


Saturday, May 25, 2013 1:40:01 PM
What are your expectations regarding "Baytrail" GPU in light of the 6EU benchmarks? I am still getting about iPad 4 level graphics which should be quite good, but what are your thoughts?
I'd say it's still difficult to find a benchmark that is easy to extrapolate, but Anandtech has (almost) given us 2. I've pasted the screenshots of GLBench 2.7 and 3DMark Icestorm below, but here's a consolidation of scores:
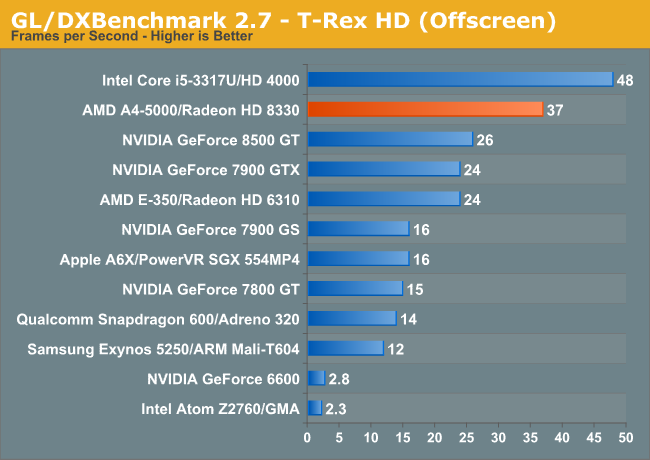
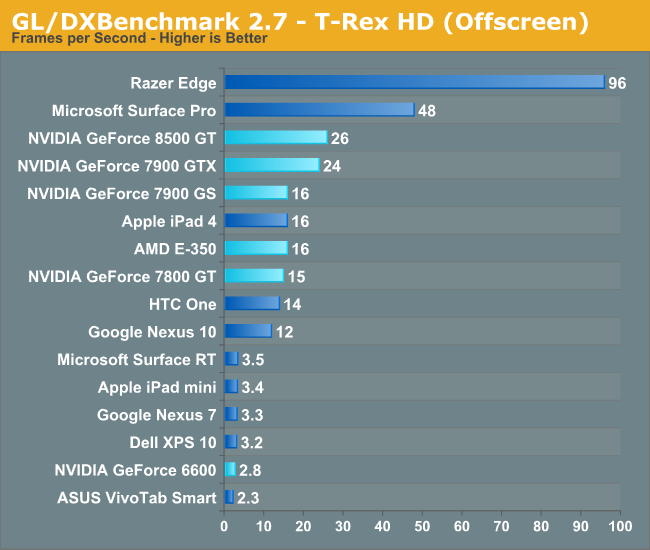
GLBench 2.7
Atom Z2760 (SGX545): 2.3 (0.06)
Nexus 7 (Tegra 3): 3.3 (0.09)
Exynos 5250 (Mali-T604): 12 (0.32)
Snapdragon 600 (Adreno 320): 14 (0.38)
iPad4 (A6X/554MP4): 16 (0.43)
Bobcat E350 (Radeon 6310): 24 (0.65)
Kabini A4-5000 (Radeon 8330): 37 (1.00)
Surface Pro (HD4000): 48 (1.30)
Core i5-3317U (HD4000): 48 (1.30)
Trinity (A10-4655M/Radeon 7620G): N/A
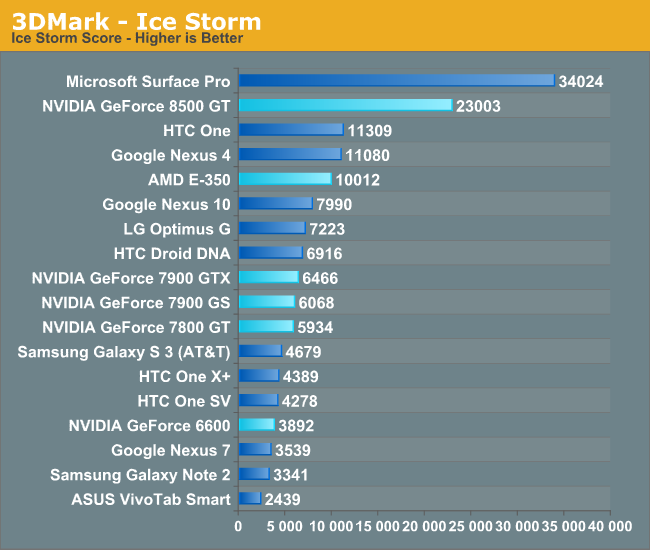
3DMark Icestorm
Atom Z2760 (SGX545): 2,439 (0.10)
Nexus 7 (Tegra 3): 3,539 (0.15)
Exynos 5250 (Mali-T604): 7,990 (0.34)
Bobcat E350 (Radeon 6310): 10,012 (0.42)
Snapdragon 600 (Adreno 320): 11,309 (0.49)
iPad4 (A6X/554MP4): N/A
Pentium 2020M (Ivy Bridge 6EU): 23,135 (0.97)
Kabini A4-5000 (Radeon 8330): 23,750 (1.00)
Dell XPS12 (HD4000): 32,841 (1.38)
Surface Pro (HD4000): 34,024 (1.43)
Trinity (A10-4655M/Radeon 7620G): 43,255 (1.82)
Using your linear projections will under-estimate Bay Trail performance, as we can see from the scaling between 16EU and 6EU on Icestorm. However, there is no iPad equivalent for this benchmark, so that too requires a projection. Unfortunately, with only two benchmarks and not a lot of data points, this will be fairly rough.
Looking at the EU count scalability in Icestorm, 37.5% of the EUs gave 68% of the performance, relative to the better Surface Pro score. I'd call that 55% scalability - or put another way, if I doubled the EU count, I'd expect only 55% more performance. This is actually a curve, not a straight line, and it needs to hit the origin (where 0EU = 0 performance). So to simulate a curve, if I were to project 40EU from 16EU (all else being equal, and no improvement in memory bandwidth, or architecture, etc.), then I might take half of the 55% (27.5%). But since I'm going the other way, another 37.5% reduction in EU count would need to be half of the difference in scalability 1-((1-0.55)/2) = 77.5%. And since 4EU into 6EU is only a 67% reduction, I'll split the difference and use 66% as my scalability number.
Therefore, I think we can expect performance to be at 78%: 1-((1-0.67)*0.66). That would yield a score of 18,045, assuming clock frequency stays at 1GHz. However, as I mentioned to David, the Bay Trail engine may not hit the same clock speeds as the 17W mobile processors, so it makes sense to derate it. And since I'm going further down the curve, I should use a more aggressive scalability rating. If I assume a 30% frequency derating (i.e. 700MHz), then the combination of EU reduction and frequency reduction brings me back to wanting to use 77.5%. From there, I'll take the EU reduction (67%), the frequency reduction (70%), and get the following: 1-((1-0.47)*0.775) = 23,135 * 0.59 = 13,650.
Of course, Bay Trail may in fact operate even slower than this in very thermal constrained scenarios, such as 8" tablets, so I really ought to give a range. Running at 500MHz, and using an 85% scalability factor yields 10,335.
As for iPad, I'm just going to SWAG this. Performance comes within 43% of Kabini in GLBench 2.7, and is 33% faster than Exynos 5250. If I align these to 3DMark Icestorm, I get 10,212 coming down from Kabini, and 10,653 coming up from Exynos 5250. I'll split the difference, and call it 10,430.
Therefore, I would project Bay Trail 700MHz to be roughly 30% faster than iPad4, and Bay Trail 500MHz to roughly be on par with iPad4.
Now, what happens if I scale Kabini's graphics core down to 225MHz, in order to project Temash 3.9W performance? Unfortunately, I don't have 2 datapoints on this graphics engine to get any idea of scalability. But, it does seem like it's a fairly large reduction in frequency, which puts it pretty far down the curve. Hypothetically, if I used the same 77.5% scalability number I used for Bay Trail, I'd get 1-((1-0.45)*0.775) = 0.57 * 23,750 = 13,540.
Now, at face value that's about even Bay Trail. I didn't intend for that to happen, and quite frankly with the limited data points I wouldn't take a lot of credibility in these numbers. However, I think it makes sense and feels right that Bay Trail 700MHz graphics performance should be ~similar to the Temash 3.9W performance. After all, in terms of raw GFLOPs, the two are fairly close (Bay Trail: 45GF, Temash: 58GF), and the actual delta of 30% is similar to Ivy Bridge 6EU and Kabini (96GF and 128GF, respectively). We'll have to see when the benchmarks come out, but for now, here's the consolidation of my projections:
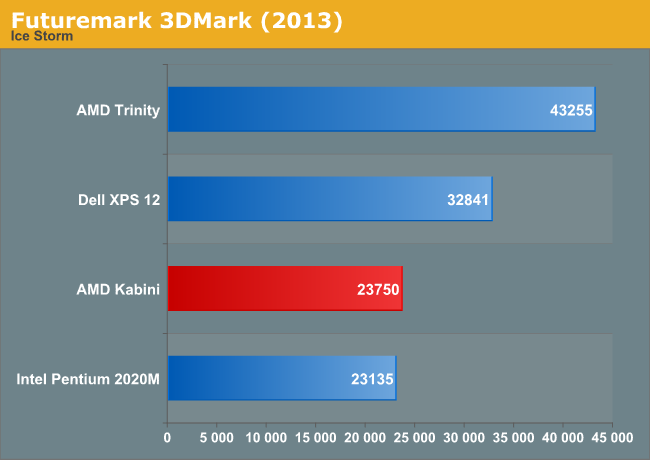
3DMark Icestorm
Atom Z2760 (SGX545): 2,439 (0.10)
Nexus 7 (Tegra 3): 3,539 (0.15)
Exynos 5250 (Mali-T604): 7,990 (0.34)
Bobcat E350 (Radeon 6310): 10,012 (0.42)
Bay Trail 500MHz projection: 10,335 (0.44)
iPad4 projection (A6X/554MP4): 10,430 (0.44)
Snapdragon 600 (Adreno 320): 11,309 (0.49)
Temash 3.9W projection: 13,540 (0.57)
Bay Trail 700MHz projection: 13,650 (0.57)
Pentium 2020M (Ivy Bridge 6EU): 23,135 (0.97)
Kabini A4-5000 (Radeon 8330): 23,750 (1.00)
Dell XPS12 (HD4000): 32,841 (1.38)
Surface Pro (HD4000): 34,024 (1.43)
Trinity (A10-4655M/Radeon 7620G): 43,255 (1.82)
Recent INTC News
- Futures Signal Continued Gains for Wall Street: Dow Jones, S&P, Nasdaq • IH Market News • 04/17/2026 01:23:37 PM
- Futures Indicate Further Upside for Wall Street: Dow Jones, S&P, Nasdaq • UK Market News • 04/17/2026 01:23:27 PM
- Intel Unveils Core Series 3 Mobile Chips Aimed at Value Segment • IH Market News • 04/16/2026 02:40:59 PM
- TSMC Delivers Record Q1 Profit, Flags Potential Middle East Supply Risks • IH Market News • 04/16/2026 11:28:45 AM
- Intel and Google Deepen Collaboration to Advance AI Infrastructure with Xeon CPUs and Custom IPUs • Business Wire • 04/09/2026 01:00:00 PM
- U.S. stock futures edge lower as markets await Iran ceasefire talks in Pakistan: Dow Jones, S&P, Nasdaq, Wall Street • IH Market News • 04/09/2026 11:36:18 AM
- U.S. stock futures slip as markets await Iran ceasefire talks in Pakistan: Dow Jones, S&P, Nasdaq, Wall Street • UK Market News • 04/09/2026 11:36:10 AM
- Form 8-K - Current report • Edgar (US Regulatory) • 04/08/2026 08:05:34 PM
- Intel shares rise after joining Terafab semiconductor initiative • IH Market News • 04/07/2026 01:50:28 PM
- Form 8-K - Current report • Edgar (US Regulatory) • 04/03/2026 04:50:37 PM
- Intel Appoints Aparna Bawa as Executive Vice President and Chief Legal & People Officer • Business Wire • 04/02/2026 08:05:00 PM
- Ceasefire Hopes and Strong Economic Data Power Wall Street Rally to Start Q2 • IH Market News • 04/01/2026 08:34:46 PM
- Intel to repurchase Apollo’s stake in Irish chip facility for $14.2 billion • IH Market News • 04/01/2026 02:48:34 PM
- Intel to Repurchase 49% Equity Interest in Ireland Fab Joint Venture • Business Wire • 04/01/2026 01:00:00 PM
- Intel to Report First-Quarter 2026 Financial Results • Business Wire • 03/31/2026 09:02:00 PM
- Form SCHEDULE 13G/A - Statement of Beneficial Ownership by Certain Investors: [Amend] • Edgar (US Regulatory) • 03/27/2026 01:51:11 PM
- Intel shares rise after report of planned CPU price increases • IH Market News • 03/25/2026 03:24:25 PM
- Form DEFA14A - Additional definitive proxy soliciting materials and Rule 14(a)(12) material • Edgar (US Regulatory) • 03/23/2026 08:38:44 PM
- Form DEF 14A - Other definitive proxy statements • Edgar (US Regulatory) • 03/23/2026 08:35:22 PM
- Form 4 - Statement of changes in beneficial ownership of securities • Edgar (US Regulatory) • 03/04/2026 12:57:09 AM
- Form 4 - Statement of changes in beneficial ownership of securities • Edgar (US Regulatory) • 03/04/2026 12:56:24 AM
- Form 4 - Statement of changes in beneficial ownership of securities • Edgar (US Regulatory) • 03/04/2026 12:55:26 AM
- Form 4 - Statement of changes in beneficial ownership of securities • Edgar (US Regulatory) • 03/04/2026 12:54:23 AM
- Form 4 - Statement of changes in beneficial ownership of securities • Edgar (US Regulatory) • 03/04/2026 12:53:24 AM


