



 AI
AI






| Followers | 0 |
| Posts | 148553 |
| Boards Moderated | 7 |
| Alias Born | 03/10/2004 |

Monday, April 07, 2025 4:52:00 PM
Markets Crashing into Spring Cycle Low
By: Jim Curry | April 6, 2025
With the action seen in recent weeks, the U.S. stock market is declining into an expected Spring cycle bottom, with Gold now joining in the decline. Each of these markets appear to have further to run before troughing, though we are into the window for a key bottom to form for U.S. stocks, which we will look at first.
U.S. Stock Market, Mid-Term
As mentioned back in January of this year, the mid-term cycles for the U.S. stock market were seen as pushing higher into the late-2024 to early-2025 region - before topping, and giving way to a sharp decline into this Spring.
The mid-term cycles for U.S. stocks are the 180 and 360-day waves, with the smaller 180-day cycle shown on the chart below, along with the S&P 500 index:
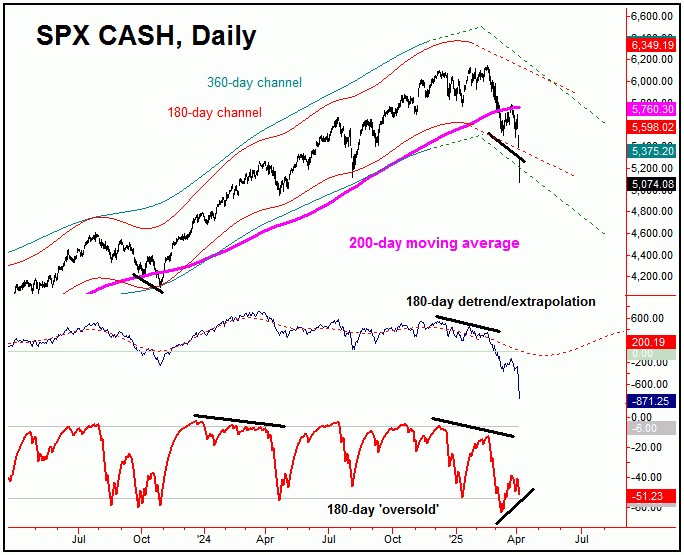
In terms of time, the next projected trough for our 180-day wave was due around mid- April of this year, but with a larger plus or minus variance in either direction - simply due to the size of the 180 and 360-day cycles.
In terms of technical action, of particular note were the divergences between price and our 180-day detrend, as well as with our 180-day 'oversold' indicator - which can be a key measure of momentum for the SPX (i.e., S&P 500 index). These were warning signals that a sharp correction was brewing, which we have obviously seen.
As mentioned in prior articles, following my rule that a cycle will take prices back to a moving average of the same length about 85% of the time, a normal correction with this 180-day wave in U.S. stocks would take prices back to the rising 200-day moving average on the SPX - which has been met on the current decline.
Having said the above, in our daily/weekly Market Turns reports (which track the U.S. stock market), we mentioned further downside 'risk' being to the lower 360-day moving average, simply due to the position of our larger 360-day time cycle, shown below:
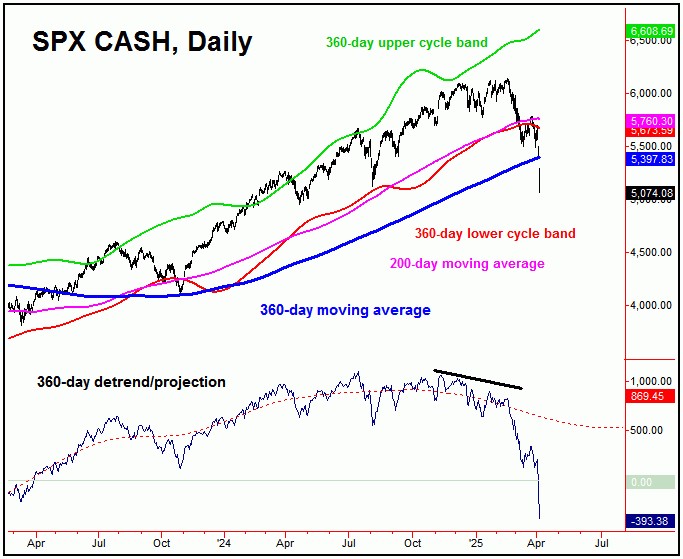
In looking at our 360-day cycle, the detrend that tracks this wave was also showing a divergence at the February peak - which was a technical warning sign, due to the time position of this wave, which was next projected to trough into mid-April.
In a recent daily Market Turns report, we mentioned that taking out the 5504.65 SPX CASH figure to the downside would favor a drop on down to the 360-day moving average, which was seen - and which has been decisively taken out.
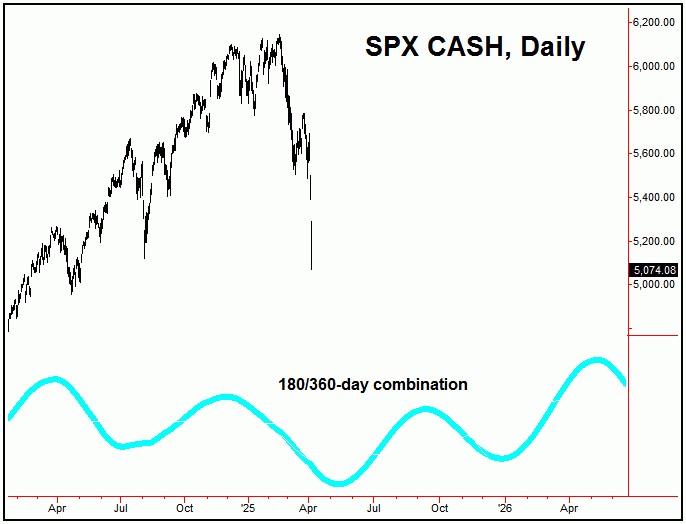
With the above said and noted, the next low of significance is expected to come from the combination of 180 and 360-day waves in U.S. stocks, which are projected to bottom around this mid-April window, though this could easily push out into early-May, due to the larger plus or minus variance in either direction.
Shown again below is a combination forecast, with the 180 and 360-day cycles:
Adding to the notes above, there are key technical signs that we track, with one of these being very rare - and which is shown on the next chart:
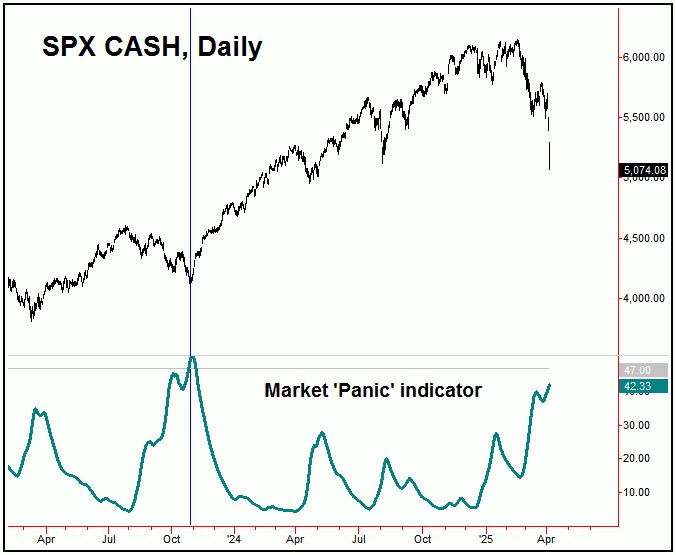
The above chart shows our market 'panic' indicator, which we originally introduced back in the Autumn of 2023. This indicator moves inverse to price action, and a buy signal is generated when it spikes above its upper reference line.
Going further with the above, the last buy signal with this market panic indicator came back on October 26th of 2023. This signal came within one trading day of the last major low in U.S. stocks, doing so at the 4137.23 SPX CASH figure. This was followed by an almost 50% advance, into the most recent high of 6147.43.
Signals with this market 'panic' indicator are not triggered often - with none generated in 2024. With the current decline, it will be key if a new buy signal should be triggered in the days/weeks ahead - which we will be watching with keen interest in our daily Market Turns report.
Stepping back further, once the next 180 and 360-day trough is in place on the SPX, the probabilities will favor a sharp rally of some 17-20% or more playing out in the months to follow, with more precise details of how this will unfold noted in our daily and weekly Market Turns reports.
Read Full Story »»»
 DiscoverGold
By: Jim Curry | April 6, 2025
With the action seen in recent weeks, the U.S. stock market is declining into an expected Spring cycle bottom, with Gold now joining in the decline. Each of these markets appear to have further to run before troughing, though we are into the window for a key bottom to form for U.S. stocks, which we will look at first.
U.S. Stock Market, Mid-Term
As mentioned back in January of this year, the mid-term cycles for the U.S. stock market were seen as pushing higher into the late-2024 to early-2025 region - before topping, and giving way to a sharp decline into this Spring.
The mid-term cycles for U.S. stocks are the 180 and 360-day waves, with the smaller 180-day cycle shown on the chart below, along with the S&P 500 index:
In terms of time, the next projected trough for our 180-day wave was due around mid- April of this year, but with a larger plus or minus variance in either direction - simply due to the size of the 180 and 360-day cycles.
In terms of technical action, of particular note were the divergences between price and our 180-day detrend, as well as with our 180-day 'oversold' indicator - which can be a key measure of momentum for the SPX (i.e., S&P 500 index). These were warning signals that a sharp correction was brewing, which we have obviously seen.
As mentioned in prior articles, following my rule that a cycle will take prices back to a moving average of the same length about 85% of the time, a normal correction with this 180-day wave in U.S. stocks would take prices back to the rising 200-day moving average on the SPX - which has been met on the current decline.
Having said the above, in our daily/weekly Market Turns reports (which track the U.S. stock market), we mentioned further downside 'risk' being to the lower 360-day moving average, simply due to the position of our larger 360-day time cycle, shown below:
In looking at our 360-day cycle, the detrend that tracks this wave was also showing a divergence at the February peak - which was a technical warning sign, due to the time position of this wave, which was next projected to trough into mid-April.
In a recent daily Market Turns report, we mentioned that taking out the 5504.65 SPX CASH figure to the downside would favor a drop on down to the 360-day moving average, which was seen - and which has been decisively taken out.
With the above said and noted, the next low of significance is expected to come from the combination of 180 and 360-day waves in U.S. stocks, which are projected to bottom around this mid-April window, though this could easily push out into early-May, due to the larger plus or minus variance in either direction.
Shown again below is a combination forecast, with the 180 and 360-day cycles:
Adding to the notes above, there are key technical signs that we track, with one of these being very rare - and which is shown on the next chart:
The above chart shows our market 'panic' indicator, which we originally introduced back in the Autumn of 2023. This indicator moves inverse to price action, and a buy signal is generated when it spikes above its upper reference line.
Going further with the above, the last buy signal with this market panic indicator came back on October 26th of 2023. This signal came within one trading day of the last major low in U.S. stocks, doing so at the 4137.23 SPX CASH figure. This was followed by an almost 50% advance, into the most recent high of 6147.43.
Signals with this market 'panic' indicator are not triggered often - with none generated in 2024. With the current decline, it will be key if a new buy signal should be triggered in the days/weeks ahead - which we will be watching with keen interest in our daily Market Turns report.
Stepping back further, once the next 180 and 360-day trough is in place on the SPX, the probabilities will favor a sharp rally of some 17-20% or more playing out in the months to follow, with more precise details of how this will unfold noted in our daily and weekly Market Turns reports.
Read Full Story »»»
 DiscoverGold
Information posted to this board is not meant to suggest any specific action, but to point out the technical signs that can help our readers make their own specific decisions. Caveat emptor!
• DiscoverGold
Discover What Traders Are Watching
Explore small cap ideas before they hit the headlines.



