


| Followers | 66 |
| Posts | 1096 |
| Boards Moderated | 0 |
| Alias Born | 10/19/2020 |
Friday, December 02, 2022 11:38:15 PM
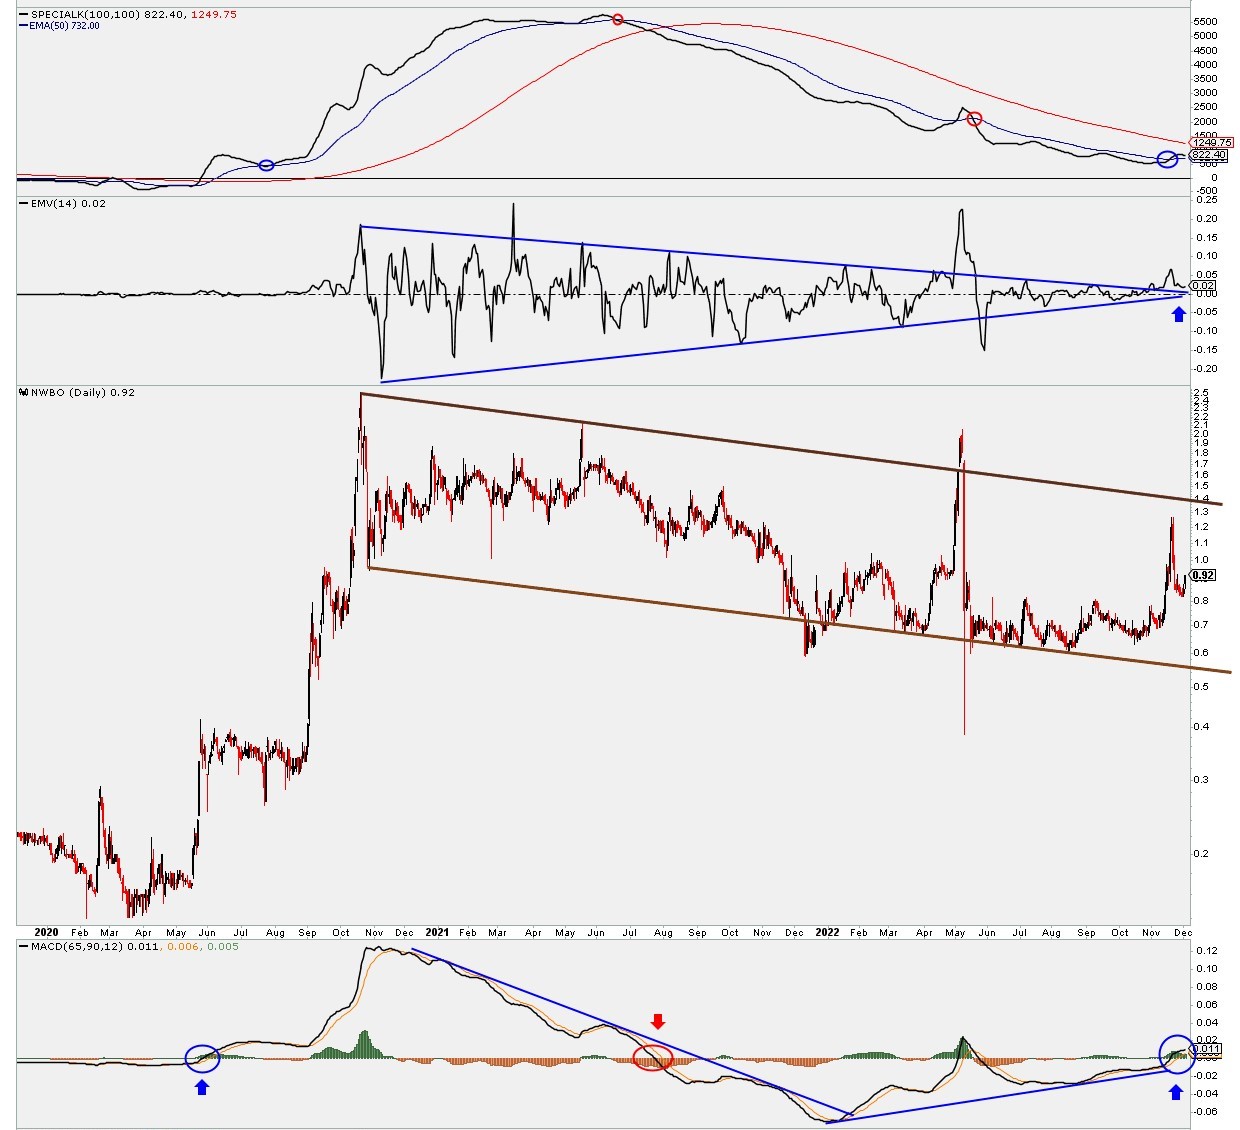
Big Picture View of Daily ~ 3 Year Daily View to see the Amazing Setups happening with Multiple Long Term Indicators. All coming together ready to bust out:
1. Pring Special K crossing 50 SMA
2. EMV Breaking out of 2 Year Wedge ~ Coincides exactly with price from $2.50 and Huge spread wide Wedge top to now Extreme tight Wedge & breaking out with the classic back test(Added blue arrow).....Amazing Action
3. Long Term MACD 65,90,12 Can see when we initially crossed Centerline when party started May 2020(Blue Circle with arrow). Crossed back down below Centerline after ASM(Red Circle with arrow). MACD has been working it's way back to Centerline for a year; and now finally Crossed Centerline again(Blue Circle with arrow).
In other words, we have finally completed the 2 Year Flag, worked off the Overbought & Over Extended Conditions and JUST getting started NOW.

Recent NWBO News
- Northwest Biotherapeutics Announces Establishment Of the Company's Own Dedicated Leukapheresis Clinic • PR Newswire (US) • 04/21/2026 01:30:00 PM
- Northwest Biotherapeutics Announces Establishment Of the Company's Own Dedicated Leukapheresis Clinic • PR Newswire (US) • 04/21/2026 01:30:00 PM
- Form EFFECT - Notice of Effectiveness • Edgar (US Regulatory) • 04/21/2026 04:15:08 AM
- Form POS AM - Post-Effective amendments for registration statement • Edgar (US Regulatory) • 04/16/2026 09:25:30 PM
- Form 8-K - Current report • Edgar (US Regulatory) • 04/07/2026 04:30:50 PM
- Form NT 10-K - Notification of inability to timely file Form 10-K 405, 10-K, 10-KSB 405, 10-KSB, 10-KT, or 10-KT405 • Edgar (US Regulatory) • 03/31/2026 09:04:37 PM
- Form 8-K - Current report • Edgar (US Regulatory) • 01/15/2026 10:06:20 PM
- Form 8-K - Current report • Edgar (US Regulatory) • 01/02/2026 10:14:59 PM
- Form DEF 14A - Other definitive proxy statements • Edgar (US Regulatory) • 11/28/2025 09:43:27 PM
- Form 424B5 - Prospectus [Rule 424(b)(5)] • Edgar (US Regulatory) • 11/25/2025 10:23:07 PM
- Form 8-K - Current report • Edgar (US Regulatory) • 11/20/2025 09:26:03 PM
- Form PRE 14A - Other preliminary proxy statements • Edgar (US Regulatory) • 11/19/2025 09:15:48 PM
- Form 10-Q - Quarterly report [Sections 13 or 15(d)] • Edgar (US Regulatory) • 11/14/2025 09:44:21 PM
- Form 8-K - Current report • Edgar (US Regulatory) • 10/31/2025 04:29:10 PM
- Form 8-K - Current report • Edgar (US Regulatory) • 10/30/2025 08:40:05 PM
- Form 8-K - Current report • Edgar (US Regulatory) • 10/24/2025 04:28:38 PM
- Form 8-K - Current report • Edgar (US Regulatory) • 10/14/2025 06:22:26 PM
- Form 10-Q - Quarterly report [Sections 13 or 15(d)] • Edgar (US Regulatory) • 08/14/2025 09:00:38 PM
- Form 424B5 - Prospectus [Rule 424(b)(5)] • Edgar (US Regulatory) • 07/01/2025 09:04:38 PM


