


| Followers | 0 |
| Posts | 148553 |
| Boards Moderated | 7 |
| Alias Born | 03/10/2004 |
Thursday, September 03, 2020 2:19:02 PM
Trading Alphabet as the Nasdaq Slides 5%
By: TheStreet | September 3, 2020
• Alphabet is a favorite among investors and just made new highs. Is that run coming to an end? Let's look at the stock charts.
Alphabet (GOOGL) shares were finally giving investors the move they wanted, with shares jumping to new all-time highs.
However, the move was short-lived. On Thursday, the gains wee unwound, with shares down more than 5% and teetering on short-term support.
Bulls are grappling with the depth of this current pullback. At the session low, the Nasdaq was down about 5.2% on Thursday, while the S&P 500 was off 3.5%.
Is it a one or day dip or are we looking at something more substantial? At this point, there’s no way to tell. We need to get an idea of the market breadth and investors need to watch for key short-term support levels to break or hold.
Traders must be willing to change gears when necessary, but let’s not be overly quick to bet against the trend, which is still to the upside.
For Alphabet, there are a few key marks to keep an eye on. With that in mind, let’s take a closer look at the charts to see where they are.
Trading Alphabet Stock
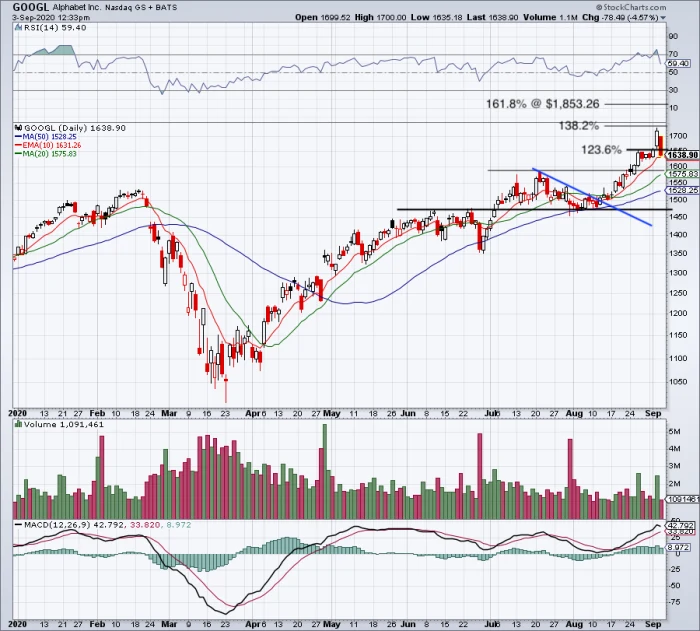
Daily chart of Alphabet stock.
Chart courtesy of Stockcharts.com
Alphabet stock has not been booming to the upside like some of its mega-cap peers. Specifically, it has lagged names like Apple (AAPL), Microsoft (MSFT) and Amazon (AMZN).
However, the stock was able to break out to new highs in July. After consolidating, Alphabet stock then broke out over short-term downtrend resistance (blue line) and ripped to new highs once again.
Ideally, bulls will see the 10-day moving average hold as support, followed by Alphabet stock reclaiming short-term resistance and the 123.6% extension near $1,654.
Back above that zone will put the current high at $1,726.10 and the 138.2% extension in play at $1,730. Above that and the 161.8% extension is on the table at $1,853.
Currently though, that feels like a tall order. For now, let’s see if the 10-day moving average holds as support. We don't need to be in a hurry to trade this one — we can see how the charts set up, first.
Should the 10-day fail as support, it puts the July high in play at $1,587, along with the 20-day moving average. If the selling really accelerates, let’s see if we test the 50-day moving average and the July breakout level near $1,460 to $1,470. Below that and we could see an acceleration in the selloff.
Read Full Story »»»
 DiscoverGold
Information posted to this board is not meant to suggest any specific action, but to point out the technical signs that can help our readers make their own specific decisions. Caveat emptor!
• DiscoverGold
Recent GOOG News
- Investors seeking SpaceX exposure have alternatives ahead of blockbuster IPO • IH Market News • 05/26/2026 02:05:09 PM
- Google commits $15 billion to Missouri expansion with new data center project (GOOG) • IH Market News • 05/21/2026 10:23:23 AM
- Google expands AI push at I/O with enterprise-focused Gemini upgrades and smarter search tools • IH Market News • 05/20/2026 10:35:17 AM
- EssilorLuxottica shares retreat as Google and Samsung step up competition in AI glasses market • UK Market News • 05/20/2026 09:17:08 AM
- Trump’s Iran Remarks Lift Hopes for Peace Deal as Markets Track Oil and AI Momentum: Dow Jones, S&P, Nasdaq, Wall Street Futures • IH Market News • 05/19/2026 09:29:24 AM
- Markets rise on renewed optimism over possible U.S.-Iran breakthrough: Dow Jones, S&P, Nasdaq, Wall Street Futures • UK Market News • 05/19/2026 09:29:15 AM
- Tech results, oil rally and Fed decision shape market direction: Dow Jones, S&P, Nasdaq, Wall Street Futures • UK Market News • 04/30/2026 09:23:09 AM
- Tech earnings, oil spike and Fed decision drive market moves: Dow Jones, S&P, Nasdaq, Wall Street Futures • IH Market News • 04/30/2026 09:23:05 AM
- Alphabet shares rise after earnings beat fueled by Cloud and Search strength • IH Market News • 04/30/2026 06:32:35 AM
- Markets Steady Ahead of Fed Decision and Key Tech Earnings: Dow Jones, S&P, Nasdaq, Wall Street Futures • IH Market News • 04/29/2026 09:16:13 AM
- Markets Hold Steady Ahead of Fed Call and Big Tech Earnings: Dow Jones, S&P, Nasdaq, Wall Street Futures • UK Market News • 04/29/2026 09:15:43 AM
- Google expands Pentagon partnership with AI deal for classified operations • IH Market News • 04/28/2026 10:04:58 AM
- Five Key Market Themes to Watch in the Week Ahead • IH Market News • 04/27/2026 10:29:55 AM
- Google DeepMind Teams Up With South Korea on AI Research Drive • IH Market News • 04/27/2026 10:09:38 AM
- Google Cloud Launches $750m Fund to Accelerate AI Partner Ecosystem • IH Market News • 04/22/2026 12:48:34 PM
- Apple Takes Top Spot in Global Smartphone Market for First Time in Q1 2026 • IH Market News • 04/10/2026 12:29:49 PM
- Waymo Says Remote Staff Do Not “Directly” Operate Its Robotaxis • IH Market News • 02/18/2026 10:10:13 AM
- Closing the Intent-to-Execution Gap May Define Next Wave of AI Investment • InvestorsHub NewsWire • 02/17/2026 02:00:00 PM
- Closing the Intent-to-Execution Gap May Define Next Wave of AI Investment • GlobeNewswire Inc. • 02/17/2026 01:30:00 PM
- Alphabet completes pricing of $20 billion multi-tranche bond sale • IH Market News • 02/10/2026 03:05:55 PM
- Apple and Google agree to app store reforms following UK competition scrutiny • IH Market News • 02/10/2026 01:19:10 PM
- Markets Turn to Earnings and Key Data as Japan PM’s Election Gamble Pays Off: Dow Jones, S&P, Nasdaq, Wall Street Futures • IH Market News • 02/09/2026 10:03:14 AM
- Markets Look to Earnings and Data This Week as Japan PM’s Election Bet Pays Off: Dow Jones, S&P, Nasdaq, Wall Street Futures • UK Market News • 02/09/2026 10:03:02 AM
- Wall Street Futures Point Higher as Bargain Buyers Step In After Tech Selloff: Dow Jones, S&P, Nasdaq • IH Market News • 02/06/2026 02:15:21 PM
- Wall Street Seen Opening Firmer as Investors Eye Bargains After Tech Rout: Dow Jones, S&P, Nasdaq • UK Market News • 02/06/2026 02:15:09 PM


